On: 27 April 2014, At: 20:23 Publisher: Taylor & Francis
Informa Ltd Registered in England and Wales Registered Number: 1072954 Registered office: Mortimer House, 37-41 Mortimer Street, London W1T 3JH, UK
International Journal of Systems Science
Publication details, including instructions for authors and subscription information: http://www.tandfonline.com/loi/tsys20
A novel approach for optimizing the optical
performance of the broadband tap coupler
Chih-Ming Hsu a , Chao-Ton Su b & Dirac Liao c a
Department of Business Administration , Minghsin University of Science and Technology , Hsinchu, Taiwan, ROC
b
Department of Industrial Engineering and Management , National Chiao Tung University , Hsinchu, Taiwan, ROC
c
Browave Corporation , Hsinchu, Taiwan, ROC Published online: 01 Feb 2008.
To cite this article: Chih-Ming Hsu , Chao-Ton Su & Dirac Liao (2003) A novel approach for optimizing the optical performance of the broadband tap coupler, International Journal of Systems Science, 34:3, 215-226, DOI: 10.1080/0020772031000115605 To link to this article: http://dx.doi.org/10.1080/0020772031000115605
PLEASE SCROLL DOWN FOR ARTICLE
Taylor & Francis makes every effort to ensure the accuracy of all the information (the “Content”) contained in the publications on our platform. However, Taylor & Francis, our agents, and our licensors make no
representations or warranties whatsoever as to the accuracy, completeness, or suitability for any purpose of the Content. Any opinions and views expressed in this publication are the opinions and views of the authors, and are not the views of or endorsed by Taylor & Francis. The accuracy of the Content should not be relied upon and should be independently verified with primary sources of information. Taylor and Francis shall not be liable for any losses, actions, claims, proceedings, demands, costs, expenses, damages, and other liabilities whatsoever or howsoever caused arising directly or indirectly in connection with, in relation to or arising out of the use of the Content.
This article may be used for research, teaching, and private study purposes. Any substantial or systematic reproduction, redistribution, reselling, loan, sub-licensing, systematic supply, or distribution in any
form to anyone is expressly forbidden. Terms & Conditions of access and use can be found at http:// www.tandfonline.com/page/terms-and-conditions
International Journal of Systems Science
volume 34, number 3, 20 February 2003, pages 215-226
0
,-
Taylor & Francis Taylor&Franc~s CroupA novel approach for optimizing the optical performance of
the broadband tap coupler
CHIH-MING
H s u ~ ,
CHAO-TON SUS* andDIRAC
L I A O ~
An integrated approach using neural networks, exponential desirability functions and genetic algorithms to optimize parameter design problems with multiple responses is presented. The proposed approach aims to identify the input parameter settings to maximize the overall minimal satisfaction level with respect to all the responses. The proposed approach is illustrated by optimizing the fused process parameters created during fused biconic taper coupler development to improve the performance and reliability of a 1% (1199) single-window broadband tap coupler. The proposed solution procedure was implemented on a Taiwanese manufacturer of fibreoptic passive components. The implementation results demonstrate the practicability of the method. Comparison analysis revealed that the proposed procedure outperformed the traditional Taguchi method in resolving multi-response parameter design problems.
1. Introduction
There are applications in fibreoptic systems where it is desirable to combine separate optical signals or divide the optical signal. Such multi- and demultiplexing tasks are handled by optical couplers. Various methods have been developed to fabricate the coupling elements. Among these, the fused biconic taper (FBT) method is the most popular coupler fabrication technology. The fibre-fusing structure and fabrication methods are shown in figure 1
a as hi ma
1995). The couplers are made in the FBT process by taking a group of fibres with the claddings exposed, applying tension and heat- ing the junction using a flame or electric discharge. The softened parts are formed into a tapered shape. In this tapered portion, the distance between the fibre cores becomes close and non-negligible coupling takes place between the cores. This procedure produces a very thin tapered region that must be processed extremely carefully. This region must be packaged to protect the components during shipping, handling and installation.Received 1 1 September 2001. Revised 23 December 2002. Accepted 20 March 2003.
tDepartment of Business Administration, Minghsin University of Science and Technology, Hsinchu, Taiwan, ROC.
$Department of Industrial Engineering and Management, National Chiao Tung University, Hsinchu, Taiwan, ROC.
SBrowave Corporation, Hsinchu, Taiwan, ROC.
* To whom correspondence should be addressed.
In a typical package (figure 2), the fused fibre section is suspended above a quartz substrate and positioned between two epoxy supports for mechanical stability. This assembly is then enclosed inside a metal tube and sealed. The FBT process is used because of its availabil- ity, relatively low cost, and inherent environmental stability and versatility.
Optical performance in a coupler manufacturing process is usually influenced by several variables that include the machine parameters, raw materials, process and environmental conditions. From the cost or feasibil- ity perspective, some variables cannot be precisely con- trolled. Even when these variables are controllable, the optimal combination of parameter levels that maximizes product quality may be unknown. Off-line quality con- trol is a cost-effective means of reducing variation and enhancing product and process quality. The Taguchi method is a conventional approach to resolving this problem and allows engineers to determine a feasible combination of design parameter levels. While many Taguchi method applications emphasize single-response problems, multi-response problems are quite prevalent and important across various application areas. The Taguchi method can only obtain an optimal combina- tion of discrete factor levels. This study proposes an integrated approach based on neural networks, exponential desirability functions and genetic algo- rithms that aims to identify the input control factor settings and thus maximize the overall minimal level of
Intevnational Journul of Systems Science ISSN 0020-7721 print/ISSN 1464-5319 online 8 2003 Taylor & Francis Ltd http://www.tandf.co.uk/journals
DOI: 10.1080/0020772031000115605
Fiber
/
Jacket1
Fibern
Electrode Coupling Length L-
Fused Part ( Tapered) /)r~l-\, CoreFigure 1. Fabrication of a fused biconic taper coupler.
2. Literature review
Fused
/ Epoxy
/
FiberStrain 1 Quartz 1 \ steel
Relief Substrate Tube
Boot
Figure 2. Metal tube package for a fused biconic taper coupler.
satisfaction with respect to all of the responses. Neural networks are used to explore the nonlinear multivariate relationship between the input control factors and output responses. The exponential desirability functions are used to unify the multiple responses. The genetic algorithms are applied to find the optimal combination of control factors with continuous values. The proposed approach is illustrated by discussing the recent advances in f ~ ~ s e d parameter settings made in developing FBT couplers to improve the performance and reliability of the 1 % (1 199) single-window broadband tap coupler.
Optimizing a multi-response problem using the stan- dard Taguchi method is difficult. Most conventional methods are incomplete in that one response variable is selected as the primary variable and optimized by adhering to the other constraints set by the criteria (Das 1999). Engineering judgment is a traditional means of resolving such complicated multi-response problems (Phadke 1989). The introduction of human judgment increases the uncertainty in the decision- making process. Logothetis and Haigh (1988) applied the multiple regression technique and linear program- ming approach to the optimization of a five-response process using the Taguchi method. Their method was limited when the t values of the regression coefficients were insignificant or when the coefficient of determina- tion was low. Pignatiello (1993) presented a quadratic loss function for multi-response problems and estab- lished a predictive regression model using controllable variables. The expected loss was minimized by following the descent direction and repeatedly establishing a new local experimentation region. However, it is difficult to determine the cost matrix using Pignatiello's method and additional experimental observations may be
A novel approach for optimizing the optical performance of the broadband tap coupler 217 required. Reddy et al. (1997) proposed an approach that
applies goal programming and Taguchi's robust design methodology to optimize multiple responses simulta- neously. The proposed approach was illustrated by optimizing an injection-moulding process and yielded a satisfactory result. However, the optimal control factors settings were restricted to discrete values, i.e. the consid- ered experimental control factor levels. This method cannot guarantee that the global optimum will be reached. In practice, the optimal parameter settings might exist within a feasible range of control factors with continuous values. Tong et al. (1997) proposed a procedure to determine the multi-response signal-to- noise (MRSN) ratio by integrating the quality loss of each response. However, determining the weight ratios for responses is difficult and the optimal factor/level combination is likely to be dominated by the 'maximum quality loss' in the trial total. Cornell and Khuri (1987) explored multi-response problems using a response surface method. Superimposing the response contour plots and finding an optimal solution using visual inspection is a simple and intuitive approach to multi- response problems (Lind et al. 1960). However, this method is severely limited by the number of input variables and/or responses (Kim and Lin 2000). Using a dimensionality reduction strategy has thus become a popular means of simultaneously optimizing (compro- mising) multi-response problems. This method converts a multi-response problem into a single-response prob- lem with an aggregated measure. This has often been defined as a desirability function (Harrington 1965, Derringer and Suich 1980) or as an estimated distance from the ideal design point (Khuri and Conlon 1981). The desirability function approach attempts to trans- form a multi-response problem into a single-response problem through mathematical transformation (Laviolette et al. 1995). Kim and Lin (2000) developed a modelling approach based on maximizing exponential desirability functions for optimizing a multi-response system. This method does not require any assumption about the form or degree of estimated response models and is sufficiently robust to handle the potential inter- dependence between responses.
3. Optimization methodologies
The optimization methodologies including neural networks, desirability functions and genetic algorithms necessary for developing the proposed approach are briefly introduced below.
3.1. Neural networks
A neural network comprises a number of processing elements linked by weighted and directed connections.
Common configurations of neural networks are fully interconnected. Each processing element receives input signals via weighted incoming connections and then fans out an output signal along connections to every other processing element. The output signal of an element depends on the specified threshold and transfer function. Numerous neural network models exist that simulate various aspects of intelligence. Learning can be categorized into supervised and unsupervised. For supervised learning, a set of training input data with a corresponding set of output data are trained to adjust the weights in a network, while for unsupervised learn- ing, a set of input vectors is proposed, but no target vectors are specified. To solve parameter design pro- blems with multiple responses, neural networks are applied to construct the functional relationship between control factors and output responses in an experiment. Consequently, supervised neural networks are applic- able for this purpose. Several well-known supervised learning neural network models, including back- propagation (BP), learning vector quantization and the counter propagation network, are available. Among these models, the BP neural model is most widely applied and can provide effective solutions to numerous industrial applications (Lippmann 1987, Funahashi 1989, Dayhoff 1990). Consequently, the BP neural model is employed herein. A standard BP neural model consists of three or more layers, including an input layer, one or more hidden layers and an output layer. The theoretical results have revealed that a single hidden layer is sufficient to allow a BP neural model to approximate any continuous mapping from the input patterns to the output patterns to an arbitrary degree of freedom (Fausett 1994). A basic three-layered BP neural model is generally called a p-q-r neural model, where the parameters p, q and r are the total number of neurons in the input, hidden and output layers, respectively. The values of p and r are precisely determined according to the dimensions of the input and output vectors in a problem, respec- tively. However, the appropriate number of neurons in the hidden layer (q) is generally set through trial and error. A BP network training involves three stages: the feedforward of the input training pattern, the calculation and backpropagation of the associated error, and weight adjustment. Once network perfor- mance is satisfactory, the relationships between input and output patterns are determined and the weights are then used to recognize new input patterns. The two parameters with the greatest effect on the training performance of a BP neural network are learning rate and momentum. For the detailed algorithm of the BP neural network and the guidelines for selecting appropriate training parameters, see Fausett (1994) and Hagan et al. (1 995).
3.2. Desirability functions
Suppose there are r responses y =
Oil,
y2, . . . , yr), determined by a set of input variables x = (xl, x2, . . . , x,). A general multi-response problem can be defined as~j = j j ( x l , x 2 , . . . , x p ) +&j, for j = 1, 2,. . . , r , (1)
where f , is the response function between the jth response and the input variables, and E j is the error
term. Usually, the exact form o f f , cannot be known but can be estimated over a limited experimental region by using model building techniques, such as regression and neural networks. Resolving such compli- cated problems by superimposing the response contour plots and finding an optimal solution by visual inspection is simple and intuitive (Lind et al. 1960). However, this approach is rendered impractical owing to the number of input variables and/or responses (Kim and Lin 2000). Integrating all the different responses simplifies the solution of multi-response problems to a single objective optimization problem. The desirability function approach transforms an estimated response (e.g. the jth estimated response jj) to a scale-free value
4
(0 54
5 l), called desirability. At large values,4
increases as the desirability of the corresponding response increases. Harrington (1 965) used a geometric mean to transfer 4 s into an overall desirability D (0 5 D 5 1) and found the input variable setting x* that could maximize D. Derringer and Suich (1980) extended Harrington's approach by suggesting a more systematic transformation scheme of desirability. Derringer (1994) suggested a new form of D using the weighted geometric mean. However, the value of D does not support a clear interpretation, except that it should be maximized. Kim and Lin (2000) proposed an alternative formulation to the conventional desirabil- ity function approach for the multi-response problems based on maximizing the desirability function. To achieve an overall optimization for all the responses, a 'minimum' operator was employed to aggregate the responses. A multi-response problem can be stated as:max h
X
subject to
where h is the overall satisfaction with all responses of a product/process and S2 is the experimental region. Notably, this is a 'maximin' optimization problem in nature. The exponential desirability function is
suggested as follows (Kim and Lin 2000):
where t is a constant ( - a < t < oo), called an exponen- tial constant. Notably, the function is convex, linear and concave when t < 0, = 0 and > 0, respectively. Using a convex desirability function (i.e. t < 0) implies that the deviation in the estimated response from its target value is more critical than when using a linear or concave desirability function (i.e. t 2 0), to maintain the same degree of satisfaction. 'z' denotes a standard- ized parameter representing the distance between the estimated response and its target in units of the maximum allowable deviation. For example, for the nominal-the-best (NTB), smaller-the-better (STB) and larger-the-better (LTB) type responses, the parameter z can be defined, respectively, as:
where T, is the target value for the jth response. The bounds on a response
0);"'"
and yTaX) should be specified in advance according to the specification limits of the product or process, the regulations or standards of the organization, the physical range of the response or the subjective judgment of the decision makers. The function d(z) given in equation (5) has been proven to provide a reasonable and flexible representa- tion of human perception (Kirkwood and Sarin 1980, Moskowitz and Kim 1993) and is convenient to handle analytically (Kim and Lin 2000).The desirability function approach is one of the most frequently used multi-response optimization techniques (Derringer 1994) and has several methodological advan- tages over other existing methods (Kim and Lin 2000): 'Maximin' approach is robust to the potential depen- dence between responses.
This approach balances all the responses better than conventional methods.
Objective function value h allows a good physical interpretation.
Implementing this approach requires little mathema- tical or statistical knowledge.
A novel approach for optimizing the optical performance of the broadband tap coupler 2 19
3.3. Genetic algorithms (GAS)
Charles Darwin first introduced the concept of natural and biological evolution in his On the Origin
of Species (1876) which, subsequently, inspired a class
of algorithms known as genetic algorithms (GAS). GAS are robust adaptive optimization techniques that allow an efficient probabilistic search in a high dimen- sional space (Goldberg 1989). To apply genetic evolu- tionary concepts to a specific problem, two issues must be addressed: the encoding of a potential solution and the fitness function (objective function) to be optimized. A solution's genetic representation is a vector composed of several components (genes), called a chromosome. The initial population of chromosomes is generated according to some principles or else randomly selected. The evaluation is performed to measure the quality (fitness) of potential solutions. Optimization is achieved by (I) selecting pairs of chromosomes with probabilities proportionate to their fitness and (2) matching them to create new offspring. Besides matching (crossover), small mutation occurs in new offspring. The replace- ment of bad solutions with new ones is based on some fixed strategies. The chromosomes evolve through successive iterations, called generations. The evaluation, optimization and replacement of solutions are repeated until the stopping criteria are satisfied. Let P(s) and C(s) be parents and offspring in current generation s; the general structure of GAS is described as follows (Gen and Cheng 1997):
Procedure Genetic Algorithins begin
s t 0;
initialize P(s); evaluate P(s);
while (not termination condition) do recombine P(s) to yield C(s); evaluate C(s);
select P(s+l) from P(s) and C(s); s t s+l;
end end.
There are three major advantages when applying GAS to optimization problems (Gen and Cheng 1997). First, they do not have many mathematical require- ments for the optimization problems and can handle any kind of objective functions and any kind of con- straints defined in discrete, continuous or mixed search spaces. Second, the ergodicity of evolution operators makes GAS very effective at performing global search (in probability) and finding global optima. Third, GAS provide great flexibility of hybridizing with domain- dependent heuristics to enable an efficient implementa- tion for a specific problem. Goldberg (1989) compared
GAS with conventional search techniques including calculus-based, enumeration and random methods. He found that GAS can be highly efficient in solving combi- natorial, unimodal and multimodal problems. These results indicate that GAS are robust, even in a complex solution space, and concurrently show efficiency and efficacy. They have been successfully applied to difficult problems. For instance, adequate results have been obtained through GAS from various NP-complete problems (Ochi 1998, Easwaran et al. 1999, Lu et al. 1999). For detailed discussions of the foundation of GAS, see Goldberg (1989), Gen and Cheng (1997) and Man et al. (1999).
4. Proposed approach
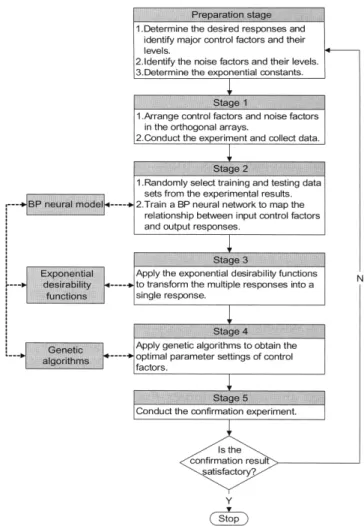
Before starting process design, the quality characteris- tics (responses), major control factors, noise factors and the exponential constant for each response must be identified by consulting manufacturing engineers. The proposed approach comprises five stages. At the first stage, the experimental design is applied to assign con- trol factors and noise factors to the orthogonal arrays. An experiment is conducted according to the experimen- tal layout and the experimental results are collected. In the second stage, training and testing data sets are randomly selected from the experimental results. A BP neural network model is trained to map the relationship between the input control factors and output responses. The main control factor effects and their interactions upon the output responses can be modelled through the well-trained BP neural model. Next, at stage 3, the exponential desirability functions are employed to transform the multiple responses into a single response. The greater the degree of satisfaction
(A),
the better the product is based on the quality characteristics being considered. At stage 4, GAS are applied (through the well-trained BP neural model and exponential desirabil- ity functions) to obtain the optimal degree of satisfac- tion(A),
i.e. the optimal parameter combination of control factors in the fused biconic taper process. At the final stage, a confirmation experiment is conducted to verify the feasibility and effectiveness of the acquired parameter settings of control factors. If the result is unsatisfactory, the proposed approach should be applied once again, starting from the preparation stage. Notably, the searched parameter setting is not limited to discrete values and the proposed approach can obtain the optimum more efficiently than previous methods at stage 4. Hereto, the optimization of param- eter design problems in the manufacturing of the 1% (1199) single-window broadband tap coupler can be resolved successfully. Figure 3 shows the proposed approach.I .Determine the desired responses and identify major control factors and their levels.
.
Stage 1
1 .Arrange control factors and noise factors in the orthogonal arrays.
2.Conduct the exper~ment and collect data.
1
I
Stage 27
1 .Randomly select training and testing data sets from the experimental results. 2.Train a BP neural network to map the
relationship between input control factors and output responses.
Stage 3
Apply the exponential desirability functions to transform the multiple responses into a single response.
I
Stage 4
I
I Apply genetic algorithms to obtain the
.--
optimal parameter settings of control factors.p- .-
Stage 5
I conduct the confirmation experiment. I
Figure 3. Proposed approach.
5. Case study 5.1. The problem
A manufacturer of fibreoptic passive components, located in the Science-Based Industrial Park of Taiwan, is engaged in the development, manufacturing and sale of passive components for the optical fibre telecommunications industry. In the past, this manufac- turer experienced serious loss owing to the low yield in the fused biconic taper (FBT) process used to fabricate single-window broadband tap couplers. At present, the FBT process cannot be fully automated in mass production. In the FBT manufacturing process, numerous production factors, e.g. machine instability, environmental influences, product diversity and human limitations, affect the performance and reliability of these couplers. Moreover, a complex causal relation- ship exists between these production factors and the quality characteristics of the couplers. Traditionally, experienced engineers sought the optimal feasible combination of parameter levels (even though they could not be verified as the optimal levels) in the FBT
Table 1. Specifications of 1% (1199) single-window broadband
tap couplers, the exponential constants and yjm'" and yTaX
CR EL IL-A IL-B PDL-A PDL-B
("/d
(dB) (dB) (dB) (dB) (dB) Grade Premium 9 9 f 0 . 2 50.20 521.50 50.20 50.30 50.30 A 9 9 f 0 . 2 50.40 522.00 50.30 50.35 50.35 B 9 9 f 0 . 2 50.60 523.00 50.60 (0.40 (0.40 Exponential constant 2.5 2 -1 1.5 1 3 min 98.8 0.00 18.00 0.00 0.00 0.00 y/,ax yj 99.2 0.60 23.00 0.60 0.40 0.40process through trial and error. Hence, this manu- facturer has experienced a great loss due to the low yield rate in the FBT process. Consequently, finding the optimal combination of process parameters that could produce couplers with satisfactory quality charac- teristics is greatly desired. However, several critical coupler optical characteristics must be optimized simul- taneously. Optimizing such a multi-response parameter design problem using the traditional Taguchi method is difficult. We applied here the proposed procedure to optimize the parameters in the fused process and thereby to improve the performance and reliability of the 1% (1199) single-window broadband tap coupler.
The personnel managing quality and reliability engineering helped identify six crucial quality character- istics (responses). These characteristics were selected to enhance quality performance. They include (see Goff
1999 for definitions):
1. CR (%): coupling ratio (nominal-the-best). 2. EL (dB): excess loss (smaller-the-better).
3. IL-A (dB): insertion loss at 1 % tap port (smaller-the- better).
4. IL-B (dB): insertion loss at 99% through port (smal- ler-the-better).
5. PDL-A (dB): polarization dependent loss (at 1 % tap port) (smaller-the-better).
6. PDL-B (dB): polarization dependent loss (at 99% through port) (smaller-the-better).
Table 1 lists the specifications of different grades of 1 % (1199) single-window broadband tap couplers. 5.2. Experimental design and data collection
Both strength and insertion loss of the fused coupler are improved by controlling the fusion time and initial thickness of partially etched optical fibre cladding. Coupled power is precisely controlled by the fusion time, pre-fusion conditions before melting, effective coupling length and effective pressure between the fibres.
A novel approach for optimizing the optical performance of the broadband tap coupler 22 1 Meanwhile, multiple variables influence the perfor-
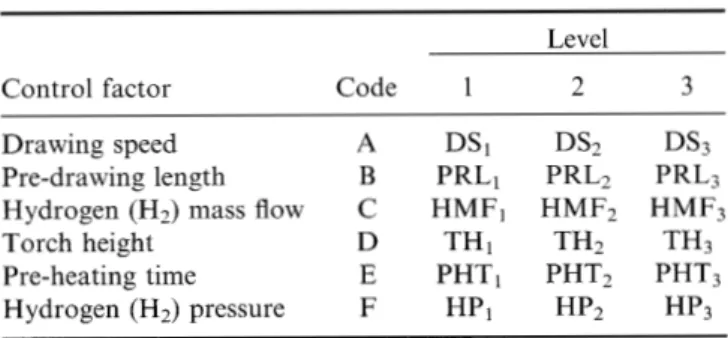
mance of the tap coupler. Discussion with the product engineer revealed that the optical performance of the tap coupler in the fused process may depend on several process-related control factors. These critical process control factors and their levels are listed in table 2.
Six control factors at three levels require 36 = 729 trials for a full factorial experiment, which is a time- consuming process. The main effects of the control factors can be estimated by conducting 18 experimental
trials arranged according to a Taguchi ~ ~x 37) ~ ( 2 ~ orthogonal array (Phadke et al. 1983).
Table 2. Critical process control factors and their experimental
levels
Level
Control factor Code 1 2 3
Drawing speed A DS1 DS2 DS3
Pre-drawing length B PRLl
Hydrogen (H2) mass flow C H M F l
Torch height D TH1
Pre-heating time E PHTl
Hydrogen (H2) pressure F HPI
Two noise factors, the shift and an operator's skill, were considered to be significant in the FBT process. While each noise factor has two levels, four replications in each trial run should be implemented to cover the noise space adequately. Owing to time and cost limitations, two combinations of the above noise factors were selected to illustrate the extreme cases of the effect the noise factors have on the manufacturing process performance of tap couplers. The two combinations of noise factors are defined as follows:
N1 : day shift
+
veteran N2: night shift+
freshman.Physical layout experiments were randomized to mini- mize systematic bias, and each experimental trial was carried out under conditions N1 and N2. Table 3 lists the collected data.
A coupler contains numerous optical specifications. None of the specifications will be rejected provided the critical point is within the specification limits for the entire bandwidth of the wavelength. The critical points are also located at the band limits (1550 f 40 nm) for IL and PDL. Figure 4 reveals that optical performance can be optimized by analysing only the worst case. Notably, the four responses CR, EL, IL-A and IL-B were collected at three wavelength levels: 1510, 1550
Level 2 is the existing level. and 1590nm. Table 3 lists the data for the worst
Designated letter is so that the proprietary of the company which made case under the three wavelength conditions for further
contribution to this work is not revealed. analysis.
Table 3. Collected experimental data
Response
Control factor C R EL IL-A IL-B PDL-A PDL-B
Trial A B C D E F N1 N2 N1 N2 N1 N2 N1 N2 N1 N2 Nl N2 1 1 1 1 I 1 1 98.644 98.775 0.053 0.047 19.715 20.239 0.104 0.090 0.180 0.170 0.010 0.010 2 2 2 2 2 2 2 98.733 98.791 0.011 0.021 20.464 20.271 0.050 0.061 0.240 0.230 0.030 0.020 3 3 3 3 3 3 3 98.798 98.728 0.060 0.084 20.287 20.201 0.103 0.139 0.310 0.280 0.020 0.020 4 1 1 2 2 3 3 98.689 98.830 0.049 0.034 20.005 20.379 0.097 0.085 0.180 0.190 0.020 0.010 5 2 2 3 3 1 1 98.748 98.783 0.025 0.097 20.367 20.458 0.079 0.151 0.200 0.270 0.020 0.010 6 3 3 1 1 2 2 98.747 98.817 0.059 0.017 20.211 20.584 0.101 0.054 0.490 0.410 0.030 0.020 7 1 2 1 3 2 3 98.797 98.831 0.025 0.160 20.326 20.440 0.066 0.211 0.200 0.220 0.030 0.020 8 2 3 2 1 3 1 98.617 98.709 0.134 0.024 19.960 20.208 0.194 0.067 0.340 0.280 0.020 0.010 9 3 1 3 2 1 2 98.738 98.783 0.045 0.056 20.135 19.964 0.100 0.109 0.270 0.250 0.020 0.010 10 1 3 3 2 2 1 98.612 98.720 0.039 0.109 19.951 20.515 0.100 0.158 0.170 0.170 0.100 0.020 11 2 1 1 3 3 2 98.954 98.768 0.075 0.100 20.302 20.205 0.145 0.146 0.210 0.240 0.010 0.010 12 3 2 2 1 1 3 98.779 98.759 0.038 0.022 20.227 20.173 0.091 0.071 0.360 0.390 0.030 0.020 13 1 2 3 1 3 2 98.720 98.632 0.068 0.075 20.350 19.735 0.117 0.056 0.210 0.220 0.020 0.010 14 2 3 1 2 1 3 98.791 98.811 0.070 0.086 20.048 20.389 0.130 0.138 0.320 0.290 0.020 0.030 15 3 1 2 3 2 1 98.662 98.793 0.190 0.083 19.772 20.094 0.248 0.136 0.290 0.280 0.030 0.030 16 1 3 2 3 1 2 99.105 98.731 0.051 0.058 20.410 20.060 0.095 0.113 0.170 0.180 0.020 0.030 17 2 1 3 1 2 3 98.682 98.758 0.060 0.059 19.687 20.245 0.114 0.101 0.210 0.240 0.010 0.020 18 3 2 1 2 3 1 98.775 98.613 0.061 0.390 20.314 20.128 0.106 0.443 0.300 0.280 0.030 0.020
-
Polarization Dependent Loss - Insertion Lossp z q 7 4
p i i q
...,... >...?...T
I
PDL MaxI
Wavelength (nm)Figure 4. Worst-case analysis of wavelength bandwidth.
Table 4. Candidate BP neural models
Structure Training RMSE Testing RMSE
RMSE, root mean squared error (NeuralWare 2000).
5.3. Model building of neural networks
Based on a random selection of training and test data sets from the experimental results, a BP neural network model was constructed to model the functional relation- ship between the input control factors and output responses. A smaller learning rate and a larger momen- tum are recommended for finding the global minimum weights (Fausett 1994). The learning rate and momen- tum were set at 0.25 and 0.8, respectively, through trial and error. The candidate neural models were obtained using the Neuralworks Professional II/Plus (NeuralWare 2000) software for 6000 epochs (table 4). To achieve a balance between the training data set and generalized capabilities to the test data set, a neural model that provides relatively fewer training and testing RMSEs is wanted. Hence, the 6-7-6 neural model was selected to predict the output responses under all possible control factor parameter combinations. Figure 5 displays the development of training and test- ing root mean squared errors (RMSEs), along with learning iterations. Through the well-trained BP neural model, the output responses under all possible para- meter combinations of control factors can be accurately predicted.
5.4. Optimization through GAS
Among the six quality characteristics of interest, response CR b l ) has the corresponding target value
0.25 0.20 0.15 RMSE 0.10 0.05 0.00 0 500 1000 1500 2000 2500 3000 3500 4000 4500 5000 5500 6000 Iteration
Figure 5. Development of training and testing RMSEs along
with learning iterations for the selected 6-7-6 neural model.
and its specification limits, while responses EL b 2 ) , IL-A b3), IL-B b4), PDL-A b 5 ) and PDL-B b 6 ) have upper specification limits. The exponential desirability functions were applied to solve the multi-response problem. Hence, we want- to maximize
where d:s are calculated according to equations (5-8). Among the six quality responses, the insertion loss at the 1% tap port (IL-A) is considered the most difficult to attain in the premium-graded coupler specification. The personnel managing quality and reliability engineer- ing agreed on employing concave exponential functions for CR, EL, IL-B, PDL-A and PDL-B, and a convex exponential function for IL-A with the exponential con- stants, as shown in table 1. Hence, multiple responses can be transformed into a single response. The function
h was set as the fitness function in the GA as further explored in the optimization stage (Stage 4).
The six control factors in the broadband tap coupler manufacturing process were normalized to values between 0 and 1 and expressed using a real-valued string, i.e. chromosome. An initial population consisting of 20 chromosomes was randomly generated. The offspring were produced through predetermined essen- tial GA operators, including crossover and mutation. The crossover mechanism for real-valued strings is defined as
offspring - - parent
1 I
+
(1 - a)xgarentoffspring - parent
X2 - 1 - a )
+
axparent 2 7where xYaRnt and xParent are matched chromosomes
(parents) in the current generation, x ; and ~Xoffspring 2 ~ ~ ~ ~ ~ ~ ~ are offspring, i.e. the candidate solutions in the next
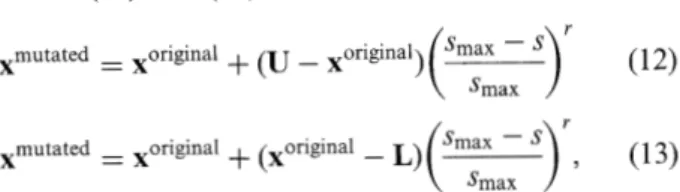
generation, and a is a random real number (0 5 a 5 1). And the mutation mechanism is randomly selected from
A novel approach for optimizing the optical performance of the broadband tap coupler 223 equations (12) and (1 3):
where x~~~~~~~~ is the original chromosome, xmutated is the mutated chromosome, U and L are the upper and lower bounds of the allowable ranges for the input control factors, s,,, is the maximum number of generations for which the GAS implement, s is the current genera- tion in the GA, and r is a predefined disturbing coefficient (r 1 O), e.g. r = 2.
The roulette approach was adopted as the selection function. After several pre-implementations, the GA procedure was repeated until the stop criterion, a change in the last 3000 trials of less than 1%, was satis- fied. The crossover and mutation rates were set at 0.6 and 0.08, respectively. The optimal control factor setting might go beyond the experimental range. Hence, the upper and lower bounds for each control factor's allow- able range were set smaller than level 1 by 25% and larger than level 3 by 25%, respectively. The process engineers confirmed this as feasible.
The GA procedure was implemented for 20 runs using the above information. Table 5 summarizes the imple- mentation results. The five combinations of control factor parameter settings that produced larger values for the objective functions
(A),
the corresponding desir- ability functions (d(z)) and their parameter combina- tions are shown in table 6. Following consultation with engineers, the optimal feasible control factor levels were set as A = 1.1991 x DS1, B = 1.5516 x PRLl, C =Table 5. Implementation results of GAS
Item Data Largest h in 20 runs 0.5436 Smallest h in 20 runs 0.4674 Average h 0.5166 Standard deviation of h 0.0205 0.9983 x HMF1, D = 1.0184 x THI, E = 0.9405 x PHTl and F = 0.9791 x HP1.
5.5. Con$rmation experiment and implementation A confirmation experiment was carried out by proces- sing 30 pieces of 1% (1199) single-window broadband tap couplers at the optimal parameter control factor levels. Table 7 lists the confirmatory results. All 30 trials conformed to the 1 % (1199) single-window broad- band tap coupler specification and were thus graded as 'Premium'. We are confident that the obtained optimal process control factor parameter combination can be applied directly to fused optical coupler mass production.
The optimal process control factor levels were imple- mented into a fused process pilot run phased in over 15 days. Evaluations of 300 couplers revealed that the aver- age defect rate was reduced to 1 % from a previous 15%. The additional insertion loss (IL) flatness performance capability was also improved. If the IL flatness is included in the specification, the original yield of 60% will be improved to 80%. The quoted price for devices with such a tight specification is at least 75% higher than that for common specification product. This study is applicable to the common specification and also the extra benefit in increased sales price for the high specification product. The demand for the product used in this experiment is expected to be 20 000 pieces a month. This study optimized the fused process param- eters and increased throughout by 20% by increasing the yield rate. Given these achievements, monthly savings are expected to reach US$22400, well above the cost of the experiment, at only around US$lO 000. 5.6. Comparison
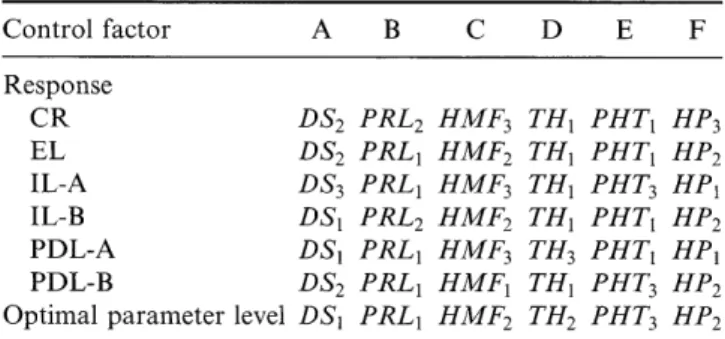
Conventionally, process engineers apply the Taguchi method to resolve a parameter design problem. For comparison, the experimental results were also analysed using the standard Taguchi method. Table 8 summarizes the control factor level combinations that maximize product quality based on each quality characteristic considered. A conflict occurred when optimizing the Table 6. Five combinations of control factor parameter settings that produce larger values for the obiective function
Control factor d ( z )
NO. A B C D E F C R EL IL-A IL-B PDL-A PDL-B h
1 1.1991 x D S 1 1.5516xPRL1 0.9983xHMF1 1.0184xTH1 0.9405xPHT1 0.9791 xHP1 0.6042 0.9241 0.5436 0.8578 0.551 5 0.9908 0.5436 2 1. 1809xDS1 1.5320xPRL1 0.9989xHMF1 1.0186xTH1 0.9430xPHT1 0.9728 x H P 1 0.5940 0.9232 0.5382 0.8559 0.5807 0.9903 0.5382
3 1.1963xDS1 1.5247xPRL1 0.9986xHMF1 1.0185xTH1 0.9744xPHT1 0.9819xHP1 0.5879 0.9218 0.5378 0.8541 0.5557 0.9904 0.5378
4 1.1944xDS1 1.5479xPRL1 0.9988xHMF1 1.0181 x T H 1 0.9469xPHT1 1.0016xHP1 0.6153 0.9300 0.5336 0.8652 0.5451 0.9913 0.5336 5 1.1544xDS1 1.5563xPRL1 0.9985xHMF1 1.0184xTH1 0.9739xPHT1 0.9821 x H P 1 0.5810 0.9258 0.533 1 0.8585 0.6171 0.9905 0.5331
Table 7. Confirmatory results Response
Tube no. CR (%) EL (dB) IL-A (dB) IL-B (dB) PDL-A (dB) PDL-B (dB) Grade
1 2 3 4 5 6 7 8 9 10 11 12 13 14 15 16 17 18 19 20 2 1 22 23 24 2 5 26 27 2 8 29 3 0 Mean SD Premium Premium Premium Premium Premium Premium Premium Premium Premium Premium Premium Premium Premium Premium Premium Premium Premium Premium Premium Premium Premium Premium Premium Premium Premium Premium Premium Premium Premium Premium
Table 8. Combinations of control factor levels that optimize each quality characteristic individually
Control factor A B C D E F Response CR DS2 PRL2 HMF3 T H l PHTl HP3 EL DS2 PRLl HMF2 T H l PHTl HP2 IL-A DS3 PRLl HMF3 T H 1 PHT3 H P I IL-B DS1 PRL2 HMF2 T H I PHTl HP2 PDL-A DS1 PRLl HMF3 TH3 PHTl HPl PDL-B DS2 PRLl HMFl T H l PHT3 HP2 Optimal parameter level DS1 PRLl HMF2 TH2 PHT3 HP2
control factor level combination while simultaneously considering all six desired quality characteristics. Following consultation with the engineers, the optimal control factor parameter levels were set as A = D S 1 , B = PRLI, C = HMF2, D = TH2, E = PHT3 and
F = HP2. The acquired parameter settings were also implemented into a fused process pilot run over 19 days. Evaluations of 192 couplers revealed that the average defect rate fell to 4.17%, well below the previous rate. However, this was still higher than the defect rate yielded by the proposed procedure.
At Stage 4 in our proposed approach, the well-trained BP neural model and the exponential desirability func- tions were fed into GAS to obtain the optimal control factor parameter combination for the fused biconic taper process. The optimal control factor values are no longer restricted to the solution points composed of the discrete experimental levels, i.e. 36 = 729 points in the solution space because the optimal control factor combination might exist at any feasible solution point with continuous control factor values. To verify the effect of the optimization process, the proposed approach was repeated, skipping Stage 4. Table 9
A novel approach for optimizing the optical performance of the broadband tap coupler 225
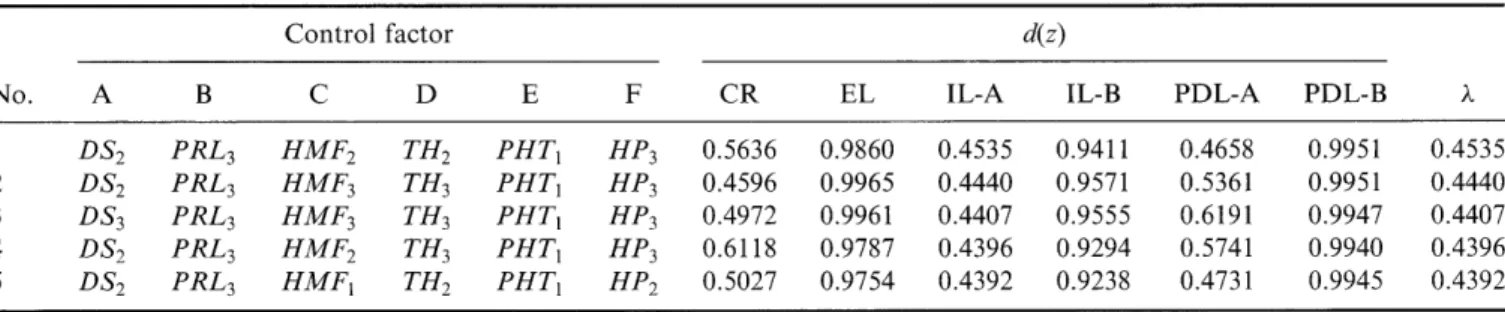
Table 9. Five combinations of control factors parameter settings that produce larger values for the objective function (without stage 4)
Control factor
44
NO. A B C D E F CR EL IL-A IL-B PDL-A PDL-B h
Table 10. Comparison results for different optimization approaches
Approach
Optimal setting of control factor
Defect
A B C D E F rate (%)
Taguchi method DS1 PRLl HMF2 TH2 PHT3 Hp2 4.17
Proposed approach (without Stage 4 ) DS2 PRL3 HMF, TH2 PHTl Hp3 2.50
Proposed approach (with Stage 4 ) 1.1991 x D S 1 1 . 5 5 1 6 ~ P R L , 0 . 9 9 8 3 ~ HMFl 1 .Ol84x T H , 0 . 9 4 0 5 ~ PHTl 0.9791 x H P l 1.00
summarizes the five control factor parameter setting combinations that produced larger values for the objective functions
(A),
the corresponding desirability functions (d(z)) and their parameter combinations. Following consultation with the engineers, the optimal control factor levels were determined as A = DS2, B = PRL3, C = H M F 2 , D = TH2, E = PHTl and F = HP3. A confirmation experiment was then conducted and yielded 30 pieces of 1 % (1199) single- window broadband tap couplers at the optimal control factor parameter levels. The confirmatory results indi- cated that all of the 30 trials conform to the 1% (1199) single-window broadband tap coupler specification. Moreover, 28 of 3 0 couplers were graded as 'Premium7. The others were graded as 'A7. The optimal process control factor levels were implemented in a fused process pilot run phase in over 20 days. Evaluation of 200 couplers revealed that the average defect rate was reduced to 2.5%. This was still higher than the 1.0% defect rate obtained using the proposed procedure with Stage 4. Table 10 summarizes these comparison results.6. Significance of the work
The Taguchi method has proven to be an effective approach to producing high-quality products at relatively low cost. Parameter design, based on the Taguchi method, can determine the best process param- eter settings, thereby making the functional process performance insensitive to various sources of variation. Much of the published literature on Taguchi parameter design method is concerned with the optimization of a
single response or quality characteristic that is often the most critical to consumers. When optimizing multiple quality characteristics, the objective is to determine the best factor settings that will simulta- neously optimize all of the quality characteristics of interest. The usual recommendation for optimizing a process/product with multiple quality characteristics is left to engineering judgment and verified using experiments. However, the introduction of human judgment increases the uncertainty in the decision- making process. This study proposes an integrated approach based on neural networks, exponential desirability functions and GAS for optimizing a multi- response parameter design problem. The neural network is used to explore the nonlinear multivariate relationship between the input control factors and output responses. The exponential desirability func- tions are used to unify the multiple responses. By defining a desirability function as a fitness function, GAS can be performed to obtain the optimal control factor level combination. The proposed approach aims to identify the input control factor settings and thus max- imize the overall minimal level of satisfaction with respect to all of the responses. The optimal control factor values are no longer restricted to the solution points composed of discrete experimental levels. The optimal solution could exist at any feasible solution point with continuous control factor values.
7. Conclusions
This study proposed an integrated approach based on neural networks, exponential desirability functions and
GAS to optimize a parameter design problem with multiple responses. The neural networks were used to explore the nonlinear multivariate relationship between the input control factors and output responses. The exponential desirability functions were used to unify the multiple responses. The GAS were applied to find the optimal control factor combination with continuous values. The effectiveness of the proposed procedure was demonstrated using a case study undertaken to optimize fused process parameters. This process was used in the development of FBT couplers to enhance the perfor- mance and reliability of the 1% (1199) single-window broadband tap coupler. A fused process pilot run over 15 days was implemented. Evaluation of 300 couplers revealed that the average defect rate was reduced to just 1.0 O/O from over 1 5 % previously. The implemen- tation results confirmed that the proposed procedure outperforms the conventional Taguchi method in resolving multi-response problems. Monthly savings from implementing the proposed procedure are expected to exceed US$22400. The expenditure for this experi- ment was below US$10 000. This study was also success- fully applied to develop the optimal fused parameters for other coupling ratio taper couplers, such as 2/98, 3/97, 4/96,. . . , 50150.
Acknowledgements
The authors thank the National Science Council, Taiwan, ROC, for partially supporting this research under Contract No. NSC91-2213-E- 159-01 3.
References
CORNELL, J. A., and KHURI, A. I., 1987, Response Surface: Designs and Analysis (New York: Marcel Dekker).
DARWIN, C., 1876/1988, The Origin of Species (New York: New York University Press).
DAS, P., 1999, Concurrent optimization of multiresponse product performance. Quality Engineering, 11, 365-368.
DAYHOFF, J. E., 1990, Neural Network Architectures (New York: Van Nostrand Reinhold).
DERRINGER, G., and SUICH, R., 1980, Simultaneous optimization of several response variables. Journal of Quality Technology, 12, 214-219.
DERRINGER, G., 1994, A balancing act: optimizing a product's proper- ties. Quality Progress, 27, 5 1-58.
EASWARAN, A. M., PITT, J., and POSLAD, S., 1999, Agent service brokering problem as a generalized travelling salesman problem. In Proceedings of the 1999 3rd International Conference on Autonomous Agents, pp. 414-41 5.
FAUSETT, L., 1994, Fundamentals of Neural Networks: Architecture, Algorithms, and Applications (Englewood Cliffs: Prentice-Hall).
FUNAHASHI, K., 1989, On the approximate realization of continuous mappings by neural networks. Neural Networks, 2, 183-192. GEN, M., and CHENG, R., 1997, Genetic Algorithms and Engineering
Design (New York: Wiley).
GOFF, D. R., 1999, Fiber Optic Reference Guide: A Practical Guide to the Technology (Boston: Focal).
GOLDBERG, D. E., 1989, Genetic Algorithm in Search, Optimization and Machine Learning (New York: Addison-Wesley).
HAGAN, M. T., DEMUTH, H. B., and BEALE, M., 1995, Neural Network Design (Boston: PWS).
HARRINGTON, E., 1965, The desirability function. Industrial Quality Control, 21, 494-498.
KASHIMA, N., 1995, Passive Optical Components for Optical Fiber Transmission (Norwood: Artech House).
KHURI, A., and CONLON, M., 1981, Simultaneous optimization of multiple responses by polynomial regression functions. Technometrics, 23, 363-375.
KIM, K.-J., and LIN, D. K. J., 2000, Simultaneous optimization of mechanical properties of steel by maximizing exponential desirabil- ity functions. Applied Statistics, 49, 3 11-325.
KIRKWOOD, C. W., and SARIN, R. K., 1980, Preference conditions for multiattribute value functions. Operations Research, 28, 225-232. LAVIOLETTE, M., SEAMAN, J. W. Jr, BARRETT, J. D., and WOODALL,
W. H., 1995, A probabilistic and statistical view of fuzzy methods. Technometrics, 37, 249-261.
LIND, E., GOLDIN, J., and HICKMAN, J., 1960, Fitting yield and cost response surfaces. Chemical Engineering Progress, 56, 62-68. LIPPMANN, R. P., 1987, An introduction to computing with neural
nets. IEEE ASSP Magazine, 4, 4-22.
LOGOTHETIS, N., and HAIGH, A., 1988, Characterizing and optimizing multi-response processes by the Taguchi method. Quality and Reliability Engineering International, 4, 159-169.
Lu, C. G., MORTON, D., WU, M. H., and MYLER, P., 1999, Genetic algorithm modelling and solution of inspection path planning on a coordinate measuring machine (CMM). International Journal of Advanced Manufacturing Technology, 15, 409-416.
MAN, K. F., TANG, K. S., and KWONG, S., 1999, Genetic Algorithms (London: Springer)
MOSKOWITZ, H., and KIM, K., 1993, On assessing the H value in fuzzy linear regression. Fuzzy Sets and Systems, 58, 303-327.
NEURALWARE, 2000, Neural Works Professional II/Plus v5.4 (Carnegie: Neuralware).
OCHI, L. S., VIANNA, D. S., DRUMMOND, L. M. A., and VICTOR, A. O., 1998, Parallel evolutionary algorithm for the vehicle routing problem with heterogeneous fleet. Future Generation Computer Systems, 14, 285-292.
PHADKE, M. S., KACKAR, R. N., SPEENEY, D . V., and GRIECO, M. J., 1983, Off-line quality control in integrated circuit fabrica- tion using experimental design. Bell System Technical Journal, 62, 1273-1309.
PHADKE, M. S., 1989, Quality Engineering Using Robust Design (Englewood Cliffs: Prentice-Hall).
PIGNATIELLO, J. J. Jr, 1993, Strategies for robust multiresponse quality engineering. IIE Transactions, 25, 5-15.
REDDY, P. B. S., NISHINA, K., and BABU, A. S., 1997, Unification of robust design and goal programming for multiresponse opti- mization-a case study. Quality and Reliability Engineering International, 13, 371-383.
TONG, L.-I., SU, C.-T., and WANG, C.-H., 1997, The optimization of multi-response problems in Taguchi method. International Journal of Quality and Reliability Management, 14, 367-380.