行政院國家科學委員會專題研究計畫 期中進度報告
網際網路的連結結構:分析與模式建構(1/2)
計畫類別: 個別型計畫 計畫編號: NSC92-2213-E-002-055- 執行期間: 92 年 08 月 01 日至 93 年 07 月 31 日 執行單位: 國立臺灣大學電機工程學系暨研究所 計畫主持人: 黃寶儀 計畫參與人員: 劉承榮 楊承瀚 邱垂民 報告類型: 精簡報告 處理方式: 本計畫可公開查詢中 華 民 國 93 年 6 月 1 日
行政院國家科學委員會專題研究計畫 期中進度報告 網際網路的連結結構:分析與模式建構 (1/2) 計畫編號:NSC 92-2213-E-002-055 執行期間:92 年 8 月 1 日 至 93 年 7 月 31 日 (第一年) 執行單位:國立台灣大學電機工程學系暨研究所 計畫主持人:黃寶儀 計畫參與人:劉承榮、楊承瀚、邱垂民 一、中英文摘要
本研究的主要目的在探討網際網路連結架構(Internet topology)在 Autonomous System(AS)層面的各種特徵與模式的建構。我們的做法有別於既存的“統計為主 直覺為輔”(statistics and intuition)方法,以圖學(spectral graph theory)為出發點, 將網際網路的連結予以嚴謹的理論分析。工作主要分三項:1)圖學上與網際網路 相關的量測值(metrics)研究、2)本團隊提出的 Normalized Laplacian Spectrum(nls) 用於鑑別網際網路連結架構與其他圖學良測值的比較、及 3)網際網路連結架構的 模型建構與產生器的編寫。第一年的研究進度略超過預期、各項工具程式的編寫 已大致底定、並且已經開始分析比較的研究。期間、我們也發現了目前運算設備 上的瓶頸。由於網際網路的成長迅速,節點與節線數量大幅增加。經過最佳化之 後,運算所需的記憶體與 CPU cycle 量極高。針對這個問題,我們也藉期中報告 的機會一併提出在電腦設備上小幅增加預算。 關鍵詞: 網際網路連結結構, 圖學, 連結結構產生器
Our goal is to investigate the various characteristics and to establish a high-fidelity model of the Internet topology at the autonomous system (AS) level. Our approach is distinctive of the existing methods aided by statistics and experts’ intuition. In this project, we propose to analyze the Internet topology using rigorous graph theory. The project execution is constructed in 3 parts: 1) the study of the Internet graphs using graph-theoretical metrics, 2) the effectiveness and comparison of the use of Normalized Laplacian Spectrum (nls) to distinguish the Internet topology, and 3) the modeling of the Internet topology and topology generation. We have accomplished more than we anticipate for the first year. As of the time this mid-term report is fired, we are about to finish all implementation of the graph theoretical analysis tools and have begun the analysis and the modeling of the Internet topology. During the year, we also found a bottleneck in computation. Due to the excessive growth of the Internet, the size of the topology in our analysis has exceeded the capacity of the computing equipment we have. After optimizing our tool implementation, the
extensive use of memory and CPU cycles still poses a serious challenge. Therefore, we would like to take advantage of the opportunity to plead for a raise on the
computing equipment budget to accommodate the unexpected computation resource problem.
Keywords: Internet Topology, Graph Theory, Topology Generator
二、計畫目標與規劃
Significant worldwide research efforts have been invested to the investigations of the Internet topology. A better understanding of the Internet topology promises many benefits. For one, it leads to insightful designs of the network sensitive schemes, for instance, the filter placement problem for Distributed Denial of Service attack
prevention [1] and the capacity placement problem for network planning. For two, it helps to construct realistic models of the Internet-like topologies, which in enables a more accurate prediction of the future development of the Internet and allows generating realistic network topologies for performance evaluation.
Some properties of the Internet topology [2-4] have been observed and a number of generators [5-7] for realistic topologies have been proposed. We have identified, on the other hand, weaknesses in existing models and generators that demonstrate the need for further research. Given the main problem of the existing Internet topology analysis is associated with the bias view of the Internet topology from the statistics and common wisdom, we set out in the project to take a more robust graph theoretical approach. Our goal is three-fold:
1) Using the graph theoretical metrics to determine the relevant characteristics of the AS graphs and to compare the actual AS graphs to the synthesized graphs from the existing topology generators
2) Computing the normalized Laplacian spectrum (nls) of AS graphs [8], i.e., the eigenvalues of the normalized Laplacian matrix and verifying the suitability of nls as the Internet topology fingerprint
3) Defining an graph-theory-inspired model of the Internet topology and implementing the model as a graph generator for Internet-like topologies 4) Using the graph theoretical metrics developed in 1) and 2) to verify whether the
In this 2-year project, we propose an in-depth study of the Internet topology on the autonomous system (AS) level, referred to as the AS graph. The project execution is dissected into three parts. We concentrate, for the year one, on the metric
implementation and the first cut of the Internet topology model. For the year two, we anticipate to complete the metric implementation, the graph theoretical analysis, and the topology model and generator. Listed below are specific items to
accomplish and those underlined are items completed during the first year.
1) Graph theoretical metrics (80% completed)
Single value metrics: number of nodes, number of links, average degree, clustering coefficient, cardinality of matching
Distribution metrics: rank-degree, degree-frequency, expansion, distortion, resilience, link value
2) Spectral graph theoretical metrics (100% completed)
Single value metrics: ratio of pendant nodes, ratio of quasi-pendant nodes, ratio of isolated-inner nodes, ratio of quasi-pendant links, average degree of the quasi-pendant component
Distribution metrics: normalized Laplacian spectrum
3) For the graph theory inspired model: we further phase the process in 4 stages. (50% completed)
The 1st stage: classifying the pendant, isolated-inner, and residua-inner nodes into the leaf (outskirt) component of the Internet topology and the quasi-pendant nodes into the core component
The 2nd stage: the generation of the core and leaf clouds and interconnecting the two clouds
The 3rd stage: the generation of the intra-core links The 4th stage: the generation of the intra-leaf links 4) Verification of our own Internet topology model (0%)
This requires completion of the above 3 tasks
三、分析與討論
AS graph data acquisition and validation. Our AS graphs are acquired from the
routeview [9] database which maintains daily snapshot of the BGP [10] updates traversing a number BGP routers on the Internet. We grab a snapshot of such BGP updates for approximately six months apart from November 1997 to October 2003. From the AS paths of the BGP updates, we are able to construct the AS graph of the
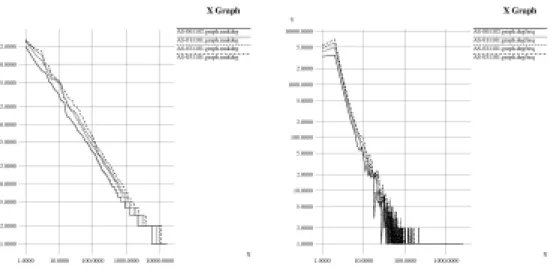
Internet at the particular point in time. With the basic graph metrics implemented, we are able to visualize the growth of the Internet (See Figure 1) and to validate the data from previous analysis that observes power laws in the node rank to node degree, as well as the node degree to degree frequency [2] (See Figure 2).
Total Number of Nodes
0 2000 4000 6000 8000 10000 12000 14000 16000 18000 A S -971108 A S -980102 A S -980401 A S -980701 A S -981002 A S -990112 A S -990402 A S -990701 A S -991002 A S -000102 A S -000403 A S -000707 A S -001002 A S -010102 A S -010420 A S -010701 A S -011001 A S -020101 A S -020401 A S -020701 A S -021001 A S -021231 A S -031001 A S -040225
Total Number of Links
0 5000 10000 15000 20000 25000 30000 35000 40000 A S -971108 A S -980102 A S -980401 A S -980701 A S -981002 A S -990112 A S -990402 A S -990701 A S -991002 A S -000102 A S -000403 A S -000707 A S -001002 A S -010102 A S -010420 A S -010701 A S -011001 A S -020101 A S -020401 A S -020701 A S -021001 A S -021231 A S -031001 A S -040225
Figure 1. The Growth of the Internet AS Graphs (a small gap in 2003 is due to lack of BGP data during that time period)
Figure 2. The Power Laws in the Rank-Degree and Degree-Frequency Relationships
Basic graph theoretical metrics. While the scale of the AS graphs increases in the
number of nodes and links, a number of additional graph theoretical metrics show interesting trends of the Internet. It is becoming better connected but the added connectivity seems to concentrate in certain area. These are better described with
the help of the increasing trend in average degree and the decreasing trend in
matching cardinality (See Figure 3). Maximum cardinality matching by definition is the maximum number of disjoint links that connect a pair of nodes. The decrease of the cardinality of matching indicates that as nodes are being added to the Internet, less links are added to form disjoint links of node pairs. In other words, a significant set of links is added to existing node pairs, which results in a concentration of links in the topology. Average Degree 3 3.2 3.4 3.6 3.8 4 4.2 4.4 A S -9 71108 A S -9 80102 A S -9 80401 A S -9 80701 A S -9 81002 A S -9 90112 A S -9 90402 A S -9 90701 A S -9 91002 A S -0 00102 A S -0 00403 A S -0 00707 A S -0 01002 A S -0 10102 A S -0 10420 A S -0 10701 A S -0 11001 A S -0 20101 A S -0 20401 A S -0 20701 A S -0 21001 A S -0 21231 A S -0 31001 A S -0 40225 Matching Cardinality 0 0.02 0.04 0.06 0.08 0.1 0.12 A S -971108 A S -980102 A S -980401 A S -980701 A S -981002 A S -990112 A S -990402 A S -990701 A S -991002 A S -000102 A S -000403 A S -000707 A S -001002 A S -010102 A S -010420 A S -010701 A S -011001 A S -020101 A S -020401 A S -020701 A S -021001 A S -021231 A S -031001 A S -040225
Figure 3. The Internet Topology Becoming Better Connected and Concentrated
Network relevant graph theoretical metrics. We examine AS graphs using four metrics [11] that are considered having network performance implication. They are expansion, resilience, distortion and link value.
• Expansion is the average number of nodes falling into a given radius. By increasing the radius, one could observe how fast the AS graph ‘expands’. For a k-ary tree, one should observe an exponential increase of the expansion.
• Resilience is the average minimum cut-set size to disconnect a graph into a balanced two parts for a given n-node neighborhood centered at each node in the graph. By varying the neighborhood size, one could project the
possibility of finding alternative routes to distant nodes in the topology.
• Distortion is a less intuitive metric. Given a graph G and any spanning tree T on G, for all pairs sharing a link in G, find the average distance of them in T. The distortion metric is defined to be the smallest of such average distance among all possible spanning trees on G. This is a metric to examine how tree-link the topology is.
It is defined to be the vertex cover of a traversal set of a link. The traversal set of a link is defined to be the source-destination pairs that traverse the link on the shortest path. The vertex cover of a traversal set is the minimum number of nodes to remove to eliminate at least one node from each pair in the traversal set. Intuitively, the link value metric indicates the smallest set of nodes affected by the removal of the link. Thus, the higher the value, the more important the link.
We have accomplished in implementing the expansion and link value and the results are validated with the prior results in [11]. Resilience and distortion involves solving additional NP-hard problems. The existing heuristics are time and memory consuming. We are looking into more efficient implementations of the heuristics to overcome the lack of computing resource problem. The results of AS graph
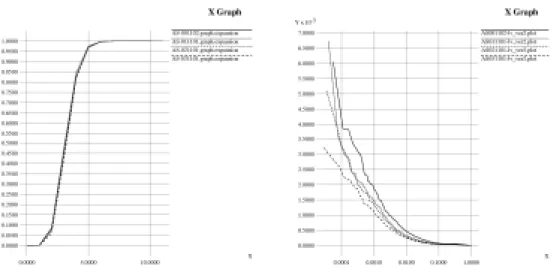
expansion and link value distribution are provided in Figure 4.
Figure 4. The expansion plot on the left shows that the AS Graph expands quickly to the h-radius neighborhood. The link value plot on the right shows that the AS Graph link value variance decreases over the years
Normalized Laplacian spectrum analysis. Based on the spectral graph theory, we
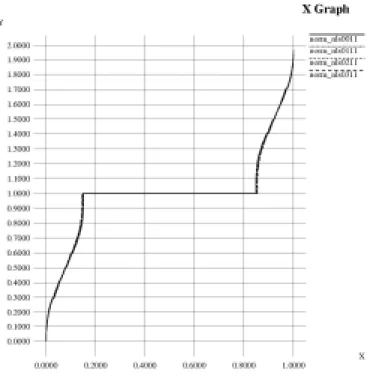
implement the computation of normalized Laplacian spectrum (nls) [8]. Figure 5 shows the nls of the AS graphs from 2000 to 2003. We find that the nls of the AS
graphs are about the same, as opposed to many other graph theoretical metrics in which we observe significant differences over time. One remarkable observation is that the expansion metric, although simple, shows potential as the fingerprint the Internet topology. We think this is an artifact of the data presentation. If we would zoom in to look at the low-radius region more closely, we could see significant differences in the expansion of AS graphs over the years.
Figure 5. The nls of the AS graphs from 2000 November to 2003 November
Internet topology modeling. We have classified the so-called pendant (P),
isolated-inner (I), and residua-inner nodes (R) in the spectral graph theory into the leaf (outskirt) component of the Internet topology and the quasi-pendant nodes (Q) into the core component. From the ratio of P, I, R, and Q nodes in the AS graphs, we could qualitatively form the core and leaf clouds to their rightful share of the whole graph. The more challenging part is to connect the nodes between and within the leaf and core clouds. For the interconnection, we further divide the topology
generation in three parts: 1) interconnecting the core and leaf clouds, 2)
interconnecting the core clouds, and finally 3) interconnecting the leaf clouds. We have completed so far to the part one. However, the results show the model captures the core and leaf cloud interconnection well. Figure 6 shows that, accounting only the core and leaf interconnections, our graphs better qualitatively resemble the AS graphs than the state-of-the-art Inet 3.0 graphs [5]. We, however, find in the meantime the graph property could vary quite a bit depending on the choice of parameter and random seeds.
Figure 6.
Upper left plot shows for each leaf node the degree to frequency distribution. Upper right plot shows, for each core node, the degree to frequency distribution.
Lower left plot shows for each leaf-core link the leaf node degree and frequency distribution. Lower right plot shows for each leaf-core link the core node degree and frequency distribution.
四、成果自評
We have completed more than what we have anticipated for the first year. In particular, 80% of the graph theoretical metrics are implemented, 100% of the nls related implementation are completed. The most encouraging result is that our Internet topology model is 50% complete and the quality of our graphs is significantly better than those from the state-of-the-art generator. The graph metric computation tools will help pave the road for further research in Internet topology. The graph generation tool will solve the problem of generating Internet-like topology for performance evaluation at different scales (especially the small scale). If the shortage of computation resource can be resolved, we expect the project to complete in its full 2-year length without problem.
The graduate students involved are trained intensively of the practical knowledge on Internet routing and network operation. They are also trained rigorously of the graph theory and analysis methodology. The students are also becoming aware of a little wit applied to the implementation may influence the computation efficiency greatly. We view these training invaluable to the R&D career of the students in the future.
五、參考文獻
[1] K. Park and H. Lee. On the effectiveness of route-based packet filtering for distributed dos attack prevention in power-law Internet. In Proc. of ACM SIGCOMM, 2001.
[2] M. Faloutsos, P. Faloutsos, and C. Faloutsos. On power-law relationships of the Internet topology. In Proc. of ACM SIGCOMM, pages 251–262, 1999. [3] Q. Chen, H. Chang, R. Govindan, S. Jamin, S. Shenker, and W. Willinger.
The origin of power laws in Internet topologies revisited. In Proc. of IEEE INFOCOM, 2002.
topology. ACM SIGCOMM Computer Communication Review, pages 26–37, July 2001.
[5] Jared Winick and Sugih Jamin; Inet-3.0: Internet Topology Generator. Tech Report UM-CSE-TR-456-0, University of Michigan
[6] T. Bu and D. Towsley. On distinguishing between Internet power law topology generators. In Proc. of IEEE INFOCOM, 2002.
[7] Medina, I. Matta, and J Byers. On the origin of power laws in Internet topologies. ACM SIGCOMM Computer Communication Review, April 2000.
[8] D. Vukadinovi`c, P. Huang, and T. Erlebach. On the Spectrum and Structure of Internet Topology Graphs. In the proceedings of the Innovative Internet Computing Systems (I2CS 2002), June 2002
[9] Routeviews.org. The university of Oregon route views archive project. [10] Y. Rekhter and T. Li, A Border Gateway Protocol 4 (BGP-4). IETF, Request
for Comments: 1771
[11] H. Tangmunarunkit, R. Govindan, S. Jamin, S. Shenker, and W. Willinger. Network topology generators: Degree-based vs. structural. In the Proc. of ACM SIGCOMM, 2002.


