Seismic stability analysis of a large
underground cavern adjacent to slope -
Case study in Taiwan
Chien-Lun Kung, Chia-Han Lee, Ta-Fu Ho, and Li-Cheng Hsu
Abstract
There are four cases of seismic stability analysis for large underground caverns collected firstly. Secondly, as a cases study of Zengwen Reservoir Sediment Sluicing Tunnel, the design change from a single large-span cavern to double caverns due to the conditions of adjacent to slope and shallow cover is explained. The design of seismic analysis for the caverns under design earthquake is illustrated. Finally, the seismic response of the caverns under earthquake in Mar. 20, 2018 is used in-situ monitoring and 3D numerical simulation to investigate. And evaluate the seismic stability of the caverns by in-situ inspection.
Keywords: underground cavern, seismic response, in-situ monitoring, 3D numerical simulation.
1 Introduction
Large underground caverns in Taiwan are mostly built for hydroelectric power needs, such as Zengwen, Minghu, Mingtan, Zhuolan, Guguan and Qingshan Hydroelectric Power Plants. When designing, sites with better environmental conditions are usually selected.
Due to limited hinterland and operational considerations, the construction and operation of the Zengwen Reservoir Sediment Sluicing Tunnel (ZRSST) project has faced many challenges, particularly when the tunnel’s plunge pool and outlet section are adjacent to slope and the span of cavern is large. In addition, Taiwan is located on the boundary of two tectonic plates, which is an area with active orogenic movement, leading to frequent seismic activities. The Chi-Chi Earthquake on September 21, 1999 caused serious damage to the lining of 49 tunnels in Taiwan (Wang et al., 2001), suggesting that the operation of underground caverns may face the test given by strong earthquakes.
This paper first collected the cases of seismic stability analysis for underground caverns, and then took the sediment sluicing tunnel of Zengwen Reservoir in southern Taiwan as an example to illustrate the considerations in designing the seismic force for the outlet of the tunnel with large underground cavern. Finally, in-situ monitoring and numerical simulation were adopted to investigate the response of the cavern under earthquake, assessing the seismic stability of the large underground cavern.
2 Cases of seismic stability analysis for domestic and foreign
underground structures
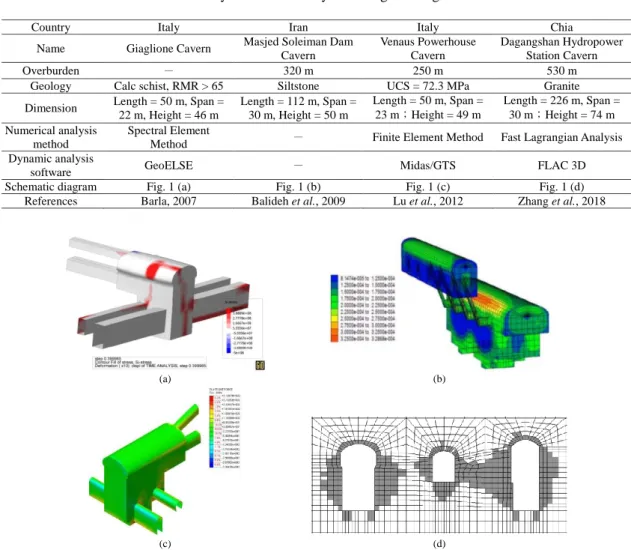
The cases of seismic stability analysis collected for large underground caverns are summarized in Table 1. It can be seen from Table 1 that many countries have started paying attention to the issue of seismic stability for underground structures, and began to use numerical analysis to carry out related investigation and design. The numerical analysis methods include: Finite Element Method, Finite Difference Method, and Spectral Element Method, etc.; and their dynamic input method is mostly based on the actual acceleration duration of a certain earthquake.
Table 1: Case study of seismic analysis of large underground caverns
Figure 1: Case study of seismic analysis of large underground caverns. (a) Giaglione Cavern (Barla, 2007); (b) Masjed Soleiman Dam Cavern (Balideh et al., 2009); (c) Venaus Powerhouse Cavern (Lu et al., 2012); (d) Dagangshan Hydropower Station Cavern (Zhang et al., 2018)
Country Italy Iran Italy Chia
Name Giaglione Cavern Masjed Soleiman Dam Cavern Venaus Powerhouse Cavern Dagangshan Hydropower Station Cavern Overburden - 320 m 250 m 530 m
Geology Calc schist, RMR > 65 Siltstone UCS = 72.3 MPa Granite Dimension Length = 50 m, Span =
22 m, Height = 46 m Length = 112 m, Span = 30 m, Height = 50 m Length = 50 m, Span = 23 m;Height = 49 m Length = 226 m, Span = 30 m;Height = 74 m Numerical analysis method Spectral Element
Method - Finite Element Method Fast Lagrangian Analysis Dynamic analysis
software GeoELSE - Midas/GTS FLAC 3D
Schematic diagram Fig. 1 (a) Fig. 1 (b) Fig. 1 (c) Fig. 1 (d) References Barla, 2007 Balideh et al., 2009 Lu et al., 2012 Zhang et al., 2018
(a) (b)
3 The outlet section design of the ZRSST project
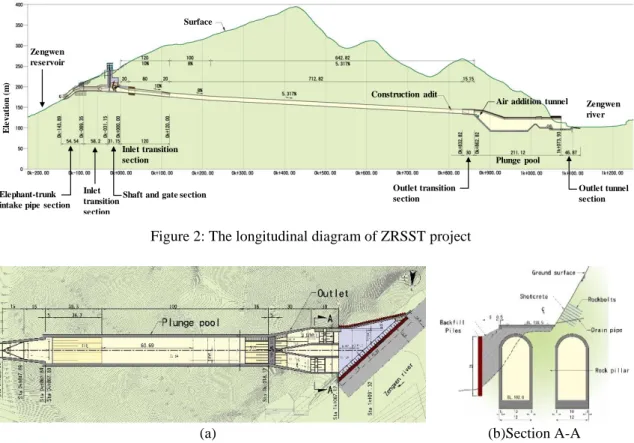
3.1 The design concept of outlet sectionDue to the space of Zengwen river for the outlet section of ZRSST (Figure 2) is limited, the plunge pool with a length of about 100.5 m in the outlet section must be constructed inside the mountain. However, since the clearance span requirement for the plunge pool was 20 m, and the structure was adjacent to a slope and it is difficult in achieving the arching effect after excavation; therefore, the original design was to reduce the span of the plunge pool by double arch with a 10-m span for each arch. The shape is look like a seagull, and the middle needs a reinforced concrete column with thickness of 4 m. The shape also looks like a glasses. The construction sequence is first carried out the excavation and supporting for the 4-m thick middle column, and then for the two sides. In addition, due to the position of the outlet forming an oblique configuration with the slope nearby, in order to reduce the bias effect on the stability of the cavern, the techniques of piles and side wall combining with backfill covering were used in the basic design, first stabilizing the bottom of slope and at the same time reducing the bias effect before excavation the cavern (UGI, 2012).
Figure 2: The longitudinal diagram of ZRSST project
(a) (b)Section A-A
Figure 3: The schematic diagram of the outlet section of the ZRSST
To be cautious, the basic design consulting company invited a senior consultant from an engineering consulting company in Switzerland to review the basic design. After carrying out in-situ investigation, core analysis and discussion, the foreign consultant
Zengwen road tunnel
No. 1 water diversion tunnel
Main tunnel section Elephant-trunk
intake pipe section Inlet transition
section Shaft and gate section
Inlet transition section
Air addition tunnel Construction adit Maintenance sidewalk Outlet transition section Plunge pool Outlet tunnel section Zengwen reservoir Zengwen river Surface E le vat ion ( m ) Elephant-trunk intake pipe section
Inlet transition section
Shaft and gate section Inlet transition section
Construction adit
Air addition tunnel
Outlet tunnel section Plunge pool
Outlet transition section
recommended dividing the outlet section from one to two, and increasing the distance between the two caverns, as shown in Figure 3 (a). The consultant also recommended modifying the size of the plunge pool in accordance with the results of the hydraulic modeling test. The design of the outlet section on the other hand followed the spirit of the original basic design, adopting the techniques of piles and side wall combining with light concrete backfill to first stabilize the bottom of slope and at the same time reducing the bias effect before excavation the cavern. Details are shown in Figure 3 (b) (UGI, 2012).
3.2 Seismic analysis and design 3.2.1 Seismic design
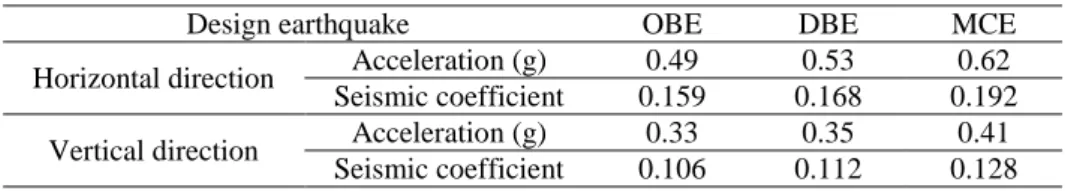
The seismic design of the outlet section of the ZRSST is based the rules and regulations of the Southern Region Water Resources Office (2012). After performing the earthquake hazard assessment, three seismic scenarios were defined, namely the Operating Basis Earthquake (OBE), Design Basis Earthquake (DBE) and Maximum Credible Earthquake (MCE). Table 2 shows the peak ground acceleration and coefficient values for the seismic design of the ZRSST.
Table 2: Peak ground acceleration and coefficient of the design earthquake Design earthquake OBE DBE MCE Horizontal direction Acceleration (g) 0.49 0.53 0.62
Seismic coefficient 0.159 0.168 0.192 Vertical direction Acceleration (g) 0.33 0.35 0.41
Seismic coefficient 0.106 0.112 0.128
3.2.2 Lining design
The lining design of the outlet section of the ZRSST was analyzed according to the load combination of the concrete structure design specifications. The seismic force is considered based on the corresponding response spectrum as shown in Table 2. According to the analysis of the specified load combination, force distribution of the underground tunnel lining structure was obtained. The results were used to determine the concrete lining thickness and the number of steel bars required.
4 Cavern seismic analysis and inspection
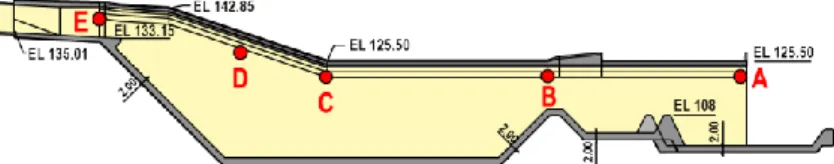
4.1 Cavern seismic response monitoring 4.1.1 Installation of 3D accelerometerFigure 4 shows the layout of three-dimensional (3D) accelerometer for the outlet section of the ZRSST. There were five 3D MEMS (Microelectromechanical System) accelerometers installed in the outlet section of the ZRSST, which were located on the north side of the lining trail. The measurement range of the accelerometer is ±2 g and the frequency range is 0~500 Hz, with sampling frequency set at 100 Hz.
4.1.2 Dapu Earthquake (March 20, 2018)
The Dapu Earthquake occurred on March 20, 2018. The epicenter is located in Dapu Township of Chiayi County, Taiwan (23.31°N, 120.54°E), with a Richter magnitude scale of 5.3, and a maximum seismic intensity of V (80~250 gal) in Dapu Township. In this earthquake, a total of four 3D accelerometers were used to record the acceleration response, while accelerometer D had no record due to poor signal. Figure 6 shows the acceleration record of accelerometer C in the north-south and east-west direction. The maximum acceleration values for all accelerometers are summarized in Table 3. Table 3 shows the maximum acceleration values of each accelerometer. The directions of maximum acceleration for accelerometers A, B and C are all in the north-south direction; the east-west direction has less acceleration; and the vertical direction has the smallest acceleration. In contrast, the direction of maximum acceleration for accelerometer E is in the east-west direction; the north-south direction has less acceleration; and the vertical direction has the smallest acceleration. From the acceleration value of each accelerometer, it can be seen that the larger the span of cavern, the greater the acceleration.
Figure 4: The setup of five 3D accelerometer in the outlet section of the ZRSST
(a) N direction (b) E direction
Figure 6: Acceleration record of survey station C in N and E direction
Table 3: Maximum acceleration of each survey station A to D
NO. N (gal) Direction E (gal) U (gal)
A 88.05 72.50 56.84 B 97.86 66.10 64.91 C 104.32 65.68 58.84 E 65.92 76.44 48.58 4.2 3D Numerical simulation 4.2.1 Model information
In this paper, the 3D numerical simulation based on the MIDAS GTS NX program of finite element method was used to carry out non-linear dynamic time history analysis.
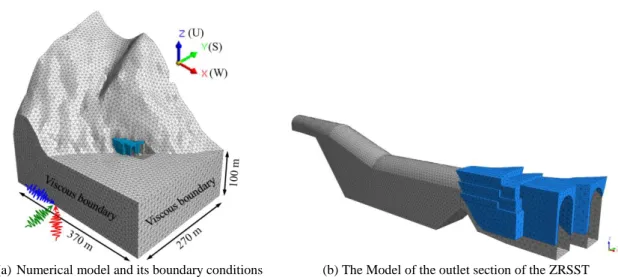
Figure 7 shows the 3D numerical model and its boundary conditions. Table 4 shows the mechanical parameters of the numerical model.
(a)Numerical model and its boundary conditions (b) The Model of the outlet section of the ZRSST
Figure 7: The 3D numerical model and its boundary conditions
Table 4: Mechanical parameters of numerical model Elastic
modulus (GPa) Poisson ratio Unit weight (kN/m3) velocity (km/s) Shear wave Compression wave velocity (km/s)
Rock mass 0.759 0.18 23.93 0.363 0.581 Concrete
lining 29.127 0.20 23.54 - -
4.2.2 Input motion
Figure 8 shows the response recorded by the free-field observation station about 1 km northeast of the ZRSST during the Dapu earthquake. Considering that the seismic wave transmitting from the bedrock to the surface will be amplified, the SHAKE program was used to deconvolute the ground acceleration in the north-south and east-west direction to a depth of 100 m. The resulting acceleration time history was inputted into the model.
4.2.3 Analysis of results
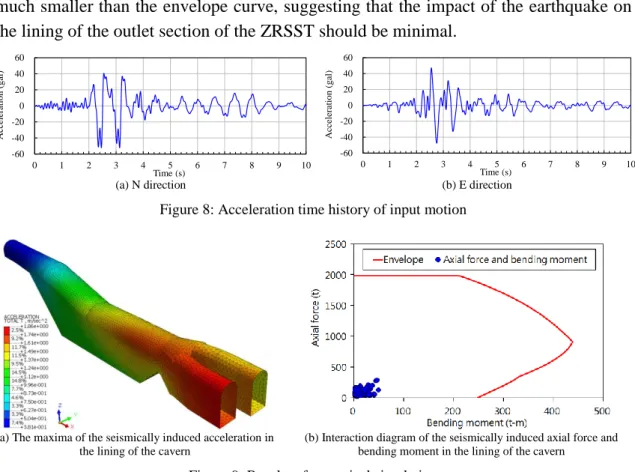
Figure 9(a) shows the maximum acceleration distribution diagram of the lining after carrying out the seismic analysis of the outlet section of the ZRSST. It is obvious that the maximum acceleration value of the lining near the slope is large while that near the tunnel is small. Compared with Table 3, the analysis results and the results from in-situ monitoring results are consistent. However, the acceleration response of the analysis is not correlated to the span of the cavern.
Figure 9(b) shows the seismically induced axial force and bending moment interaction diagram of the lining of the outlet section of the ZRSST. The red line represents the allowable stress line (or envelope curve) for the lining, while the points represent the seismically induced axial force and bending moment increment. The seismically induced axial force and bending moment increment of the lining under earthquake is
much smaller than the envelope curve, suggesting that the impact of the earthquake on the lining of the outlet section of the ZRSST should be minimal.
(a) N direction (b) E direction
Figure 8: Acceleration time history of input motion
(a) The maxima of the seismically induced acceleration in the lining of the cavern
(b) Interaction diagram of the seismically induced axial force and bending moment in the lining of the cavern
Figure 9: Results of numerical simulation
4.3 In-situ inspection of the cavern
In this study, inspection for the entire tunnel was conducted from 2 days after the earthquake. Figure 11 shows the condition of the outlet section of the ZRSST. By comparing the images of the lining of the cavern before and after the earthquake, it is apparent that there is no abnormality in the lining of the cavern after the earthquake, suggesting that the cavern is in good condition and is safe. The results show that the earthquake has little impact on the outlet section of the ZRSST.
5 Conclusions
This paper first collected the cases of seismic analysis for underground caverns, and then took the sediment sluicing tunnel of Zengwen Reservoir as an example to illustrate the reduced bias effect by changing the outlet section of the tunnel from a single large-span cavern to double caverns and adopting the thick foundation covering. In addition, the considerations in designing the seismic force for the water outlet of the tunnel were illustrated. Finally, in-situ monitoring and numerical simulation were adopted to investigate the response of the cavern under earthquake, assessing the seismic stability of the structure. This case study can be a reference for similar projects in the future. The large underground cavern is a highly statically indeterminate system. The surrounding environment can have a huge impact on the stability of the structure.
-60 -40 -20 0 20 40 60 0 1 2 3 4 5 6 7 8 9 10 Acceler atio n (gal) Time (s) -60 -40 -20 0 20 40 60 0 1 2 3 4 5 6 7 8 9 10 Acc eleratio n (g al) Time (s)
Although several domestic and international cases of seismic design for underground caverns have been investigated, the behavior of underground cavern under earthquake is not fully understood. Therefore, the seismic response of underground caverns needs to be studied in order to facilitate the seismic design of underground caverns in the future.
(a) Photo of the cavern before the Dapa earthquake (b) Photo of the cavern after the Dapa earthquake
Figure 11: Appearance of the lining of the cavern
References
Wang et al. (2001). Assessment of damages in mountain tunnels due to the Taiwan Chi-Chi Earthquake. Tunnelling and underground Space Technology, 16, 133-150.
Barla (2007). Underground structures rock tunnels and caverns. Innovative methods for the design of geotechnical systems, 1-14.
Balideh et al. (2009). Seismic Analysis of Underground Spaces to Propagation of Seismic Waves (Case Study: Masjed Soleiman Dam Cavern). Journal of Applied Sciences, 9(9), 1615-1627. Lu et al. (2012). 2D and 3D continuum static and dynamic modeling of a large span powerhouse
cavern in Italy. Eurock 2012, 1-14.
Zhang et al. (2018). Effect of seismic frequency spectra on surrounding rock damage evolution of large underground caverns. Advances in Materials Science and Engineering, 1-15.
United Geotech, Inc. (2012). Basic Design Report of Zengwen Reservoir Sediment Sluicing Tunnel Project. Southern Region Water Resources Office, WRA, MOEA, Taiwan. (in Chinese)
Southern Region Water Resources Office (2012). The Fourth Safety Assessment of Zengwen Reservoir. Southern Region Water Resources Office, WRA, MOEA, Taiwan. (in Chinese)
Authors
Chien-Lun Kung
Chia-Han Lee (corresponding author) United Geotech, Inc., Taiwan
Email: ug513@mail.ugi.com.tw
Ta-Fu Ho Li-Cheng Hsu