A Citation Data Analysis of JCR-Covered Journals
in Geosciences
Shengli Ren
Department of Publication, National Natural Science Foundation of China E-mail: rensl@rose.nsfc.gov.cn
Ronald Rousseau
1KHBO, Department of Industrial Sciences and Technology, Oostende, Belgium E-mail: rousseau@kh.khbo.be
Keywords(關鍵詞): Geosciences;Earth Sciences;Journal Citation Reports;
Bibliometric Indicators;Influential Journals
【Abstract】
This article describes some indicators provided by ISI’s Journal Citation Reports (edition 1998) for the field of geosciences. This field is subdivided in twenty categories. Average values of the journal impact factor, total number of citations, immediacy index, and the number of source items are given and discussed. It is concluded that these indicators have lower values than the average journals covered by the JCR.
1. INTRODUCTION
Citation analysis can be described as that subfield of bibliometrics, where one analyses patterns and frequencies of citations, is given as well as received. This is done on the level of authors, journals, scien-tific disciplines and so on. Citation analysis further studies relations between cited and citing units (documents, authors, countries, etc.). This definition
of the term ‘citation analysis’ is adapted from the one given by Spinak (1996). This article focuses on cita-tion analysis as applied to journals, with special at-tention to geosciences journals as covered by ISI’s Journal Citation Reports (JCR). We will use the term ‘geosciences’ in a very broad sense, namely all sci-ences that study the earth in all aspects. In this we follow the usage of the National Natural Science Foundation of China (1999). A precise list of the JCR-categories that we include under the term ‘geo-sciences’ is presented in Table 1.
2. STATISTICS OF GEOSCIENCES
JOURNALS COVERED BY ISI
The 1998 edition of the JCR covers 5,467 journals scattered over 158 fields. Among these 158 fields, nineteen, containing 578 journals, fall into the do-main of geosciences. Moreover, the field “Geochem-istry & Geophysics” clearly contains two separate fields. Consequently we will consider the domain of geosciences as consisting of twenty fields. Among these 578 journals four were classified in four fields,
thrity-six in three and 133 in two, leading to a sum of 795 (see Table 1). This duplication also influences other totals considered further in this article.
The Journal Citation Reports routinely provides the following journal indices: the ISI-impact factor, the total number of citations received by each journal, the number of citable articles published by each journal (the so-called source articles), the immediacy index and the cited half-life. Based on the data pro-vided by the JCR, Table 1 gives the list of fields
in-cluded in the geosciences cluster, an abbreviation for each field, the number of journals included in each category, the average of all impact factors (IF) of journals categorized in the field, the average total number of citations for each field (TC), the average of all immediacy indices (II) of journals in the field and the average number of source items (SI) and the average cited half-life (where half-lives larger than ten were arbitrarily given a value of twelve).
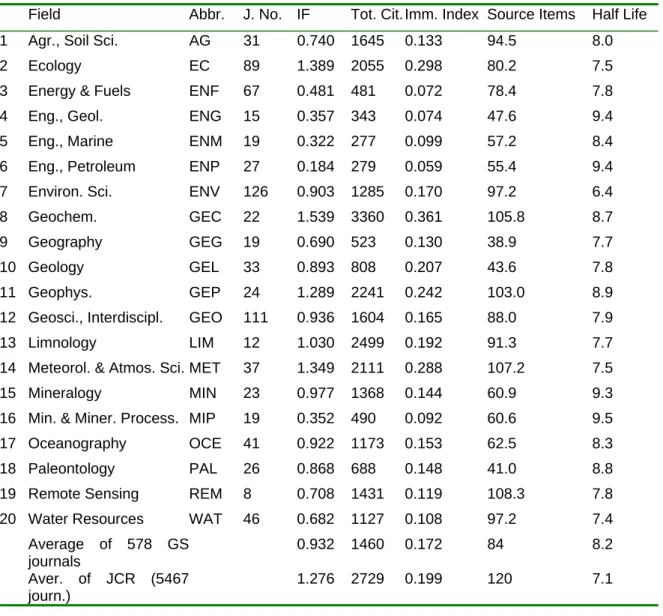
Table 1 Basic publication and citation data of geosciences
Field Abbr. J. No. IF Tot. Cit. Imm. Index Source Items Half Life 1 Agr., Soil Sci. AG 31 0.740 1645 0.133 94.5 8.0 2 Ecology EC 89 1.389 2055 0.298 80.2 7.5 3 Energy & Fuels ENF 67 0.481 481 0.072 78.4 7.8 4 Eng., Geol. ENG 15 0.357 343 0.074 47.6 9.4 5 Eng., Marine ENM 19 0.322 277 0.099 57.2 8.4 6 Eng., Petroleum ENP 27 0.184 279 0.059 55.4 9.4 7 Environ. Sci. ENV 126 0.903 1285 0.170 97.2 6.4 8 Geochem. GEC 22 1.539 3360 0.361 105.8 8.7 9 Geography GEG 19 0.690 523 0.130 38.9 7.7 10 Geology GEL 33 0.893 808 0.207 43.6 7.8 11 Geophys. GEP 24 1.289 2241 0.242 103.0 8.9 12 Geosci., Interdiscipl. GEO 111 0.936 1604 0.165 88.0 7.9 13 Limnology LIM 12 1.030 2499 0.192 91.3 7.7 14 Meteorol. & Atmos. Sci. MET 37 1.349 2111 0.288 107.2 7.5 15 Mineralogy MIN 23 0.977 1368 0.144 60.9 9.3 16 Min. & Miner. Process. MIP 19 0.352 490 0.092 60.6 9.5 17 Oceanography OCE 41 0.922 1173 0.153 62.5 8.3 18 Paleontology PAL 26 0.868 688 0.148 41.0 8.8 19 Remote Sensing REM 8 0.708 1431 0.119 108.3 7.8 20 Water Resources WAT 46 0.682 1127 0.108 97.2 7.4 Average of 578 GS journals 0.932 1460 0.172 84 8.2 Aver. of JCR (5467 journ.) 1.276 2729 0.199 120 7.1
3. A DISCUSSION AND ANALYSIS OF
JCR-INDICES FOR GEOSCIENCES
JOURNALS
3.1 IMPACT FACTOR (IF)
We recall that the impact factor as given in ISI’s JCR is a synchronous two-year impact factor (Ing-wersen et al., 2001). Impact factors (IF) of the 578 geosciences journals in the year 1998 can be catego-rized as shown in Table 2.
Table 2 Global categorization of geosciences journals by impact factor
IF ≥ 4.0 7 4.0 > IF ≥ 3.0 14 3.0 > IF ≥2.0 42 2.0 > IF ≥ 1.0 136 1.0 > IF ≥0.5 152 IF < 0.5 227
The journal CHEMISTRY AND PHYSICS OF
CARBON had the highest impact factor, namely
8,667. This list of impact factors clearly shows the elitism between journals. Few have a very high im-pact factor, while many have a low one. The same form of elitism is present in many aspects of infor-mation studied in the inforinfor-mation sciences. Indeed, many scientists publish little (or nothing at all), few publish many articles; similarly: many sites on the Internet have just a few in-links, few have thousands of in-links (Xu, 1988; Egghe & Rousseau, 1990; Rousseau, 1997; Carlson & Doyle, 1999; Katz, 1999). These regularities can often be described by a power law (Lotka’s law).
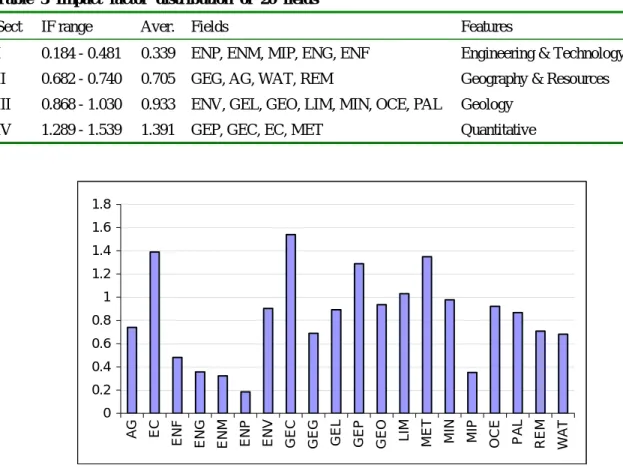
Based on the average impact factor we can classify the twenty fields in four large groups with the fol-lowing general features, see Table 3 and Fig.1.
Table 3 Impact factor distribution of 20 fields
Sect IF range Aver. Fields Features
I 0.184 - 0.481 0.339 ENP, ENM, MIP, ENG, ENF Engineering & Technology II 0.682 - 0.740 0.705 GEG, AG, WAT, REM Geography & Resources III 0.868 - 1.030 0.933 ENV, GEL, GEO, LIM, MIN, OCE, PAL Geology
IV 1.289 - 1.539 1.391 GEP, GEC, EC, MET Quantitative
0 0.2 0.4 0.6 0.8 1 1.2 1.4 1.6 1.8 AG EC EN F EN G EN M EN P EN V
GEC GEG GEL GEP GEO LIM ME
T
MIN MIP OCE PA
L
REM WA
Table 3 and Fig 1 indicates that impact factors of different fields show large differences. Consider, for instance, the field of Engineering Geology. Its top journal, "Geotechnique,” has an impact factor of 0.917, which puts it only at the 220th place among the 578 geosciences journals considered.
The average IF of a geosciences journal is only 0.932, which is 27% lower than the average IF of all 5,467 journals in the 1998 edition of the JCR (1.276).
3.2 Total number of citations (TC)
We classify geosciences journals with respect to the total number of received citations (TC) as shown in Table 4.
Table 4 Geosciences journals grouped according to the total number of citations received
TC ≥ 10,000 14 10,000 >TC ≥ 5,000 24 5,000 > TC ≥ 1,000 149 1,000 > TC ≥ 500 97 500 > TC ≥ 100 195 TC < 100 99
The TC of the 10% most cited journals (58) is 482,689, accounting for more than half (57.2%) of the total citations of all 578 geosciences journals (namely 844,022). Similarly, the TC of the 20% most cited journals (116) is 625,213, which accounts for 74.1% of the all citations. The average TC of these geosciences journals is 1,460, which is 47% lower than the average TC of all 5,467 journals in the 1998 edition of the JCR (2,729).
3.3 Source items (SI)
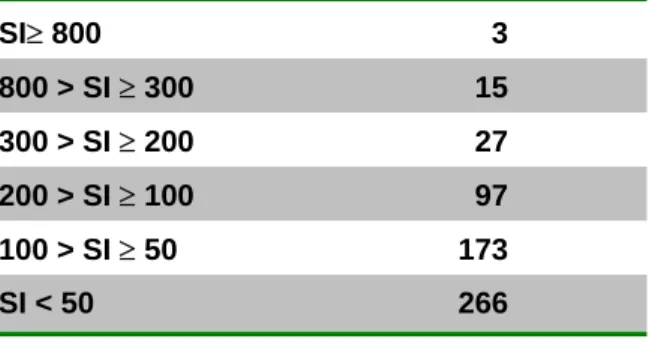
The term ‘source items’ (SI) as used in the defini-tion of the ISI impact factor refers to so-called cit-able documents, i.e. normal articles, notes and re-views (Moed & Van Leeuwen, 1995). The distribu-tion of the number of source items in the 578 geo-sciences journals is shown in Table 5.
Table 5 Number of geosciences journals classified according to number of source items.
SI≥ 800 3 800 > SI ≥ 300 15 300 > SI ≥ 200 27 200 > SI ≥ 100 97 100 > SI ≥ 50 173 SI < 50 266
The SI of the 10% most cited journals (58) is 19,231, which accounts for 39.6% of the total SI of all 578 journals (48,582).The SI of the 20% most cited journals (116) is 27,101, accounting for 55.8% of the total SI of all 578 journals (48,582).The aver-age number of source items in a geosciences journal is eighty-four, which is 30% lower than that of all journals in the 1998 edition of the JCR (being 120).
3.4 Immediacy index (II)
The average immediacy index (II) of geosciences journals is 0.172, which is again lower than that of all 5,467 journals in the 1998 edition of the JCR (0.199).
4
.CORRELATIONS BETWEEN
PUBLICATION AND CITATION
INDICATORS
For the following analysis we removed thirty-two journals without source journals, thirty-two review journals and eighteen journals publishing exclusively (or mainly) in other languages than English. These journals were removed because they often show an irregular or abnormal behavior. In statistical terms they should be considered as outliers.
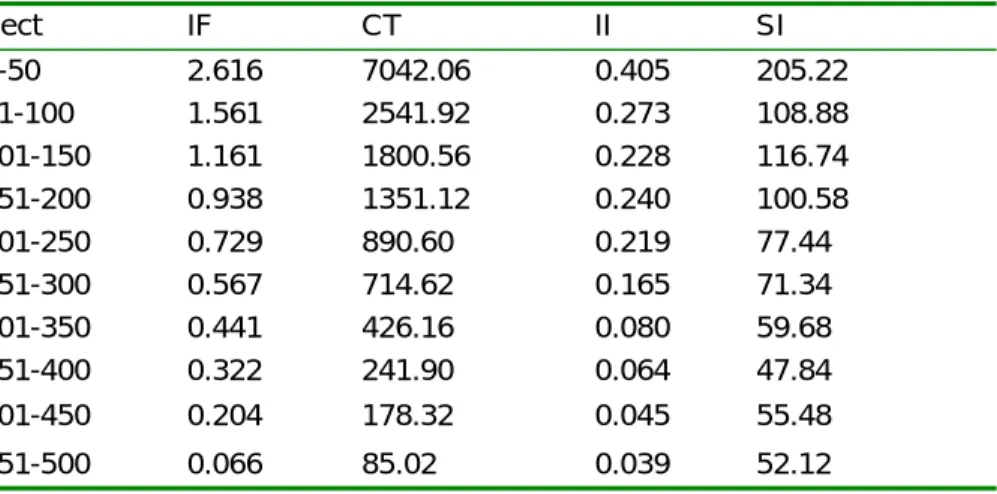
The remaining 500 journals are classified in ten sections according to their impact factor (Table 6). A glimpse to this table immediately reveals a high cor-relation between indicator values.
Table 6 Average indicator values of ten sections (each containing 50 journals) ranked according to impact factor Sect IF CT II SI 1-50 2.616 7042.06 0.405 205.22 51-100 1.561 2541.92 0.273 108.88 101-150 1.161 1800.56 0.228 116.74 151-200 0.938 1351.12 0.240 100.58 201-250 0.729 890.60 0.219 77.44 251-300 0.567 714.62 0.165 71.34 301-350 0.441 426.16 0.080 59.68 351-400 0.322 241.90 0.064 47.84 401-450 0.204 178.32 0.045 55.48 451-500 0.066 85.02 0.039 52.12
4.1 Relation of IF and Total Citations
Considering these ten sections we see that the Pearson correlation coefficient between the variables IF and TC (the total number of citations) is 0.967,
which is very close to a perfect correlation of 1 (Fig 2). Further, the correlation between IF and TC for the 20 fields (based on Table 1) is 0.881.
0 1000 2000 3000 4000 5000 6000 7000 8000 0 0.5 1 1.5 2 2.5 impact factor tota l c ita tions 3
Fig 2 Relation between impact factor and total numbers of citations per section bassed on table 6 4.2 Relation between IF and Source Items (SI)
The correlation coefficient between the variables IF and SI of the ten sections is also very high,
namely 0.975 (Fig 3). Calculated for the twenty fields of Table 1, we find a correlation coefficient of 0.521. 0 50 100 150 200 250 0 0.5 1 1.5 2 2.5 3 num ber o f source it em s
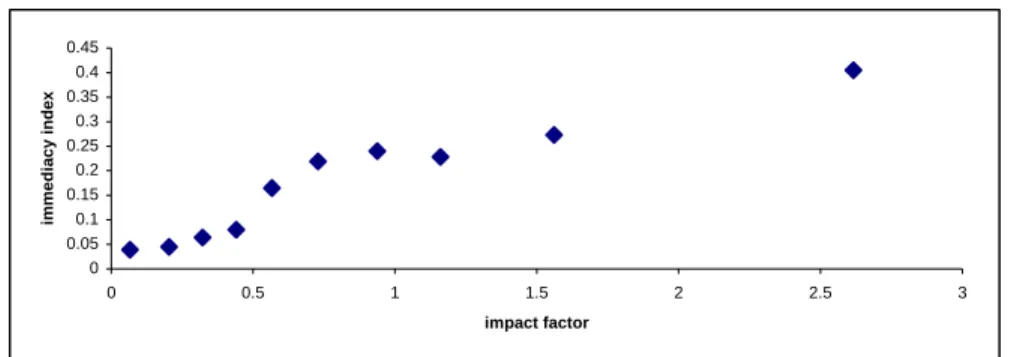
4.3 Relation between IF and the Immediacy Index (II)
The correlation coefficient between the impact factor and the immediacy index (again for these ten sections) is 0.950 (Fig. 4). Further, the corresponding value of Table 1 is 0.944. We note that the
correlation coefficient between the II and the IF for all 494 journals for which we have data (for four more journals no II is provided) is, however, only 0.4163. 0 0.05 0.1 0.15 0.2 0.25 0.3 0.35 0.4 0.45 0 0.5 1 1.5 2 2.5 3 impact factor imme di acy i ndex
Fig 4 Relation between impact factor and immediacy index for ten sections (Table 6)
We note that, although these correlations might yield interesting information and have been studied before (Yue & Wilson; 2001), there is no direct causal relation between these two numbers as they relate to citations received by different source items.
4.4 Some other correlation values
We just mention that the correlation coefficient between SI and TC is 0.976, the one between SI and II is 0.927 and the one between TC and II is 0.876.
The correlation values obtained can be considered as characteristics of the field as partitioned in this special way. Correlation coefficients for all journals (as e.g. calculated for II-IF) can be very different. Moreover, as pointed out for the II-IF pair, there is no causal relation as they refer to different and unre-lated time spans. There is, for instance, no causal
relation between the number of source items in a certain year and the total number of citations re-ceived in that year.
5. A DISCUSSION OF THE MOST INFLUEN- TIAL JOURNALS
For the sake of argument we define an ‘influential’ journal as one that has a high impact factor, receives a large amount of citations (CT), and published many articles.
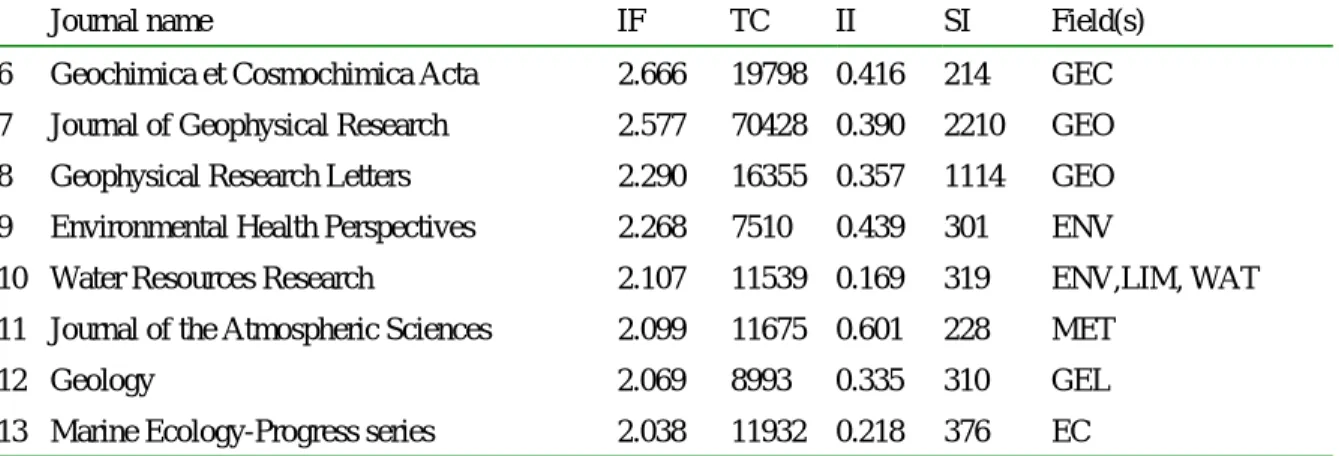
Among the 5,478 journals, there are sixty-three journals with an impact factor (IF) larger than 2.0, 200 journals that received more than 5,000 citations (TC > 5,000), and forty-five journals with SI >200. Only thirteen journals belong to all three elite groups. These are shown in Table 7.
Table 7 Most influential journals
Journal name IF TC II SI Field(s) 1 Environmental Science & Technology 3.511 16808 0.402 615 ENV 2 Ecology 3.460 20693 0.518 245 EC 3 Journal of Climate 3.105 5221 1.224 201 MET 4 Limnology and Oceanography 2.849 11968 0.314 204 LIM,OCE 5 Earth and Planetary Science Letters 2.815 12419 0.335 278 GEC,GEP
Journal name IF TC II SI Field(s) 6 Geochimica et Cosmochimica Acta 2.666 19798 0.416 214 GEC 7 Journal of Geophysical Research 2.577 70428 0.390 2210 GEO 8 Geophysical Research Letters 2.290 16355 0.357 1114 GEO 9 Environmental Health Perspectives 2.268 7510 0.439 301 ENV
10 Water Resources Research 2.107 11539 0.169 319 ENV,LIM, WAT 11 Journal of the Atmospheric Sciences 2.099 11675 0.601 228 MET
12 Geology 2.069 8993 0.335 310 GEL 13 Marine Ecology-Progress series 2.038 11932 0.218 376 EC
The journals listed in Table 8 are known to enjoy a high reputation in the geosciences research commu-nity. Although the thirteen journals account for only 2.1% of all geosciences journals, they did receive 225,339 citations, accounting for 26.7% of total cita-tions. Together they published 6,615 source items,
accounting for 13.6% of all source items published in geosciences journals. Journals in table 8 include most high-ranking TC and SI journals. It is, however, in-teresting to note that of the thirteen journals with IF > 3.5 (shown in Table 8), the top twelve are not in-cluded in Table 7.
Table 8 Journals with IF>3.50
Journal name IF TC II SI
1 Chemistry and Physics of Carbon 8.667 262 0 0 2 Trends in Ecology & Evolution 7.911 4714 1.739 69 3 Advances in Ecological Research 6.400 965 0 0 4 Annual Review of Earth and Planetary Sciences 5.500 1324 0.944 18 5 Review of Geophysics 5.000 3069 1.071 14 6 Annual Review of Ecology and Systematics 4.822 5061 0.45 20 7 Global Biogeochemical cycles 4.204 2082 0.72 50 8 Ecological Monographs 3.956 4229 0.458 24 9 Reviews in Mineralogy 3.925 1534 0 26 10 Bulletin of the American Meteorological Society 3.839 2916 0.611 72 11 Meteoritics & Planetary Science 3.698 713 0.602 123 12 Earth-Science Reviews 3.600 727 0.071 14 13 Environmental Science & Technology 3.511 16808 0.402 615
This list of high impact journals consists mainly of review journals or journals publishing a relatively low number of journals. The total number of cita-tions received by the first twelve journals is 27,546, which only accounts for 2.0% of all citations
re-6. DISCUSSION AND CONCLUSION
Although the analyzed data constitute only a ‘snapshot’ because they refer to one year, at least the following tentative conclusions can be drawn.
impact factor, the total number of citations, the num-ber of source items, and the average immediacy in-dex all have smaller values than the corresponding indicators of all 5,467 journals indexed by ISI. This is probably due to the influence of many biochemis-try and cell biology journals with relatively high im-pact factor (Institute for Scientific Information, 1999).
This study confirms the well-known fact that in journal and research evaluation it is very important to make comparisons within the same field. Also, only using the impact factor to evaluate journals and/or research is a biased procedure, which is, however, often used by Chinese policy makers (Ren et al., 2000). A journal must be gauged on more than one indicator (Russell & Rousseau, 2002).
In a number of appendices we made some techni-cal remarks about how to complement and amelio-rate SCI data.
REFERENCE
Brookes, B.C. (1970). The growth, utility, and obso-lescence of specific periodical literature. Journal
of Documentation, 26, 283-294.
Brookes, B.C. (1971). Optimum P% library of scien-tific periodicals. Nature, 232, 458-461.
Carlson, J.M. and Doyle, J. (1999). Highly optimized tolerance: a mechanism for power laws in de-signed systems. Physical Review E, 60, 1412-1427. Egghe, L. and Rousseau, R. (1990). Introduction to
Informetrics. Amsterdam: Elsevier.
Egghe, L. and Rousseau, R. (1996). Average and global impact of a set of journals. Scientometrics, 36(1), 97-107.
Egghe, L. and Rousseau, R. (1996). Averaging and globalizing quotients of informetric and scien-tometric data. Journal of Information Science, 22(3), 165-170.
Egghe, L. and Rousseau, R. (2001). Symmetric and asymmetric theory of relative concentration and applications. Scientometrics, 52(2), 261-290. Frohlich, C. and Resler, L. (2001). Analysis of
publi-cations and citations from a geophysics research institute. Journal of the American Society for
In-formation Science and Technology, 52, 701-713.
Ingwersen, P., Larsen, B., Rousseau, R. and Russell, J. (2001). The publication-citation matrix and its derived quantities. Chinese Science Bulletin. 46(6), 524-528. Chinese version: Kexue Tongbao, 2001, 46(8), 700-704.
Katz, J.S. (1999). The self-similar science system.
Research Policy, 25, 501-517.
Moed, H.F. and Van Leeuwen, Th. N. (1995). Im-proving the accuracy of Institute for Scientific In-formation’s journal impact factors. Journal of the
American Society for Information Science, 46,
461-467.
National Natural Science Foundation of China (1999). Guide to programs. Beijing: Military
Medical Science Press, pp. 66-79.
Nijssen, D., Rousseau, R. and Van Hecke, P. (1998). The Lorenz curve: a graphical representation of evenness. Coenoses, 13(1), 33-38.
Ren, S.L., Wang, B.Q., Guo, Z.M., and Ding, L.G. (2000). The journal impact factor should be used cautiously in research evaluation. Chinese Science
Bulletin, 45(2), 218-222 (in Chinese).
Rousseau, R. (1988). Citation distribution of pure mathematics journals. In: Informetrics 87/88 (L. Egghe & R. Rousseau, eds.). Amsterdam: Elsevier, p. 249-262.
Rousseau, R. (1997). Citations: an exploratory study. Cybermetrics,
http://www.cindoc.csic.es/cybermetrics/articles/v1 i1p1.html
Rousseau, R. (2000) Concentration and evenness measures as macro-level scientometric indicators. Shanghai symposium (to appear).
Rousseau, R. and Van Hooydonk, G. (1996). Journal production and journal impact factors. Journal of
the American Society of Information Science,
47(10), 775-780.
Seglen, P. (1997) Why the impact factor of journals should not be used for evaluating research. British
Medical Journal, 314, 497-
Spinak, E. (1996). Diccionario enciclopédico de bib-liometría e informetría. UNESCO: Venezuela. Van Hooydonk, G., Gevaert, R., Milis-Proost, G.,
A bibliotheconomic analysis of the impact factors of scientific disciplines. Scientometrics, 30, 65-81. Xu, W. (1988). Bibliometrics and scientometrics.
Journal of the China Society for Scientific and Technical Information, 7, 294-302 (in Chinese).
Yue, Weiping and Wilson, C. (2001). The relation-ship of two derived measures: impact factor and immediacy index. In: Proceedings of the 8th Inter-national Conference on Scientometrics & Infor-metrics (Davis & Wilson, eds.). Sydney: UNSW,
893-896.
Appendix A: Inequality results
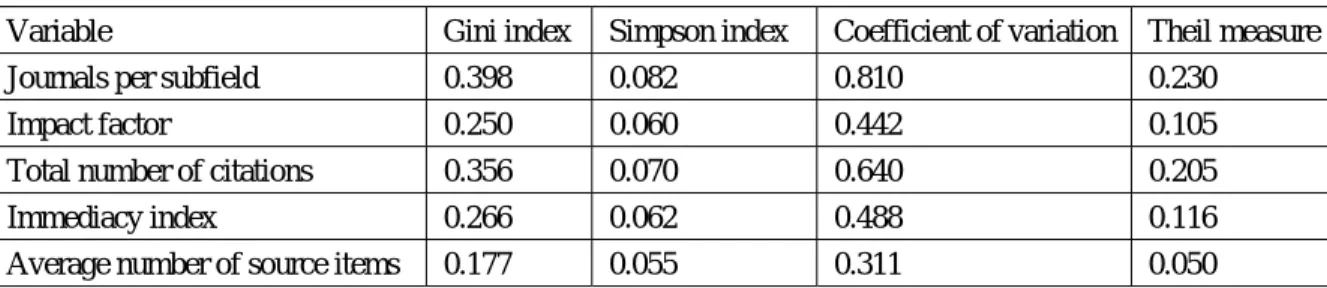
Inequality can be measured using different ine-quality or concentration measures. Among the most-used ones we have: the Gini index, Simp-son’s index, the coefficient of variation and the Theil measure. For definitions and details about their calculation we refer to (Egghe & Rousseau, 1990, 2001; Rousseau, 2000). We calculated these measures for the twenty subfields as presented in Table 1. Results are given in Table 9.
Table 9 Concentration indics
Variable Gini index Simpson index Coefficient of variation Theil measure Journals per subfield 0.398 0.082 0.810 0.230
Impact factor 0.250 0.060 0.442 0.105 Total number of citations 0.356 0.070 0.640 0.205 Immediacy index 0.266 0.062 0.488 0.116 Average number of source items 0.177 0.055 0.311 0.050
This leads to the following inequality ranking: Number of journals – total number of citations – immediacy index – impact factor – average number of source items.
Appendix B
The global (category) impact factor versus the average (category) impact factor
The global two-year synchronous impact factor of a journal category is defined as the total number of citations received by articles published in journals belonging to a category divided by the number of publications. In the case of a synchronous impact factor (for the year Y) citations (received in the year Y) refer to articles published one or two years before the year Y (hence in the years Y-1 and Y-2), while the number of publications is put equal to the total number of articles published in these journals during the years Y-1 and Y-2.
If all journals would publish the same amount of articles the global impact factor would be equal to
the average one. Yet, investigations by Van Hooy-donk, Egghe and Rousseau (Van Hooydonk et al.,1994; Rousseau and Van Hooydonk, 1996; Egghe and Rousseau, 1996a,b) have clearly shown that in most fields the most successful journals (in terms of impact factors) publish the most articles. This gen-eral statement is even true (but less dramatically) when review journals are included. It seems that mathematics is one of the few exceptions to this rule (Rousseau, 1988).
We calculated the global 1998 impact factors for five fields and compared them with the average ones. It is clear that also here the general rule holds: the global impact is larger than the average one, even including review journals (see Table 10). The fact that high impact journals publish (on average) more articles is confirmed by Table 6 and the high correlation between the variables IF and SI.
Table 10 Average versus global impact for some selected fields
Field Average impact factor Real, i.e. global impact factor Agriculture, soil science 0.740 0.826
Mining 0.352 0.645
Paleontology 0.868 0.890
Remote sensing 0.708 0.867 Water resources 0.682 0.934
Appendix C: Note on determining the cited half-life of journals.
Although the cited half-life is one of the indicators provided in the JCR, we did not comment on it. The reason is that many journals have a cited half-life larger than ten years. In that case the JCR simply puts “ > 10” and no more detail is provided. There exist, however, methods to estimate the cited half-life. The simplest one is the one proposed by Brookes (1970, 1971) (see also Egghe & Rousseau (1990) for a description and some examples). More sophisticated methods are proposed and studied by Frohlich and Resler (2001).
It is, of course, always possible to obtain exact values from one of the institutes specializing in sci-entometric research, such as CWTS (Leiden, the Netherlands).
Appendix D
The quality and usefulness (e.g. for a particular library) of a journal is a multi-dimensional notion. The ISI-impact factor is just one aspect. Using a journal’s impact to evaluate articles (and hence scientists or groups of scientists) is known to be flawed (Seglen, 1997). Because of the skewness of this kind of data there are much more articles with a citation score under the average (the impact factor) than above it. This is shown in the following hypothetical example. Hypothetical example Article 1 10 Article 2 8 Article 3 5 Article 4 3 Article 5 2 Article 6 2 Articles 7 to 10 1 Articles 11 to 20 0 Average number of citations: 1.7