行政院國家科學委員會專題研究計畫 成果報告
子計畫三:MPEG 多媒體傳輸機制及通訊協定在嵌入式行動平
台上的分析設計(II)
計畫類別: 整合型計畫 計畫編號: NSC93-2219-E-009-019- 執行期間: 93 年 08 月 01 日至 94 年 07 月 31 日 執行單位: 國立交通大學資訊工程學系(所) 計畫主持人: 蔡淳仁 計畫參與人員: 蔡淳仁,何健鵬,張文潔,王志鵬,林君玲 報告類型: 完整報告 報告附件: 出席國際會議研究心得報告及發表論文 處理方式: 本計畫可公開查詢中 華 民 國 94 年 10 月 31 日
行政院國家科學委員會專題研究計畫成果報告
MPEG 多媒體傳輸機制及通訊協定
在嵌入式行動平台上的分析設計
Design and Analysis of MPEG Multimedia Transport
Mechanisms and Protocols for Embedded and Mobile
Environment
計畫編號:NSC 93-2219-E-009-019
執行期限:93 年 8 月 1 日至 94 年 7 月 31 日
主持人:蔡淳仁
國立交通大學資訊工程系
參與人員:何健鵬、張文潔、王志鵬、林君玲
國立交通大學資訊工程系
一、中文摘要 本子計畫除了延續第一年的工作,協 助 MPEG 標準制定(Test Bed for MPEG-21 Resource Delivery 已 正 式 成 為 國 際 標 準 ISO/IEC TR 21000-12),我們也根據這個 test bed 的架構,進行了兩個新的研究方 向。首先是設計了一套 streaming 的流量 及容錯控制機制,能夠把傳輸頻寬和封包 丟失的影響考量在系統中,以到碼率最佳 化(Rate-Distortion Optimized)的串流傳輸 效果。 另一個研究的方向則是設計了以小波 轉換(wavelet transform)為基礎之 scalable video codec 的流量控制機制。這部份的研 究主要是在給定頻寬要求的前題下達到碼 率失真最佳化的位元流(bitstream)切割,以 供後端的串流傳輸系統進行封包包裝及傳 輸的工作。而這邊所設計出來的流量控制 (rate control)機制和其它系統的主要改進在 於 我 們 加 入 了 multiple adaptation 的 考 量,這對未來嵌入式行動多媒體系統(如 P2P 多媒體傳輸)的應用將有十分大的幫 助。 關鍵詞:MPEG-4、MPEG-21、多媒體串流 傳輸、數位內容傳輸、流量控制、嵌入式 多媒體系統、碼率失真最佳化、可調式視 訊壓縮。 Abstract Oureffortforthisyear’sprojectfollows the first year’s goal to complete the standardization of our MPEG multimedia test bed. The work item has now become an International Standard (IS), ISO/IEC TR 21000-12: Test Bed for MPEG-21 Resource Delivery. For this year, we have designed two new research directions. First, we designed a streaming joint flow and error control mechanism. The proposed architecture are able to take into account both the bandwidth variation and the packet loss rate for arate-distortion optimized (RDO)
packetization and forward error correction (FEC) decision.
Another research direction is to design a multiple-adaptation capable scalable video flow control mechanism for wavelet-based scalable video codecs. This key to our research here is to achieve RD optimal bitstream adaptation for each of the multiple adaptations. The feature is crucial for future embedded multimedia applications (such as for peer-to-peer communications).
Keywords: MPEG-4, MPEG-21, multimedia
streaming, digital content transport, flow control, embedded multimedia systems rate-distortion optimization, scalable video coding.
二、緣由與目的 一個完整的分散式數位多媒體系統含 蓋的範圍極廣,包括數位內容的製作、數 位資料庫的建立、使用者收費機制、智財 權保護機制、媒體傳輸伺服器、應用服務 介面,和媒體接收播放器的設計等等.為 了能有一個統一的國際標準能達到建構互 通的分散式多媒體系統的目的,MPEG 國 際標準組織在西元 2001 年開始製訂一個新 的國際標準:MPEG-21。 由於整個系統的重點在於能橫跨不同 的 網 路 架 構 和 在 不 同 的 客 戶 端 設 備 上 (PC、手機、PDA 等等)提供一致而且最 高品質的多媒體傳輸播放服務,因此傳輸 系統的設計必須能動態的根據不同的平台 調整。簡言之,一個數位多媒體傳輸系統 的架構必需包含流量控制和容錯機制。另 外,依據客戶端的能力來調整媒體資料流 品質的能力也是十分重要的。 為了在頻寬和封包漏失率隨時在改變 的環境下給使用者最好的串流傳輸品質, 許多人嘗試對傳輸的資料進行碼率失真最 佳化(Rate-Distortion)分析,然後根據分析 結果來傳輸視訊串流。過去所提出的碼率 失真最佳化的網路傳輸的流量控制機制裏 ([2] [3] [4] [5] ),最大的問題在於封包漏失 所造成的失真(distortion)沒有辦法量化。 許多現有系統的做法在封包漏失所造成的 失真的估測都十分不切實際(或完全忽略 了)。我們在本年度的研究中提出了一個 十分有創見的方法,可以合理的把封包失 真量化。 要達到碼率失真最佳化的網路串流傳 輸,除了要根據網路頻寬和封包漏失率來 估測出最好的串流資料量,還必須能在算 出的串流資料量限制下,從 scalable video 的位元流中,抽出最好的子位元流。所以 我們針對這方面的需求,設計出了一個快 速 收 斂 的 小 波 轉 換 視 訊 壓 縮 法 (wavelet video coding)的流量控制機制,另外,更進 一步設計了可以有效進行多次碼率最佳化 的子位元流抽取的機制。 我們所設計出的碼率最佳化串流傳輸 機制,也在總計畫為 MPEG 所設計出的多 媒體傳輸共通測試平台上實作測試。目前 此平台已經成為 MPEG 國際標準[1] 。在 這個整合計畫下,總計畫團隊為 MPEG 所 設計的開放原始碼包含了完整的可調式媒 體伺服器、網路摸擬器、及媒體播放器。 詳細的架構請參考[1]。 三、結果與討論 本 計 畫 主 要 的 重 點 在 於 設 計 以 MPEG 技術為主的多媒體串流傳輸統。在 流量控制和容錯機制的設計方面,我們進 行 了 碼 率 失 真 最 佳 化 ( rate-distortion optimized)可調式串流傳輸機制的設計。 目前在這方面較知名的是由 P. A. Chou 等人發展的系統[2]。不過這套方法目前發 表的成果以理論分析為主,在實作上有很 多細節並沒有提出解決方案,而且在頻寬 變化大的網路環境下,串流傳輸最難達到 的平滑播放要求也沒有考量。而且這個系 統有兩大缺點。首先是 Chou 使用封包漏失 率來代表碼率失真最佳化分析中的失真。 這是很不實際的做法。其次,他用來降低 失真的方法則是預先重傳封包(非 ARQ), 這也是很沒有效率的。 在可調式位元串流傳輸中,影像資料 可以分成好幾次傳送,每次的傳送都可以 幫助解碼端得到更接近於原影像資料的重 建 訊 號 , 因 此 可 調 式 位 元 串 流 的 調 適 (scalable bitstream adaptation) 設計必須考 慮到如下幾點:必須支援多樣化的更新運 作(update operations)以產生有效可解碼的 串流、將資料刪除時不能違反解碼相關性 (decoding dependencies)的原則、允許在各 個次元(dimensions)的可調性、對於媒體的 特性 (如:碼率、失真率、frame rate、frame size…等)必須提供所有可能的可調適性、 針對不同的調適單元(adaptation units)可能 必須設計不同的調適決策、對於網路服務 品質(quality of service , QoS) 設計所有可 能的調適方法。媒體資源的傳遞和調適在 可調適的地點 (location of adaptation) 我 們 可 以 分 成 : 傳 送 端 驅 動 調 適 (sender-driven adaptation)、接收端驅動調適 (receiver-driven adaptation)、網路驅動調適 (network-driven adaptation)等三個不同的類 別來考量。
在本計畫的碼率失真最佳化串流傳輸 系統中,我們把封包漏失所造成的失真, 轉化為不同程度的 FEC 保護所造成的失
真。舉例而言, 10-3 的封包漏失率造成的
失 真 , 就 相 當 於 10-3 的 FEC 的 error
protection 導致 data rate 降低所造成的失 真。整個系統可以分成兩大部份:
1. 媒體封包相依性控制:媒體封包相依控 制 (packet dependency control) 的設計 目標是針對提供較高的錯誤抵抗能力 (higher error-resilience) 和消除影像封 包的重傳 (retransmission) 需求。典型 的多媒體串流在影像封包之間具有強 烈的相依關係,如果其中一個影像封包 在傳送過程中丟失,則與這個封包有相 依關係且跟隨在後的 frames 在解碼時 將可能會受到影響。網路調適性的媒體 封包相依控制模組可以用來改善可調 式多媒體串流的錯誤抵抗能力和減少 延遲 (latency),在此,可以運用一個樹 狀 的 模 型 來 記 錄 通 道 的 封 包 丟 失 率 (channel loss rate) 和錯誤傳遞 (error propagation)以達成有效的控制機制。 2. 碼率失真最佳化傳輸控制:一個多媒體
封包傳送的率碼失真最佳化控制架構 必需在資料單元群組之間利用碼率及 失真的 Lagrangian cost function 來算出 最小值的解來有效率的分配時間和頻 寬的網路資源。在率碼失真最佳化控制 的多媒體串流系統中,決定每一個封包 的 interleaving FEC 的保護程度。而這 個 程 度 則 是 依 據 此 一 封 包 的 截 止 期 限、傳送過程的歷史記錄、通道的統計 資料、回饋的資訊、封包間的相依性、 以及這段資料本身的 source coding 的 碼率失真分析來一起進行評估。 關於這個碼率失真最佳化傳輸系統的詳細 描述請參照附錄。 在快速收斂的小波轉換視訊壓縮法的 流量控制機制方面,有別於一般系統慣用 的查表法,我們採用的技巧是設計了一個 更有效的雙參數視訊資料 R-D model 來進 更最佳的子位元流切割點的快速搜尋。也 因 為 我 們 所 提 出 的 視 訊 視 訊 資 料 R-D model 更精簡也更有效率,我們可以把它隨 著抽取出的位元流一起傳輸到接收端以進 行再一次的碼率失真最佳化子位元流切 割。 四、計劃成果自評 本計畫研究內容與原計畫相當符合。 在達成預期目標情況方面有以下數點: 1. 完成碼率失真最佳化串流傳輸系統的 開 發 , 並 將 其 整 合 到 總 計 畫 團 隊 為 MPEG 開發的所設計出的多媒體傳輸 共通測試平台上。 2. 完成小波轉換視訊壓縮法的可進行多 次碼率失真最佳化切割的流量控制機 制設計。這部份的設計特別適合異質性 點對點(p2p),如從桌上電腦傳到 PDA 再傳到手機的串流傳輸。 另外,本年度計畫有待完成的部份有以下 數點: 1. 未 能 把 小 波 轉 換 視 訊 壓 縮 法 移 植 到 MPEG 多媒體傳輸共通測試平台上。 2. 設計出來的小波轉換視訊流量控制機 制未能整合到上述平台。並提供異質性 點對點串流傳輸的應用示範。 以上事項預期會在第三年進行。 本年度本計畫共有一個博士生,三個碩士 生參與。
附錄:A Rate-Distortion Optimized Video
Streaming System with Adaptive
Interleaved Forward Error Correction 1. Introduction
Multimedia streaming over IP networks is a very important trend for future communication and entertainment systems [3] . Existing IP networks adopt a best-effort approach for data delivery. As a result, bandwidth variation and/or packet losses are two common issues a multimedia streaming system must deal with in order to maintain smooth presentation with quality as constant as possible.
In order to allow smooth streaming of video data over variable bandwidth networks, scalable video coding techniques such as FGS or wavelet-based schemes are often
used [4] , [5] . With scalable video contents, a variable bitrate (VBR) source bitstream can be composed on the fly to match the channel bandwidth (assuming the bandwidth can be predicted via some model) and smoothly transmitted to the receivers for presentation. However, the video quality of the composed stream usually varies too much that it becomes visually unpleasant.
Another source of visual degradation comes from packet losses [6] , [7] . Unlike distortion from source coding, distortion due to channel loss is more difficult to quantify since the value of a single missing packet depends on the coded data it contains. Nevertheless, in order to design an R-D optimized streaming system that produces smooth and near-constant quality streams, one must find a way to formulate the distortion and rate impact of packet losses.
For scalable streaming systems, a bitstream are usually divided into base layer and enhancement layer. Base layer bitstreams contains essential information and should be protected as much as possible. In addition, the level of protection (on the texture bits) should be based on the importance of the data. To facilitate the design of the proposed R-D optimized packetization algorithm, a constant-quality rate control for the base-layer [8] , [9] is used. The encoded base layer bitstream is then protected by an adaptive FEC scheme with data-interleaving and Reed-Solomon coding.
An R-D optimized streaming
framework was proposed by Chou and Miao [2] . In this scheme, the system is based on the importance and error probabilities of data units to compute transmission policies. The policy indicates whether the video packet should be transmitted at each transmission opportunity. However, the scheme does not address the issue of reducing video quality variation over loss channels. Furthermore, the mechanism maps (probability of) packet losses into rate increment of redundant packet transmission. This approach makes the resulting R-D curve impractical.
In this paper, a framework of R-D optimized video streaming is proposed. The main features of the proposed system are highlighted as follows:
•The streaming algorithm searches along the R-D curve for an optimal operating point between the scalable source coding rate and the base-layer FEC protection level. The impact of packet losses is absorbed by the level of FEC protection.
•Both video playback smoothness and visual quality consistency constraints are elegantly incorporated into the R-D optimization framework.
The rest of this paper is organized as follows. Section II presents the constant quality rate control algorithm used for the base-layer bitstream. The detail of the FEC technique used in the proposed system is described in section III. The proposed R-D optimized streaming algorithm is presented in section IV. Some experimental results and compares the proposed system with an FGS streaming system is shown in Section V. Finally, some conclusions and discussions are given in Section VI.
2. Constatnt Quality Rate Control Scheme for the Base Layer
Video bitstreams are typically encoded at a predetermined bitrate for a particular application. When the network bandwidth fluctuates, the coded bitrate may not match the real bandwidth [10] . Hence, scalable video coding techniques are often used to provide real-time quality adaptation for a streaming system. In our proposed system, data-interleaving and FEC are used to cancel the uncertainty of packet losses for R-D curve formulation. To simplify the R-D curve calculation, each texture bit should be of equal importance. Therefore, a constant quality video coding mechanism [9] is adopted in our framework for base layer encoding.
The constant-quality base layer coding scheme proposed in [9] is described as
follows. In this scheme, an initial
quantization parameter is selected for the first intra encoded frame. Then, the quality of the first intra encoded frame is used for the constant-quality rate control mechanism for all base-layer frames. In practice, the quality is measured by either peak signal-to-noise ratio (PSNR) or mean square error (MSE). Under the target PSNR constraint, a
constant-quality iterative coding algorithm is designed to select proper quantization parameters to minimize the video quality variation. The scheme is composed of two stages:
• Initialization stage:
For the first intra encoded frame I-VOP of the base layer, the approach is to encode the frame using a given initial quantization parameter Q0. The peak
signal-to-noise ratio (PSNR) value of this frame is calculated using the luma
channel of the YUV signal. I is the image of the source sequence and I‘is the corresponding image at the encoder output, with pixel indices1xM
and1yN. The PSNR is given by
, , . 1 255 log 10 1 1 2 ' 2 10 M x N y Ixy I xy MN PSNR (1)
Based on this formulation, the initial video quality of the first frame can be calculated and denoted by PQ0. The PQ0
is regarded as the constant-quality rate-control factor for the succeeding frames of the video sequence.
• Iterative coding stage:
1. Specify a convergence condition to control quality variation within a given range.
2. Set the starting quantization parameter value of the second frame 2
0
QP using
the first initial encoded frame Q0, and
the target constant-quality factor using the PSNR of the first frame PQ0.
3. Encode the frame k with k i QP .
4. Calculate the ith iteration k i PSNR , and the PSNR differencePSNR is equal to PQ0 minus k i PSNR . 5. Check (PSNR0) k i QP = QPik -1. Otherwise k i QP = QPik+1. 6. If k i
QP has been calculated previously,
then select the minimal PSNR between k
i
QP1 andQPik2, go to Step 8.
7. When the convergence condition is satisfied, then, go to Step 8. Otherwise, set the iteration index i=i+1 and go back to Step 2.
8. Update the reference frame using the reconstructed VOPk for the next motion compensation operations.
9. Set the frame index k=k+1, the iteration index i=0, and QPk
0 = 1 k i QP , go back to Step 2.
3. Error Control and Packetization for base layer
The base-layer bitstream of a scalable sequence contains the most essential video content. When the base-layer bitstream cannot be recovered from transmission errors, the corresponding enhancement layer is useless even if they arrive at the client side successfully [11] , [12] . Consequently, the base-layer should be strongly protected against packet loss or corruption [13] . Furthermore, a base layer bitstream free from packet losses (through FEC protection) makes R-D calculation deterministic and therefore an R-D optimal streaming system can be practically constructed.
Forward error correction (FEC) is an important low-delay mechanism for reducing or eliminating packet losses [14] in a streaming system. This section presents the FEC technique used in the proposed
framework. The FEC combines
data-interleaving and Reed-Solomon (RS) coding.
For base-layer data, a (n, k)
Reed-Solomon code-based FEC is applied to add resiliency to the original bitstream. In Fig. 1 (a), n is the codeword length of the Reed-Solomon encoder, k is the number of base-layer bitstream symbols, and s is the number of correctable symbols. The number of parity symbols is 2s, where 2s = n –k. If burst-errors occur during transmission, then the Reed-Solomon decoder can correct up to s errors and detect up to 2s errors per codeword. When packet loss is detected in the client application, the Reed-Solomon decoder may have sufficient information to allow successful reconstruction of the original video. Data Parity n k 2s Data Parity n k 2s (a) 2s … … : : k … … : : e1 e2 e8 s51s52 s53 s54 p Unit1,1 Unit1,4 RS1,1 RS1,2 b1 b2 b8 s21s22 s23 s24 a1 a2 a8 s11s12 s13 s14 h1 h2 h8 s81s82 s83 s84 d1 d2 d8 s41s42 s43 s44 … … Unit2,1 Unit2,4 RS2,1 RS2,2 2s … … : : k … … : : e1 e2 e8 s51s52 s53 s54 p Unit1,1 Unit1,4 RS1,1 RS1,2 b1 b2 b8 s21s22 s23 s24 a1 a2 a8 s11s12 s13 s14 h1 h2 h8 s81s82 s83 s84 d1 d2 d8 s41s42 s43 s44 … … Unit2,1 Unit2,4 RS2,1 RS2,2 (b)
Fig. 1. (a) A (n, k) Reed Solomon code, and (b) One GOP on the base layer in the pre-interleaving stage. In this example, n=12,
k =8, s =2, p=4, and q=2. Unit12 … Unit14 Unit11 Unit22 Unit24 Unit21 : Unit42 … Unit44 Unit41 : : RS12 RS22 RS11
Packet 1 Packet 2 … Packet 4 video units parity units RS31 RS32 … RS42 Header Header Header Unit12 … Unit14 Unit11 Unit22 Unit24 Unit21 : Unit42 … Unit44 Unit41 : : RS12 RS22 RS11
Packet 1 Packet 2 … Packet 4 video units parity units RS31 RS32 … RS42 Header Header Header
Fig. 2. Packetization scheme for one GOP on the base layer. In this example, n=12, k =8,
s =2, p=4, and q=2.
In [16] , two FEC packetization schemes for single-layer video were proposed.
However, they do not perform
data-interleaving. To reduce packet header overhead while maintain packet loss resiliency, a data-interleaving scheme is used to shuffle the RS coded data among several data packets before transmission. Generally, a high error rates channel can be defined as medium losses (2%–5% packet loss) or heavy losses (5% packet loss) [15] . When base-layer bitstream is transmitted over the high error rates channel, a codeword may contain more than s symbol errors due to packet losses or bit errors. Moreover, the decoding process may fail to recover the bitstream symbols. As shown in Fig. 1 (b), a group of picture (GOP) is split into several groups of equal length, where the length of a group is p symbols. Each interleaved group is composed of q symbols from each codeword. Fig. 2 shows the proposed interleave scheme under a (n, k) Reed-Solomon code. In this case, the Reed-Solomon decoder is able to recover from s / q = 1 loss packets in one group, where the total number of packets for one GOP is (n-2s) / q = 4.
4. Proposed streaming framework
A piecewise-linear model and a piecewise- exponential model can be used for modeling the rate-distortion (R-D) curve of enhancement-layer bitstream [8] , [10] . And the quality variation can be reduced by using
the models in finding an optimal constant quality constrained rate allocation from two neighboring sampling points. But to produce an optimal R-D solution, the increase of computation time is a drawback for real-time applications.
To reduce the computational cost of the rate allocation, each bit plane is treating as a transmission unit in the enhancement layer. In addition, experiments show that the video quality near step-wise increases as the number of decoded bit-planes increases. Hence, a left/right comparison scheme is used to find the number of bit-plane preserved in the enhancement-layer bitstream for minimizing the variation in video quality. The left/right comparison scheme select a
minimum quality variation among
neighboring bit-planes {BP-1, BP} or {BP, BP+1}. The rate allocation aims to allocate bits for smoothing the average video quality at discrete transmission time, subject to an available bit rate constraint. The layer truncation algorithm (ELT) is described below.
• Description of ELT
1. R-D costs of FGS enhancement- layer bitstreams are extracted at the end of each bit-plane. And is stored into a disk file for further analysis.
2. Given an initial protection level p, and a remaining bandwidth is computed as
niw i n n i I p BW i) ( ) ( , where BWi is the available bandwidth of the ith transmitting period, In(p) is the size of the interleaved base-layer bitstream of frame n under FEC by Reed-Solomon coding, and coded using GOP size w .
3. If the value of (i) is negative, then reducing the value of protection level p=p-1, go to Step 2.
4. Given a remaining bandwidth, using the amount of bits generated by each bit-plane to estimate a target PSNR ratio for the first GOP.
5. The left/right comparison scheme is applied to find the number of bit-plane preserved in enhancement layer of frame n
and to smooth out the inter-frame quality variation.
6. Compute the consumed bits of each
bit-plane in the GOP:
niw i n En i i) () ( ) ( , where En() is the size of the preserved
bit-plane of frame n
7. If the remaining bandwidth allowed, then increase the number of bit-planes, and go back to step 4.
8. Selected a GOP in a minimal quality variation based on the average PSNR values of the previous GOP.
9. Assign more protection to the base-layer bitstream when transmission conditions become worse.
10.Process the next GOP until the end of the frame.
5. Experimental Results
This section presents the experimental results of the proposed video streaming system. A block diagram of the proposed streaming system is shown in Fig. 3. The system is based on the MPEG-21 Test Bed for Resource Delivery [17] . The test bed is able to emulate media resource delivery with a network emulator (based on NIST Net [18] ) that allows real-time simulation of common
network conditions. We have added
Reed-Solomon coding modules, an
interleaver module, and a de-interleaver module to the original test bed.
Fig. 3. Architecture of the proposed system
To validate the effectiveness of the R-D optimized video streaming system which we have described in this paper, we use the Akiyo, Coastguard, Foreman, Mobile, and Stefan sequences that are the standard test
sequences of MPEG-4 as our experimental sequences. The parameters are set as follows: The format of those sequences is CIF (352*288). Those sequences are encoded using ISO/IEC 14496 (MPEG-4) visual
reference software
(Microsoft-FDAM1-2.5-040207) at 10 frames per second. The coding mode is one I-frame followed by nine P-frames.
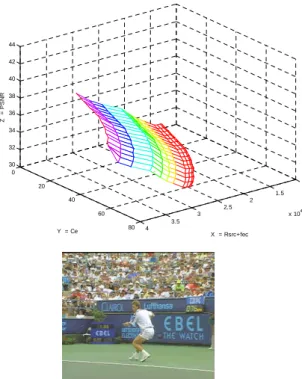
Fig. 4Fig. 5and Fig. 6shows the R-D curves between source rate, expect distortion and the one protected by different RS-level (RS(255,247,9) – RS(255,127, 129))
bitstream in the sequence. Those
experimental results are based on the channel rate 400 kbps, and QP=15. Table 1, Table 2, and Table 3 show the selected frames 31th (I-frame), 32th (P-frame) and 33th (P-frame) frames for presenting the number of average bit error per codeword of the Stefan sequence respectively. Those experimental results are based on the channel rate 300 kbps.
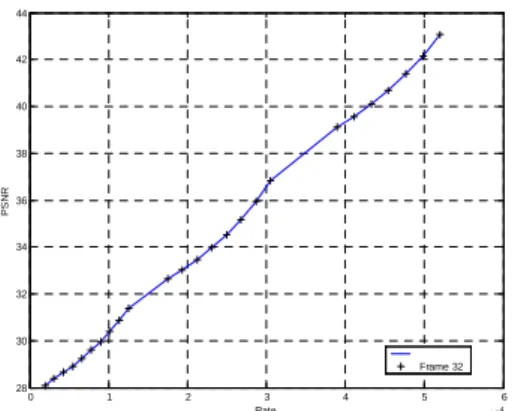
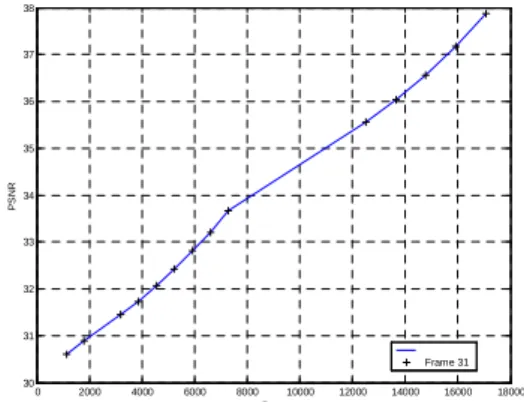
Fig. 7shows the R-D curves between source rates and the expect distortion by adding different enhancement-layer bitstream in the sequence. Fig. 8shows R-D slope between source rates and slope variation in the Mobile sequence. As the figure shows, a slope rating increases slowly at the beginning part of the bit-plane. On the contrary, a slope rating may increase sharply from the middle part to the end part of the bit-plane. Fig. 9and Fig. 10show the system try to include the points on the convex hull. From Fig. 11to Fig. 18 show the experimental results on the 32th and 33th frames in the mobile sequence. From Fig. 19to Fig. 28show the experimental results from the 31th and 33th frames in the stefan sequence.
To investigate the system performance under different traffic loads and different video, Fig. 29 shows the channel condition used in our simulation environment. The first bandwidth plan begins at 50 kbps, increases to 100 kbps at the third second, continuous drops to 38 kbps until 7th second, recovers back to 110 kbps at 8th second, and then increases to 119 kbps. From the second to the fifth bandwidth plan are shown in Fig. 32,
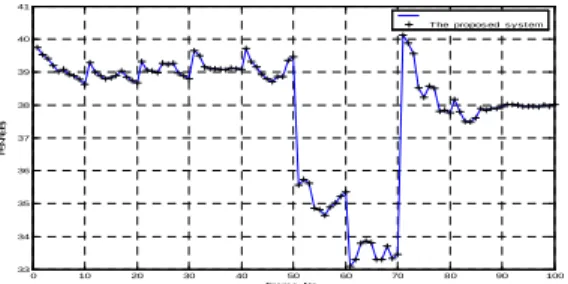
Fig. 35, Fig. 38 and Fig. 41. In addition, Fig. 30, Fig. 33, Fig. 36, Fig. 39 and Fig. 42show PSNR values for the Akiyo, Coastguard, Foreman, Mobile, and Stefan sequences respectively. The streaming algorithm searches along the R-D curve for an optimal operating point between the scalable source coding rate and the base-layer FEC protection level. When the transmission rate fluctuates significantly, e.g., from the 50th to the 70th frame, the proposed system can increase the base-layer FEC protection level, adapt the bandwidth changing quickly and reduce the degree of quality variation. Fig. 31, Fig. 34, Fig. 37, Fig. 40 and Fig. 43show the bit rate variation of the FEC protected base-layer and applying enhancement-layer bitstream under the variable bandwidth condition. For example, when the transmission rate changes from 528kbps to 418kbps, the higher levels of channel protection is applied to the base-layer of Mobile sequence than increases more enhancement-layer(s) bitstream to enhance the base layer, so that most of the enhancement-layer bitstream is truncated during the period.
1 1.5 2 2.5 3 3.5 4 x 10⁴ 0 20 40 60 80 30 32 34 36 38 40 42 44 X = Rsrc+fec Y = Ce Z = P S N R
Fig. 4. R-D curves between source rate, expect distortion and the one protected by different RS-level (RS(255,247,9) –RS(255,127, 129)) bitstream in the
1 1.5 2 2.5 3 3.5 4 x 10⁴ 0 20 40 60 80 30 32 34 36 38 40 42 44 X = Rsrc+fec Y = Ce Z = P S N R
Fig. 5. R-D curves between source rate, expect distortion and the one protected by different RS-level (RS(255,247,9) –RS(255,127, 129)) bitstream in the
Stefan sequence. (32th frame, P-frame)
1 1.5 2 2.5 3 3.5 4 x 10⁴ 0 20 40 60 80 30 32 34 36 38 40 42 44 X = Rsrc+fec Y = Ce Z = P S N R
Fig. 6. R-D curves between source rate, expect distortion and the one protected by different RS-level (RS(255,247,9) –RS(255,127, 129)) bitstream in the
Stefan sequence. (33th frame, P-frame)
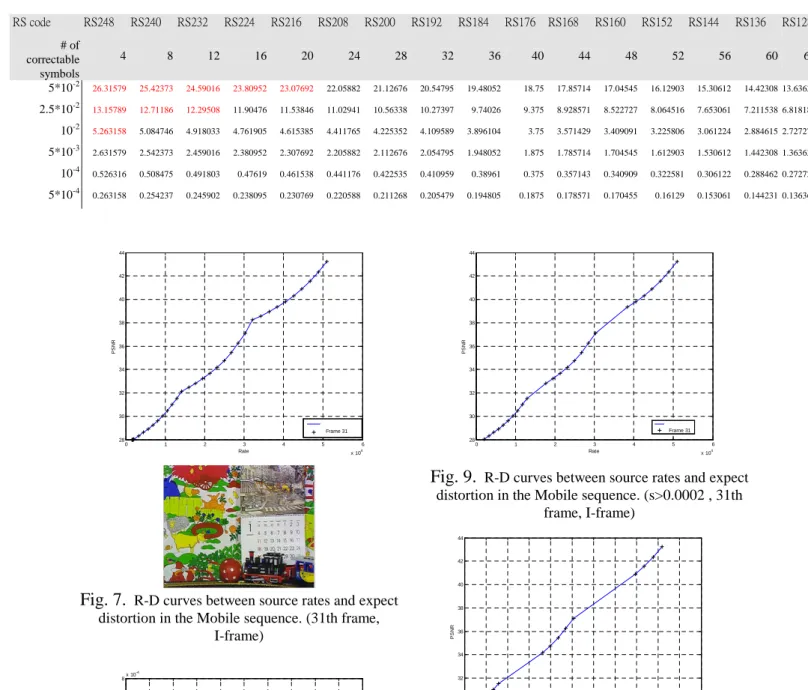
Table 1. The number of average bit error per codeword for 31th frame (I-frame) on the base layer (Stefan
sequence) RS code RS248 RS240 RS232 RS224 RS216 RS208 RS200 RS192 RS184 RS176 RS168 RS160 RS152 RS144 RS136 RS128 # of correctable symbols 4 8 12 16 20 24 28 32 36 40 44 48 52 56 60 64 5*10-2 35.71429 34.88372 33.33333 32.6087 31.25 30 28.84615 27.77778 26.78571 25.42373 24.19355 23.07692 22.05882 20.83333 19.73684 18.51852 2.5*10-2 17.85714 17.44186 16.66667 16.30435 15.625 15 14.42308 13.88889 13.39286 12.71186 12.09677 11.53846 11.02941 10.41667 9.868421 9.259259 10-2 7.142857 6.976744 6.666667 6.521739 6.25 6 5.769231 5.555556 5.357143 5.084746 4.83871 4.615385 4.411765 4.166667 3.947368 3.703704 5*10-3 3.571429 3.488372 3.333333 3.26087 3.125 3 2.884615 2.777778 2.678571 2.542373 2.419355 2.307692 2.205882 2.083333 1.973684 1.851852 10-4 0.714286 0.697674 0.666667 0.652174 0.625 0.6 0.576923 0.555556 0.535714 0.508475 0.483871 0.461538 0.441176 0.416667 0.394737 0.37037 5*10-4 0.357143 0.348837 0.333333 0.326087 0.3125 0.3 0.288462 0.277778 0.267857 0.254237 0.241935 0.230769 0.220588 0.208333 0.197368 0.185185
Table 2. The number of average bit error per codeword for 32th frame (P-frame) on the base layer (Stefan
sequence) RS code RS248 RS240 RS232 RS224 RS216 RS208 RS200 RS192 RS184 RS176 RS168 RS160 RS152 RS144 RS136 RS128 # of correctable symbols 4 8 12 16 20 24 28 32 36 40 44 48 52 56 60 64 5*10-2 28.84615 27.77778 26.78571 25.86207 25 24.19355 23.4375 22.38806 21.42857 20.54795 19.48052 18.75 17.64706 16.85393 15.95745 15 2.5*10-2 14.42308 13.88889 13.39286 12.93103 12.5 12.09677 11.71875 11.19403 10.71429 10.27397 9.74026 9.375 8.823529 8.426966 7.978723 7.5 10-2 5.769231 5.555556 5.357143 5.172414 5 4.83871 4.6875 4.477612 4.285714 4.109589 3.896104 3.75 3.529412 3.370787 3.191489 3 5*10-3 2.884615 2.777778 2.678571 2.586207 2.5 2.419355 2.34375 2.238806 2.142857 2.054795 1.948052 1.875 1.764706 1.685393 1.595745 1.5 10-4 0.576923 0.555556 0.535714 0.517241 0.5 0.483871 0.46875 0.447761 0.428571 0.410959 0.38961 0.375 0.352941 0.337079 0.319149 0.3 5*10-4 0.288462 0.277778 0.267857 0.258621 0.25 0.241935 0.234375 0.223881 0.214286 0.205479 0.194805 0.1875 0.176471 0.168539 0.159574 0.15
Table 3. The number of average bit error per codeword for 33th frame (P-frame) on the base layer (Stefan sequence) RS code RS248 RS240 RS232 RS224 RS216 RS208 RS200 RS192 RS184 RS176 RS168 RS160 RS152 RS144 RS136 RS128 # of correctable symbols 4 8 12 16 20 24 28 32 36 40 44 48 52 56 60 64 5*10-2 26.31579 25.42373 24.59016 23.80952 23.07692 22.05882 21.12676 20.54795 19.48052 18.75 17.85714 17.04545 16.12903 15.30612 14.42308 13.63636 2.5*10-2 13.15789 12.71186 12.29508 11.90476 11.53846 11.02941 10.56338 10.27397 9.74026 9.375 8.928571 8.522727 8.064516 7.653061 7.211538 6.818182 10-2 5.263158 5.084746 4.918033 4.761905 4.615385 4.411765 4.225352 4.109589 3.896104 3.75 3.571429 3.409091 3.225806 3.061224 2.884615 2.727273 5*10-3 2.631579 2.542373 2.459016 2.380952 2.307692 2.205882 2.112676 2.054795 1.948052 1.875 1.785714 1.704545 1.612903 1.530612 1.442308 1.363636 10-4 0.526316 0.508475 0.491803 0.47619 0.461538 0.441176 0.422535 0.410959 0.38961 0.375 0.357143 0.340909 0.322581 0.306122 0.288462 0.272727 5*10-4 0.263158 0.254237 0.245902 0.238095 0.230769 0.220588 0.211268 0.205479 0.194805 0.1875 0.178571 0.170455 0.16129 0.153061 0.144231 0.136364 0 1 2 3 4 5 6 x 10⁴ 28 30 32 34 36 38 40 42 44 Rate P S N R Frame 31
Fig. 7. R-D curves between source rates and expect distortion in the Mobile sequence. (31th frame,
I-frame) 0 0.5 1 1.5 2 2.5 3 3.5 4 4.5 5 x 10⁴ 0 2 4 6 8x 10 -4 Rate S lo p e Frame 30
Fig. 8. R-D slope between source rates and slope variation in the Mobile sequence. (31th frame,
I-frame) 0 1 2 3 4 5 6 x 10⁴ 28 30 32 34 36 38 40 42 44 Rate P S N R Frame 31
Fig. 9. R-D curves between source rates and expect distortion in the Mobile sequence. (s>0.0002 , 31th
frame, I-frame) 0.5 1 1.5 2 2.5 3 3.5 4 4.5 5 5.5 6 x 10⁴ 28 30 32 34 36 38 40 42 44 Rate P S N R Frame 31
Fig. 10. R-D curves between source rates and expect distortion in the Mobile sequence. (s>0.0003 ,
0 0.5 1 1.5 2 2.5 3 3.5 4 4.5 5 x 10⁴ 28 30 32 34 36 38 40 42 44 Rate P S N R Frame 32
Fig. 11. R-D curves between source rates and expect distortion in the Mobile sequence. (32th frame,
P-frame) 0 0.5 1 1.5 2 2.5 3 3.5 4 4.5 5 x 10⁴ 0 2 4 6 8x 10 -4 Rate S lo p e Frame 32
Fig. 12. R-D slope between source rates and slope variation in the Mobile sequence. (32th frame,
P-frame) 0 1 2 3 4 5 6 x 10⁴ 28 30 32 34 36 38 40 42 44 Rate P S N R Frame 32
Fig. 13. R-D curves between source rates and expect distortion in the Mobile sequence. (s>0.0002 ,
32th frame, P-frame) 0.5 1 1.5 2 2.5 3 3.5 4 4.5 5 5.5 6 x 10⁴ 28 30 32 34 36 38 40 42 44 Rate P S N R Frame 32
Fig. 14. R-D curves between source rates and expect distortion in the Mobile sequence. (s>0.0003 ,
32th frame, P-frame) 0 1 2 3 4 5 6 x 10⁴ 28 30 32 34 36 38 40 42 44 Rate P S N R Frame 33
Fig. 15. R-D curves between source rates and expect distortion in the Mobile sequence. (33th frame,
P-frame) 0 0.5 1 1.5 2 2.5 3 3.5 4 4.5 5 x 10⁴ 0 1 2 3 4 5 6 7 8x 10 -4 Rate S lo p e Frame 33
Fig. 16. R-D slope between source rates and slope variation in the Mobile sequence. (33th frame,
0 1 2 3 4 5 6 x 10⁴ 28 30 32 34 36 38 40 42 44 Rate P S N R Frame 33
Fig. 17. R-D curves between source rates and expect distortion in the Mobile sequence. (s>0.0002 ,
33th frame, P-frame) 0.5 1 1.5 2 2.5 3 3.5 4 4.5 5 5.5 x 10⁴ 28 30 32 34 36 38 40 42 44 Rate P S N R Frame 33
Fig. 18. R-D curves between source rates and expect distortion in the Mobile sequence. (s>0.0003 ,
33th frame, P-frame) 0 0.2 0.4 0.6 0.8 1 1.2 1.4 1.6 1.8 2 x 10⁴ 30 31 32 33 34 35 36 37 38 39 Rate P S N R Frame 31
Fig. 19. R-D curves between source rates and expect distortion in the Stefan sequence. (31th frame,
I-frame) 3 3.2 3.4 3.6 3.8 4 4.2 4.4 4.6 4.8 2 4 6 8x 10 -4 Bitplane S lo p e Frame 30
Fig. 20. R-D slope between bit-planes and slope variation in the Stefan sequence. (31th frame, I-frame)
0 2000 4000 6000 8000 10000 12000 14000 16000 18000 30 31 32 33 34 35 36 37 38 Rate P S N R Frame 31
Fig. 21. R-D curves between source rates and expect distortion in the Stefan sequence. (s>0.0003 ,
31th frame, I-frame) 0 2000 4000 6000 8000 10000 12000 14000 16000 18000 30 31 32 33 34 35 36 37 38 Rate P S N R Frame 31
Fig. 22. R-D curves between source rates and expect distortion in the Stefan sequence. (s>0.0004 ,
0 1000 2000 3000 4000 5000 6000 7000 30.5 31 31.5 32 32.5 33 Rate P S N R Frame 32
Fig. 23. R-D curves between source rates and expect distortion in the Stefan sequence. (32th frame,
P-frame) 1000 2000 3000 4000 5000 6000 7000 30.5 31 31.5 32 32.5 33 Rate P S N R Frame 32
Fig. 24. R-D curves between source rates and expect distortion in the Stefan sequence. (s>0.0003 ,
32th frame, P-frame) 1000 2000 3000 4000 5000 6000 7000 30.5 31 31.5 32 32.5 33 Rate P S N R Frame 32
Fig. 25. R-D curves between source rates and expect distortion in the Stefan sequence. (s>0.0004 ,
32th frame, P-frame) 0 2000 4000 6000 8000 10000 12000 14000 16000 18000 30 31 32 33 34 35 36 37 38 Rate P S N R Frame 33
Fig. 26. R-D curves between source rates and expect distortion in the Stefan sequence. (33th frame,
P-frame) 0 2000 4000 6000 8000 10000 12000 14000 16000 18000 30 31 32 33 34 35 36 37 38 Rate P S N R Frame 33
Fig. 27. R-D curves between source rates and expect distortion in the Stefan sequence. (s>0.0003 ,
33th frame, P-frame) 0 2000 4000 6000 8000 10000 12000 14000 16000 18000 30 31 32 33 34 35 36 37 38 Rate P S N R Frame 33
Fig. 28. R-D curves between source rates and expect distortion in the Stefan sequence. (s>0.0004 ,
1 2 3 4 5 6 7 8 9 10 3 4 5 6 7 8 9 10 11 12x 10 4 sec. B a n d w id th (b p s ) Bandwidth Plan
Fig. 29. Dynamic channel condition illustrating available bandwidth for Akiyo sequence.
0 10 20 30 40 50 60 70 80 90 100 35 35.5 36 36.5 37 37.5 38 38.5 Frame No. P S N R (d B )
The proposed system
Fig. 30. PSNR performance for Akiyo sequence.
0 10 20 30 40 50 60 70 80 90 100 0 500 1000 1500 2000 2500 3000 3500 4000 4500 Frame No. B it R a te The interleaved BL The proposed system The base layer bitstream
Fig. 31. Bitrates for the base layer bitstream, the FEC-protected base-layer and enhance the perceived quality by applying more enhancement-layer bitstream for Akiyo sequence.
1 2 3 4 5 6 7 8 9 10 1.8 2 2.2 2.4 2.6 2.8 3 3.2 3.4x 10 5 sec. B a n d w id th (b p s ) Bandwidth Plan
Fig. 32. Dynamic channel condition illustrating available bandwidth for Coastguard sequence.
0 10 20 30 40 50 60 70 80 90 100 32 33 34 35 36 37 38 39 40 Frame No. P S N R (d B )
The proposed system
Fig. 33. PSNR performance for Coastguard sequence.
0 10 20 30 40 50 60 70 80 90 100 0 0.5 1 1.5 2 2.5 3 3.5x 10 4 Frame No. B it R a te The interleaved BL The proposed system The base layer bitstream
Fig. 34. Bitrates for the base layer bitstream, the FEC-protected base-layer and enhance the perceived quality by
applying more enhancement-layer bitstream for Coastguard sequence.
1 2 3 4 5 6 7 8 9 10 1 1.5 2 2.5 3 3.5x 10 5 sec. B a n d w id th (b p s ) Bandwidth Plan
Fig. 35. Dynamic channel condition illustrating available bandwidth for Foreman sequence.
0 10 20 30 40 50 60 70 80 90 100 33 34 35 36 37 38 39 40 Frame No. P S N R (d B )
The proposed system
Fig. 36. PSNR performance for Foreman sequence.
0 10 20 30 40 50 60 70 80 90 100 0 0.5 1 1.5 2 2.5 3 3.5 4 4.5 5x 10 4 Frame No. B it R a te The interleaved BL The proposed system The base layer bitstream
Fig. 37. Bitrates for the base layer bitstream, the FEC-protected base-layer and enhance the perceived quality by applying more enhancement-layer bitstream for Foreman sequence.
1 2 3 4 5 6 7 8 9 10 4 4.5 5 5.5 6 6.5x 10 5 sec. B a n d w id th (b p s ) Bandwidth Plan
Fig. 38. Dynamic channel condition illustrating available bandwidth for Mobile sequence.
0 10 20 30 40 50 60 70 80 90 100 31 32 33 34 35 36 37 38 39 Frame No. P S N R (d B )
The proposed system
Fig. 39. PSNR performance for Mobile sequence.
0 10 20 30 40 50 60 70 80 90 100 0 1 2 3 4 5 6x 10 4 Frame No. B it R a te The interleaved BL The proposed system The base layer bitstream
Fig. 40. Bitrates for the base layer bitstream, the FEC-protected base-layer and enhance the perceived quality by applying more enhancement-layer bitstream for Mobile sequence.
1 2 3 4 5 6 7 8 9 10 3 3.2 3.4 3.6 3.8 4 4.2 4.4 4.6 4.8 5x 10 5 sec. B a n d w id th (b p s ) Bandwidth Plan
Fig. 41. Dynamic channel condition illustrating available bandwidth for Stefan sequence.
0 10 20 30 40 50 60 70 80 90 100 37.5 38 38.5 39 39.5 40 40.5 Frame No. P S N R (d B )
The proposed system
0 10 20 30 40 50 60 70 80 90 100 0 0.5 1 1.5 2 2.5 3 3.5 4 4.5x 10 4 Frame No. B it R a te The interleaved BL The proposed system The Base layer
Fig. 43. Bitrates for the base layer bitstream, the FEC-protected base-layer and enhance the perceived quality by applying more enhancement-layer bitstream for Stefan sequence.
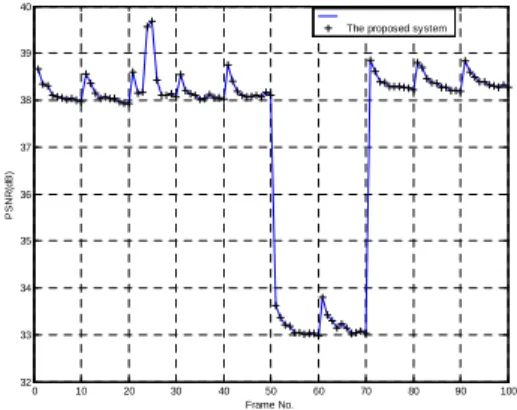
For a full system experiments, we used the CIF version of the FOREMAN sequence is used. The sequence is encoded using ISO/IEC 14496 (MPEG-4) visual reference software (Microsoft-FDAM1-2.5-040207) at 10 frames per second. The coding mode is one I-frame followed by nine P-frames at 10 frames per second. Fig. 44 presents the PSNR performance of the streaming system under a variable bandwidth scenario, ranging
from 68kbps to 240kbps. When the
transmission rate fluctuates significantly, e.g., from the 40th to the 80th frame, the proposed system can adapt the bandwidth changing quickly and reduce the degree of quality variation. Fig. 45 shows the bit rate of the encoded base-layer bitstream, and the bit rate of RS(255, 251, 5)/RS(255, 223, 33) protection level bitstream. Fig. 46 shows the bit rate variation of the FEC protected base-layer and enhancement-layer bitstream under the variable bandwidth condition. For example, when the transmission rate changes from 180kbps to 116kbps, the system performs dynamic rate allocation to add more
FEC protection on the base-layer.
Consequently, most of the enhancement-layer bitstream is truncated during the period.
0 10 20 30 40 50 60 70 80 90 100 33 34 35 36 37 38 39 40 41 Frame No. P S N R (d B ) The propos ed s y s t em
Fig. 44. PSNR under variable transmission rates. 0 10 20 30 40 50 60 70 80 90 100 0 2000 4000 6000 8000 10000 12000 Frame No. B it ra te
Base Layer Bitstream RS(255,251,5) RS(255,223,33)
Fig. 45. Bitrates of the original and the FEC-protected base-layer bitstreams.
0 10 20 30 40 50 60 70 80 90 100 0 2000 4000 6000 8000 10000 12000 14000 16000 18000 Frame No. B it ra te Interleaved bitstream Bitplane size
Fig. 46. Bitrates for the FEC-protected base-layer and the enhancement-layer
bitstreams.
五、參考文獻
[1] ISO/IEC JTC 1/SC 29, Inofrmation
Technology – Multimedia Framework
(MPEG-21) –Part 12: Test Bed for MPEG-21
Resource Delivery, ISO/IEC TR 21000-12:
2004(E), 2004.
[2] P. A. Chou and Z. Miao, "Rate-distortion
optimized streaming of packetized media," IEEE Transactions on Multimedia, February 2001. [3] M. R. Civanlar, "Internet video - Protocols &
applications," in Proc. Packet Video Workshop 2001, 2001.
[4] M. Dai and D. Loguinov, "Analysis of
Rate-Distortion Functions and Congestion
Control in Scalable Internet Video Streaming," ACM NOSSDAV, June 2003.
[5] Chuo-Ling Chang, Sangeun Han, and Bernd
Girod, "Rate-Distortion Optimized Streaming for 3-D Wavelet Video," Proc. IEEE International Conference on Image Processing, Singapore, Oct. 2004.
Vernon, David J. Sundaram-Stukel, "Scalable on-demand media streaming with packet loss
recovery," IEEE/ACM Transactions on
Networking, vol. 11, no. 2, pp. 195-209, Apr 2003.
[7] T. Nguyen and A. Zakhor, "Protocols for
Distributed Video Streaming," in International
Conference on Image Processing 2002,
Rochester, New York, Vol. 3, p. 185-189, September 2002.
[8] Lefeng Zhao, JongWon Kim, and C.-C. Jay Kuo,
"Constant quality rate control for streaming
MPEG-4 FGS video," IEEE International
Symposium on Circuits and Systems, Vol. 4, pp.544-547, May 2002.
[9] Jun Sun, Wen Gao, and Qingming Huang, "A
Novel FGS Base-Layer Encoding Model and
Weight-Based Rate Adaptation for
Constant-Quality Streaming," Proc. Third
International Conference on Image and Graphics, pp. 373 –376, Dec 2004.
[10] Xi Min Zhang, Anthony Vetro, Yun Q.Shi, and
Huifang Sun, "Constant Quality Constrained Rate Allocation for FGS Video Coded Bitstreams, " IEEE Transactions on Circuits and Systems for Video Technology, Vol. 13, No. 2, pp. 121-130, Feb 2003.
[11] J. Zhou, H. Shao, C. Shen and M.T. Sun,
"Multi-path Transport of FGS Video," Packet Video Workshop, 2003.
[12] Charfi, Y., Hamzaoui, R., "Packet loss protection of scalable video bitstreams using forward error correction and feedback,” International Symposium on Image and Signal Processing and Analysis, Rome, September 2003.
[13] K. W. Stuhlmueller, M. Link, B. Girod and U.
Horn, "Scalable Internet Video Streaming With
Unequal Error Protection", Packet Video
Workshop, New York, 26/27 April 1999.
[14] Huahui Wu, Mark Claypool, Robert Kinicki, "A Model for MPEG with Forward Error Correction and TCP Friendly Bandwidth, " In Proceedings of Workshop on Network and Operating Systems
Support for Digital Audio and Video
(NOSSDAV), Monterey, California, USA, June 2003.
[15] Bo Yan, Kam Wing Ng, "Mode-based
error-resilient techniques for the robust
communication of MPEG-4 video ", IEEE Transactions on Circuits and Systems for Video Technology, Vol. 14, No.6, pp. 874-879, 2004. [16] F. Zhai, Y. Eisenberg, C. E. Luna, T. N. Pappas,
R. Berry, and A. K. Katsaggelos, "Packetization Schemes for Forward Error Correction in Internet
Video Streaming," Proc. 41st Allerton
Conference Communication, Control, and
Computing, October 2003.
[17] MPEG-21 Test Bed for Resource Delivery,
http://clabprj.ee.nctu.edu.tw/~mpeg21tb/
[18] Mark Carson and Darrin Santay, "NIST Net: a Linux-based networkemulation tool", Computer
Communication Review (ACM SIGCOMM), 33(3), pp. 111-126, 2003.