國
立
交
通
大
學
生化工程研究所
碩
士
論
文
在啤酒酵母菌內
利用重組基因方式尋找
CaENO1
上的分泌訊號位置
Genetic screen to search for the secretion signal of CaENO1 in
Saccharomyces cerevisiae
研 究 生:許淑貞
指導教授:楊昀良 博士
在啤酒酵母菌內利用重組基因方式尋找
CaENO1
上的分泌訊號位置
Genetic screen to search for the secretion signal of
CaENO1
in
Saccharomyces cerevisiae
研 究 生:許淑貞 Student:Shu-Jen Shiu
指導教授:楊昀良 Advisor:Yun-Liang Yang
國 立 交 通 大 學
生化工程研究所
碩 士 論 文
A ThesisSubmitted to Institute of Biochemical Engineering College of Biological Science and Technology
National Chiao Tung University in partial Fulfillment of the Requirements
for the Degree of Master
in
Biochemical Engineering
August 2009
Hsinchu, Taiwan, Republic of China
在啤酒酵母菌內利用重組基因方式尋找
CaENO1
上的分泌訊號位置
學生:許淑貞
指導教授
:楊昀良教授
國立交通大學生化工程研究所碩士班
摘
要
真核生物中,大部份的分泌性蛋白質含有一段約
10~30 個疏水性的胺基酸
序列,且通常出現在蛋白質
N 端;透過辨識這類的訊號,細胞才能將正確的蛋
白質分泌至胞外。然而,近年來有相關研究發現,許多真核模式生物的蛋白質不
帶有典型
N 端的分泌訊號胜肽(N-terminal signal peptide),卻可被運輸至細胞表面
甚至胞外;而本實驗白色念珠菌(Candida albicans)的烯醇化酶(Enolase)即屬此類
蛋白質。在白色念珠菌中,烯醇化酶主要是由
CaENO1 基因所表達,大部份存在
於細胞質內,為胞內的醣解酵素之ㄧ;有趣的是,在細胞表面及胞外培養基中,
也 可 偵 測 到 此 蛋 白 質 的 存 在 。 本 論 文 因 此 利 用 啤 酒 酵 母 菌
(Saccharomyces
cerevisiae)表達系統,研究烯醇化酶是否存在決定性的分泌訊號序列,藉以探討
上述現象。首先,必須先確立啤酒酵母菌的系統可以表達外源的念珠菌
CaENO1
基因,於是將建構好的質體轉形至酵母菌胞內表達,再利用西方點墨(western blot)
偵測蛋白質的表現;結果顯示念珠菌
CaENO1 基因不但成功的在酵母菌內表達,
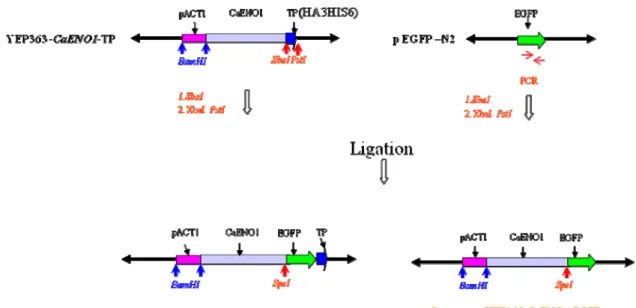
且可被分泌至胞外。確定表達系統建立後,利用建構不同的
CaENO1 片段並在 C
端接上螢光蛋白(EGFP),建構的片段長度以 DNA 序列表示, CaENO1 的 1-150 bp,
1-279, 1-387, 1-450,1-510, 1-900, 280-1320, 388-1320, 451-1320, 901-1320, 451-901
共
11 個不同建構產物,並建構一對照組僅有 EGFP,比較各個的表現來探討此基因
的序列與分泌表現的相關性。透過西方點墨法偵測結果,只有全長的
CaENO1 基
因所表現之蛋白質可於胞外被偵測;另外,共軛焦顯微鏡下觀察,並未在細胞壁
Genetic Screen to search for the secretion signal of CaENO1 in
Saccharomyces cerevisiae
Student:Shu-Jen Shiu
Advisors:Dr.
Yun-Liang Yang
Institute of Biochemical Engineering
National Chiao Tung University
Abstract
The
evidence of proteins at the yeast cell surface that lack N-terminal signal peptides was initially provided by morphological, biochemical and genetic studies. The existence of many such proteins has subsequently been demonstrated by proteomic approaches. In Candida albicans, the gene encoding enolase is named CaENO1. Enolase is an enzyme of glycolysis and gluconeogenesis as well as major cell-surface antigen, which binds host plasmin and plasminogen. It is immunoprotective, phagocytosis, biofilm-regulated, and farnesol-down regulated. Enolase is detected on the cell surface even in the culture medium, but the mechanism of secretion is still unknown. My study was focused on identifying the critical region of CaENO1 for secretion. First step is to test whether CaENO1 can be expressed in Saccharomyces cerevisiae, CaENO1 was tagged with HA3HIS6 and EGFP, respectively for detecting the target protein. Second is to further analysis the protein secretion. For determining which region is critical, the CaENO1 was truncated for obtaining the constructs with different fragments 1-150 bp, 1-279, 1-387, 1-450, 1-510, 1-900, 280-1320, 388-1320, 451-1320, 901-1320, 451-901 of CaENO1 and negative control EGFP only construct, and then analyzed for the secretion of truncated CaENO1-EGFP protein with western blot. According to the result of western blot, only full length CaENO1 can lead the tagged protein outside the cell. Using confocal laser scanning microscopy, the eno-EGFPp was localized in the cytoplasm but not in the cell membrane or cell wall.the. S. cerevisiae cell seems not recognize the eno-EGFPp as a cell wall protein in this study.誌謝
燕去燕來,時間在無聲中流逝著,我的碩士生涯也隨之畫上句點。感謝我的
指導教授-楊昀良老師,謝謝老師這段時間的不吝指導與教誨;在老師的身教言
教之下,學習面對問題的態度及解決問題的方法,讓我在挫折之時不致彷徨失
措,不論是科學實驗或待人處事,學生都獲益良多,能在老師的指導下完成學業,
學生備感榮幸。感謝三位口試委員彭慧玲老師、羅秀容老師及藍忠昱老師,謝謝
三位老師不辭辛勞,對我的論文鉅細靡遺的細心指正,讓我獲益匪淺。
再者,感謝一路上同行的朋友的陪伴。感謝惠菁學姐的熱心指引及實驗上的
幫忙,志豪學長、欣彬學姐、金蓉學姐及育潁學長的指導與照顧。謝謝我的同學
們,人脈超廣的有緣同鄉人淑萍、客家幽默一哥旻秀及神經構造特殊的敏書,彼
此的加油打氣,在這忙碌的實驗生涯是一道強心針,使我能繼續前進不放棄。還
有實驗室學弟妹們,皮膚很水的妹妹頭阿毛、眼睛超美的準人妻馨儀、作自己好
自在的靓小倩、服裝儀容超有型的毓駿、老師兼美食家的佳真、實驗越做越晚的
妍寧、笑點很多的阿大、總是 on line 的禎憶、愛貓一族的重延、豪邁大方的幸
璇、實驗室助理阿鋘、萬年點名班長葉大哥及在這裡認識的所有朋友們,這裡的
一切,因你們而交織成一幅多采多姿的回憶。另外,我的國高中及大學好友們,
感謝你們對我默默消失的這段日子裡的關心及包容,特別感謝佑任的照顧及鼓
勵,陪我度過各種的難題。最感謝我的家人,個性很急的爸爸、永遠煮我愛吃的
菜的媽媽、互相取笑的姐姐們、一定要當好男人的姐夫們及我可愛的姪子們,你
們的支持是我動力的來源。該感謝的人實在太多了,請容我無法一一道完,在此
謝謝所有關心我的人。最後,僅以這本論文,獻給我的兩位偉大雙親,希望沒辜
負你們對我的期望。
別了,交大生科,一個我永遠會懷念的地方。
Contents
Chinese Abstract...……….i English Abstract..……….ii Acknowledgement...………iii Contents...………..…iv Contents of Figures...vii I. Introduction ... 11.1 Protein secretion in yeast ... 1
1.2 Signal-less proteins are grouped by their different functions ... 1
1.3 Hypothetical mechanisms for driving signal-less proteins ... 2
1.4 The study of Enolase ... 3
1.5 Overview of the research project ... 4
II. Material... 6
2.1 Strains ... 6
2.2 Plasmids ... 7
2.3 Primers ... 8
2.4 Chemicals, enzymes, and regents ... 9
2.5 Buffers ... 11
2.6 Medium ... 13
2.7 Equipments ... 14
III. Method... 16
3.1 E. coli Transformation ... 16
3.1.1 The preparation of competent cell ... 16
3.1.2 Transformation of competent cell ... 16
3.2 Isolation of E.coli plasmid DNA ... 17
3.3 Restriction enzyme digestion ... 17
3.4 Agarose Gel Electrophoresis ... 18
3.5 PCR reaction ... 18 3.6 PCR clean up ... 19 3.7 Gel extraction ... 19 3.8 Dephosphorylation ... 19 3.9 DNA ligation ... 19 3.10 Yeast transformation ... 20
3.11 Western blot analysis ... 20
3.11.1 Preparation of protein sample ... 20
3.11.2 SDS-PAGE Electrophoresis ... 21 3.11.3 Western blot ... 22 3.12 Fluorescence staining ... 23 3.12.1 Fix cells/Permerbilize ... 23 3.12.2. Cell staining ... 23 IV. Result ... 25
4.1 The CaENO1 gene was expressed in S. cerevisiae ... 25
4.1.1 The restriction enzyme map of the YEP363-CaENO1-TP plasmid ... 25
4.1.2 The expression of CaENO1 gene ... 25
4.1.3 The secretion of the eno-tp ... 26
4.2 The analysis of CaENO1 -EGFP fusion protein ... 27
4.2.1 The construction of the expressed plasmid ... 27
4.2.2 The expression of CaENO1-EGFP fusion protein ... 28
4.2.3 The secretion of the CaENO1-EGFP fusion protein ... 28
4.2.4 The fluorescence observation of CaENO1-EGFP fusion protein . 29 4.3 The analysis of truncated CaENO1 ... 29
4.3.1 The construction of the expressed plasmid ... 29
4.3.2 The analysis of the truncated CaENO1-EGFP fusion protein ... 34
4.3.3 The secretion analysis of the truncated CaENO1-EGFP fusion protein ... 36
4.4 The localization of CaENO1p in cell ... 38
4.4.1 The localization of eno-EGFPp ... 38
4.4.2 The localization of EGFPp ... 38
V. Discussion ... 40
5.1 The CaENO1 gene was expressed in Saccharomyces cerevisiae ... 40
5.1.1 The expression of eno-tp ... 40
5.1.2 The secretion of eno-tp ... 41
5.2 The analysis of CaENO1-EGFP fusion protein ... 41
5.2.1 The expression of CaENO1-EGFP fusion protein ... 41
5.2.2 The secretion of CaENO1-EGFP fusion protein ... 42
5.3 The analysis of truncated CaENO1-EGFP protein ... 42
5.3.1 The truncation and expression of CaENO1-EGFP ... 42
5.3.2 The secretion analysis of truncated CaENO1-EGFP protein ... 43
5.4 The localization of CaENO1p in cell ... 44
VI. Future Work ... 47
VII. Reference ... 48
Contents
of Figures
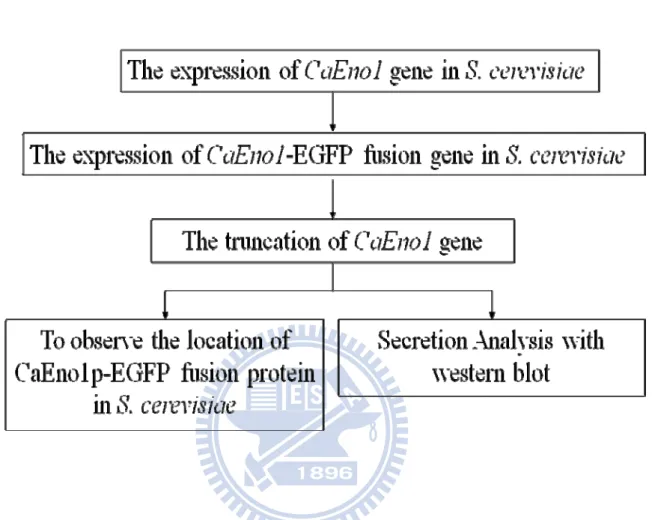
Figure 1. Strategy and flow chart of the experiments in this study. ... 52
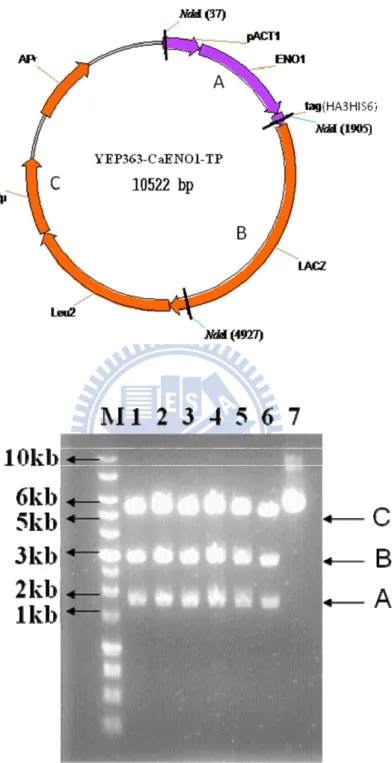
Figure 2. Restriction enzyme digestion of YEP363-CaENO1-TP. ... 53
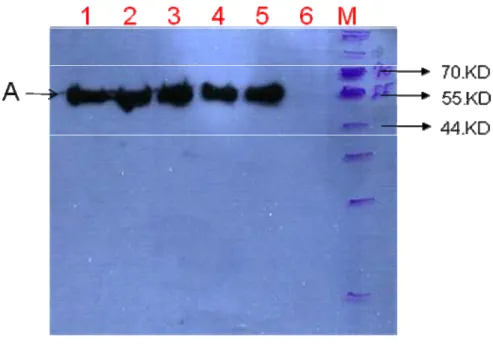
Figure 3. Western blot of the eno-tp expressed in cell. ... 54
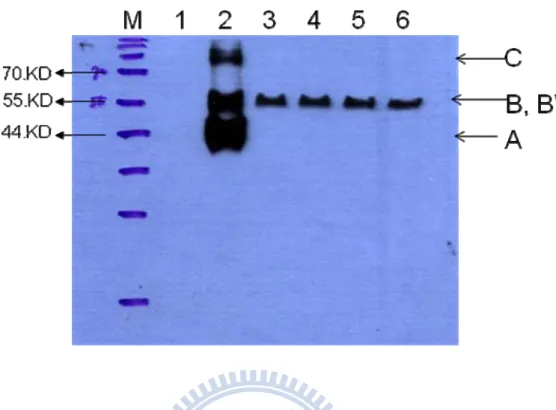
Figure 4. Wstern Blot of the eno-tp secreted outside the cell. ... 55
Figure 5. The construction of the plasmid expressed CaENO1-EGFP fusion protein in the S. cerivisiae cell. ... 56
Figure 6. Restriction digestion of the plasmids expressed CaENO1-EGFP fusion genes. 57 Figure 7. The western blot of CaENO1-EGFP fusion protein. ... 58
Figure 8. The western blot of supernatant sample of CaENO1-EGFP fusion protein from the supernatant of cultured medium. ... 59
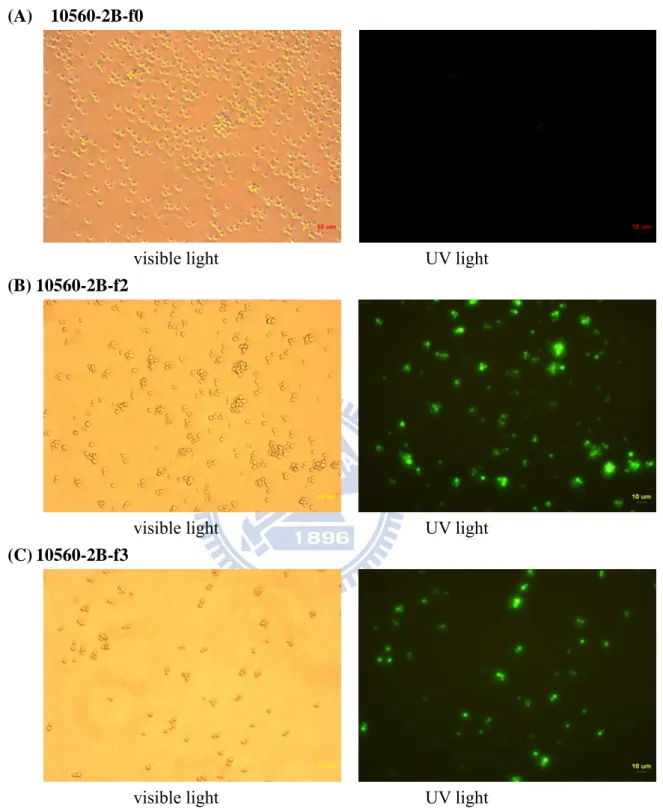
Figure 9. The microscopy observation of CaENO1-EGFP fusion protein. ... 60
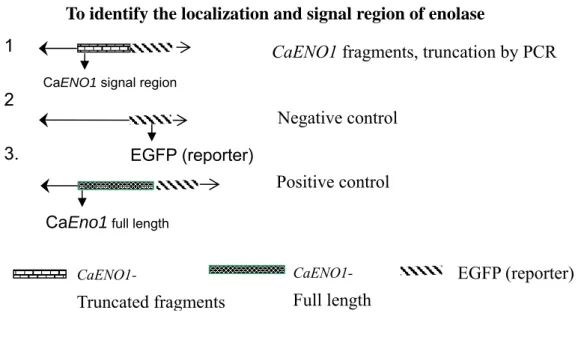
Figure 10. The diagram of the strategy in this experiment. To identify the localization and signal region of enolase ... 61
Figure 11. The diagram of the constructs of truncated CaENO1. ... 62
Figure 12. The construction of the plasmid expressing EGFP protein in S. cerivisiae cell. ... 63
Figure 13. Restriction digestion of the plasmids expressed EGFP genes. ... 64
Figure 14. The construction of the plasmids expressing truncated CaENO1-EGFP protein in S. cerivisiae cell. ... 65
Figure 15. Restriction digestion of the plasmids expressing truncated CaENO1-EGFP fusion gene. ... 69
Figure 16. The detection of truncated CaENO1-EGFP protein in S. cerivisiae cell with western blot analysis. ... 70
Figure 17. The microscopy observation of truncated CaENO1-EGFP proteins in S. cerivisiae cells. ... 75
Figure 18. The western blot of truncated CaENO1-EGFP fusion proteins from cultured medium. ... 76
Figure 19. The western blot of concentrated supernatant. ... 77
Figure 20. The western blot of concentrated supernatants. ... 78
Figure 21. The localization of CaENO1p in the cell. ... 79
Figure 22. The localization of EGFP in the cell. ... 81
I. Introduction
1.1 Protein secretion in yeast
Secretion is a universal cellular process occurring in simple organisms such as baker’s yeast to complex multicellular organisms including humans. Cell secretion involved the transport of vesicular product from within cell to without. This is considered to be the canonical mechanism for protein secretion, and recognition of a signal peptide sequence in a gene is taken as a clear indication that the corresponding product is exported by the cell. The process involves the translocation apparatus of the ER and is operated by the Golgi and Golgi-derived secretory vesicles fusing with the plasma membrane to release their protein content into the extracellular space.
However, experimental evidence accumulated over the past few years clearly shows that a significant number of proteins, glycolytic enzymes and other cytosolic proteins that lack an N-terminal signal peptide reach the cell surface. Many of these studies have been carried out in two yeast systems, namely Saccharomyces cerevisiae and Candida albican. Evidence of proteins at the cell surface that lack N-terminal signal peptides was initially provided by morphological, biochemical and genetic studies. These findings were first documented in C. albicans because several of the aforementioned proteins were identified as adhesins and host ligands that mediate attachment and retention of the commensal yeast on host tissues [1, 2]. Furthermore, some of these proteins have also been found in the S. cerevisiae cell surface [3–7].
1.2 Signal-less proteins are grouped by their different functions
Although the proteomic characterization was not exhaustive, the presence of several members of at least three groups of proteins with different functions was
apparent [8]. Notably, in the first group, the levels of enzymes involved in glycolysis – including enolase and fructose-bisphosphate aldolase – are profoundly affected by the yeast-to-mycelium transition on C. albicans. For example, the glycolytic enzyme glyceraldehyde-3-phosphate dehydrogenase (GAPDH) was serologically identified on the cell surface of C. albicans, where it mediates binding to host fibronectin and laminutesin, and is expressed more abundantly in hyphal forms [9]. The second group consists of heat-shock proteins with the capacity to function as chaperones, a striking example being osmotically stabilized regenerating protoplasts of S. cerevisiae, which secrete many proteins including metabolic enzymes and heat-shock proteins [4]. The third group consists of translation elongation factors that are proteins that interact with complexes of other proteins and RNA. The level of enolase and phosphoglyceromutase associated with the cell wall is much reduced in C.
albicans grown in the presence of fluconazole [10], providing further evidence that
the localization of signal-less proteins is altered in response to the environment.
1.3 Hypothetical mechanisms for driving signal-less proteins
Several possibilities can be envisaged from observations made in yeasts and other organisms. Data from S. cerevisiae indicate that the ATP-binding cassette transporter is a potential driver for protein export. In addition, non-classical export (NCE) genes NCE101 and NCE102 are related to non-classical export of heterologous mammalian galectin. The existence of homologues for NCE101 and NCE102 in C. albicans,
Candida glabrata, Kluyveromyces lactis and Yarrowia lipolytica is also relevant.
Observations of alternative secretion in mammals and parasites [11] provide grounds for postulating membrane blebbing (bubble formation) and other options based on the specific recognition of alternative secretion proteins for export outside the plasma membrane.
When SignalP, an algorithm for the prediction of non-classically secreted human proteins [12], was applied to non-conventional exported yeast proteins, mixed results were obtained. One suggestion was that these proteins could leak into the secretory pathway and be exported in this way [13]. In the absence of potential glycosylation sites, leakage would be predicted to occur into Golgi or cargo vesicles. If this were the case, this mechanism would need to be sensitive to secretory-pathway inhibitors and would not operate in conditional mutants affected in classical secretion. Unfortunately, this possibility was examinutesed only briefly and a sec4 conditional mutant strain did not seem to be affected at the non-permissive temperature [14].
Secondary-structure elements might contribute to export because partial unfolding of the b-barrel structure of fibroblast growth factor (FGF)-1 and interleukin (IL)-1a [15] are part of an export mechanism. In addition, the unfolded state of the green fluorescent proteinβ-barrel structure leads to export of the unfolded fraction. None of the non-conventionally exported yeast proteins identified is of this structure, although some have a hybrid secondary structure.
1.4 The study of Enolase
Enolase ( 2-phospho-D-glycerate hydrolase ) is an enzymatic component of the glycolytic pathway and is conserved through evolution. It catalyzes the conversion of 2-phosphoglycerate to phosphoenolpyruvate in the second step of he glycolytic pathway.The enzymatic activity of enolase requires certain divalent metal ions, and magnesium ion is its important natural cofactor [16,17]. Enolase can be detected in many prokaryotic and eukaryotic cells, and is localized in cytoplasm, cell surface and nucleus of various mammalian cells to possibly mediate distinct functions. Recent studies have revealed that enolase is involved in many different physiological and
The protein enolase is one of the most abundant enzymes in the cytosol, and is also a cell wall protein which may arrive at the cell wall via a currently unknown pathway in S. cerevisiae and C. albicans. The exact function of enolase in the cell wall is still unclear, but it is possible that enolase may have an alternative function, as do other glycolytic enzymes, most notably phosphoglycerate kinase, glyceraldehyde phosphate dehydrogenase, and alcohol dehydrogenase [3,5,10].
Different approaches had identified this protein among those isolated from the cell wall and immunogold electron microscopy demonstrated that this is associated to the surface of whole cells [3]. Preliminutesary evidence at the molecular level also confirmed that the protein sequence of enolase has the capacity to drive enolase to the external medium [4]. In addition, a global analysis using proteome chips also pointed to the capacity of enolase, and several other proteins involved in glucose metabolism, to bind to phospholipids, suggesting their interaction with membranes [19]. Enolase has also been described as a surface protein in the cells of many other species, ranging from prokaryotic microorganisms to human cells, and its putative role as binding to plasminutesogen, laminutesin or salivary mucin proteins [20] is coherent with an external location [21–15]. Plasminutes(ogen) binding of C. albicans enolase has been related to enhanced invasion of human brain microvascular endothelial cells [26] and in this organism enolase is also an immunodominutesant antigen.
1.5 Overview of the research project
In C. albicans, the gene encoding enolase is named CaENO1. It is a enzyme of glycolysis and gluconeogenesis. It is a major cell-surface antigen binding host plasminutes and plasminutesogen. It is involved in immunoprotection, phagocytosis, and is biofilm-regulated and farnesol-down regulated. The cDNA of CaENO1 is 1320 bp. It is essential for cell growth in glucose-contained media. In previous study,
enolase of C. albicans was considered a secreted protein that lacks an N-terminal signal peptide through non-canonical mechanism. It was detected on the cell surface and even in the culture medium, but the mechanism of enolase secretion is still unknown.
There are two key issues in this project: how dose C. albicans secret enolase outside the cell and what is the sequence required for secretion. No matter what it uses for transport regardless channel, pump, or other approach, it must contain a region for interaction with receptor on the membrane, directly or indirectly.
My research was focused on searching the critical region of CaENO1 for secretion. Because C. albicans is diploid without known plasmid; it is difficult to manipulate on molecular level. Therefore, in this study, the experiment is conduted with CaENO1 in
S. cerevisiae .
First step is to test whether CaENO1 can be expressed in S. cerevisiae. For
detecting the target protein, CaENO1 was tagged with tag (either HA3HIS6 or EGFP) in this study. The second is further to determine which region of the protein is critical for secretion. Various trucated CaENO1 genes were constructed. The flow chart is shown in Fgure1.
II. Material
2.1 Strains
E.coli : DH5α
Saccharomyces cerevisae :
Strain Genotype Reference
10560-2B MATa his3 : : hisG ura3–52 leu2 : : hisG
Chen et al. (2004), Lab
of H.-J. Lo 10560-2B-f0 10560-2B was transformed with plasmid
YEP363 This study
10560-2B-f1 10560-2B was transformed with plasmid
YEP363-CaENO1-TP This study
10560-2B-f2 10560-2B was transformed with plasmid
YEP363-CaENO1-EGFP This study
10560-2B-f3 10560-2B was transformed with plasmid
YEP363-CaENO1-EGFP-TP This study
10560-2B-EGFP 10560-2B was transformed with plasmid
YEP363-EGFP This study
10560-2B-
CaENO1[280-1320]
10560-2B was transformed with plasmid
YEP363- CaENO1[280-1320]-EGFP This study 10560-2B-
CaENO1[388-1320]
10560-2B was transformed with plasmid
YEP363- CaENO1[388-1320]-EGFP This study 10560-2B-
CaENO1[451-1320]
10560-2B was transformed with plasmid
YEP363- CaENO1[451-1320]-EGFP This study 10560-2B-
CaENO1[901-1320]
10560-2B was transformed with plasmid
YEP363- CaENO1[901-1320]-EGFP This study 10560-2B-
CaENO1[451-901]
10560-2B was transformed with plasmid
YEP363- CaENO1[451-901]-EGFP This study
10560-2B- CaENO1[1-150]
10560-2B was transformed with plasmid
YEP363- CaENO1[1-150]-EGFP This study 10560-2B-
CaENO1[1-279]
10560-2B was transformed with plasmid
Strain Genotype Reference
10560-2B- CaENO1[1-387]
10560-2B was transformed with plasmid
YEP363- CaENO1[1-387]-EGFP This study 10560-2B-
CaENO1[1-1450]
10560-2B was transformed with plasmid
YEP363- CaENO1[1-1450]-EGFP This study 10560-2B-
CaENO1[1-511]
10560-2B was transformed with plasmid
YEP363- CaENO1[1-511]-EGFP This study 10560-2B-
CaENO1[1-900]
10560-2B was transformed with plasmid
YEP363- CaENO1[1-900]-EGFP This study
2.2 Plasmids
Plasmid Description Reference
pEGFP-N2 It contained EGFP.
BD Bioscience
Clontech
YEP363
It contained selection marker Leu2 gene,
lacZ gene, ampR (ampicillin resistance),
and 2μ (origin of yeast).
Valenzuela et.,1998
YEP363-CaENO1-TP
YEP363 plasmid contained CaENO1 gene tagged with HA3HIS6 tag and pACT1 promoter Made by Yao-Chen Chuang, Lab of Y.-L. Yang YEP363-CaENO1- EGFP
YEP363 plasmid contained CaENO1 gene tagged with EGFP and pACT1 promoter
This study
YEP363-CaENO1- EGFP-TP
YEP363 plasmid contained CaENO1 gene tagged with EGFP and HA3HIS6 tag and pACT1 promoter
This study
YEP363-EGFP YEP363 plasmid contained EGFP and
pACT1 promoter This study
YEP363-
CaENO1[280-1320]-EGFP
YEP363 plasmid contained +280~+1320 bp of CaENO1 gene tagged with EGFP and pACT1 promoter
This study
YEP363- YEP363 plasmid contained +388~+1320
Plasmid Description Reference
and pACT1 promoter YEP363-
CaENO1[451-1320]-EGFP
YEP363 plasmid contained +451~+1320 bp of CaENO1 gene tagged with EGFP and pACT1 promoter
This study
YEP363-
CaENO1[901-1320]-EGFP
YEP363 plasmid contained +901~+1320 bp of CaENO1 gene tagged with EGFP and pACT1 promoter
This study
YEP363- CaENO1[451-900]-
EGFP
YEP363 plasmid contained +451~+901 bp of CaENO1 gene tagged with EGFP and pACT1 promoter
This study
YEP363- CaENO1[1-150]- EGFP
YEP363 plasmid contained +1~+150 bp of CaENO1 gene tagged with EGFP and pACT1 promoter
This study
YEP363- CaENO1[1-279]- EGFP
YEP363 plasmid contained +1~+279 bp of CaENO1 gene tagged with EGFP and pACT1 promoter
This study
YEP363- CaENO1[1-387]- EGFP
YEP363 plasmid contained +1~+387 bp of CaENO1 gene tagged with EGFP and pACT1 promoter
This study
YEP363- CaENO1[1-450]- EGFP
YEP363 plasmid contained +1~+450 bp of CaENO1 gene tagged with EGFP and pACT1 promoter
This study
YEP363- CaENO1[1-510]- EGFP
YEP363 plasmid contained +1~+511 bp of CaENO1 gene tagged with EGFP and pACT1 promoter
This study
YEP363- CaENO1[1-900]- EGFP
YEP363 plasmid contained +1~+901 bp of CaENO1 gene tagged with EGFP and pACT1 promoter
This study
2.3 Primers
Name Sequence (5’→3’) Location
EGFP-L-XbaⅠ SpeⅠ ATTCTAGAACTAGTATGGTG AGCAAGGGC EGFP gene: Nucleotide: +1~+15 EGFP-R-XbaⅠ ATTCTAGACTTGTACAGCTC GTCCATGC EGFP gene: Nucleotide: +717~+698
Name Sequence (5’→3’) Location
EGFP-R- PstⅠ AACTGCAGTTACTTGTACAG CTCGTCC
EGFP gene:
Nucleotide: +720~+702 pACT1 -F CATTCATTCCCGGAATTCCC YEP363-CaENO1-TP
Nucleotide:+10509~+8 pACT1 -R CCACTAGTTGTTAATTCAGT AAATTTTCG YEP363-CaENO1-TP Nucleotide:+491~+471 eno/1-f GGACTAGTTCTAGAATGTCT TACGCCACTAAA CaENO1 gene: Nucleotide: +1~+18 eno/450-r GGACTAGTAACTGGCAAAA CGAATTTACC CaENO1 gene: Nucleotide: +450~+430 eno/451-f GGACTAGTTCTAGAATGCCA TTCCAAAAC CaENO1 gene: Nucleotide: +451~+462 eno/900-r GGACTAGTGAATGGATCTTC AATAGAAACAA CaENO1 gene: Nucleotide: +900~+878 eno/901-f GGACTAGTTCTAGAATGGCT GAAGATGACT CaENO1 gene: Nucleotide: +901~+913 eno/1320-r GGACTAGTCAATTGAGAAG CCTTTTGG CaENO1 gene: Nucleotide:+1320~+1302 eno1/280F GGACTAGTCTAGATGTTCTT GTTGTCCTTGG CaENO1 gene: Nucleotide:+280~+295 eno1/388F GGACTAGTCTAGATGCCATT GTACAAACAC CaENO1 gene: Nucleotide:+388~+402 eno1/150R GGACTAGTCAATTCCAAAG CTTCGTG CaENO1 gene: Nucleotide:+150~+133 eno1/279R GGACTAGTTTCATCAATCTT AGCTTGGTCG CaENO1 gene: Nucleotide:+279~+258 eno1/387R GGACTAGTAATGCCTTGAGC AGCAGC CaENO1 gene: Nucleotide:+387~+370 eno1/510R GGACTAGTTTCTTGGAAAG CTAAAGCACC CaENO1 gene: Nucleotide:+510~+490
2.4 Chemicals, enzymes, and regents
(Cat.No.0854-1L-PTM), Tris base (Cat. No.0826), Tris-Hydrochloride (Cat. No.0234-500G), Acryl/Bis 37.5:1 solution (Cat. No.0524)
Amersham Biosciences : Nitrocellulose Membrane (Cat. No.FM0053-1) Anchor : Non fat milk (Cat. No.EMB53084-D)
ApplinChem : Ampicillin (Cat. No.A2839)
Bio-Rad : Ammonium persulfate (APS) (Cat.No.161-0700)
Difco: Bacto agar (Cat. No.143175), Yeast nitrogen base w/o aminol acid (Cat. No.145368) ,YPD broth (Cat. No.135141XB)
Fermentas : T4 DNA ligas (Cat. No.1812)
Fluka : Acetic acid (Cat. No.33209), Calcofluor White Stain (Cat. No.18909), Phenyl methey sulfonyl fluoride (PMSF) (Cat.No.78830), Urea (Cat. No.SK-2644U)
Invitrogen : Image-iT ™ LIVE Plasma Membrane and Nuclear Labeling Kit (Cat. No.I34406)
J.B.Baker : Dextrose (Cat. No.1916-01)
Kodak : GBX Developer and Replenisher (Cat. No.8875569) ,GBX Fixer and Replenisher (Cat. No.1749837), X-film (Cat. No.1651454)
Merck : Dodecy Sulfate Sodium (SDS) (Cat. No.1.12012.0500) ,Ethanol (Cat. No.1.00983.2500), Tris –HCL (Cat. No.1.01547.1000), Sodium acetate (Cat. No.1.06267.0500), β-mercaptoethanol (Cat. No.1.1543.0100)
Mallinckrodt : Methanol (Cat.No.3016-08)
MILLIPORE : Amicon Ultra-15 (Cat. No.UFC9 010 08), Amicon Ultra-4 (Cat. No.UFC9 010 24), HRP substrate (Cat. No.WBKLS0500)
NEB : Restriction Enzyme (in this study)
NOVUS : pAb anti-EGFP[HRP] (Cat. No.NB600-313 )
Promega : Shrimp Alkaline Phosphatase (SAP) (Cat. No.M8201)
Premier: ExcelPureTM Plasmid Minutesi kit (Cat. No.PM250), ExcelPureTM PCR Cleanup kit (Cat. No.CU250), PCR clean-up/Gel Extraction kit (Cat. No.N-DCE050)
Riedel-de Haen : Sodium Chloride (Cat. No.13423), Sodium hydroxide (Cat. No.30620), CaCl2(Cat. No.31307), Fomaldehyde (Cat. No.33220)
Santa Cruz : HA-probe(F-7)HRP (Cat. No.SC-7392) Scharlau: LB broth (Cat. No.02-385)
Schleich&Schue II: Nitrocellulose Transfer Membrane (Cat.No.10401396) SibEneyme: 1kb DNA leader (Cat. No.SEM11C001)
Sigma: Crystal violet (Cat. No.C-3886), Ethidium bromide (Cat. No.E-7637) Glass Beads(Cat.No.G-9286), Lithium Acetate (Cat. No.L-6883), L-Histidine(Cat. No.H-8125), Polyethylene Glycol3350(Cat. No.P-4338),
2-propanol(Cat.No.I9516), Uridine (Cat. No.U-0750), Lyticase (Cat. No. L4025-25KU), Tween 20 (Cat. No.P-1379), N,N,N,, N,,-tetramethylenediaminutese (TEMED) (Cat. No.T-9281)
TBB : Prestain Protein marker (Cat. No.0901) Thermo : POLYSINE○SLIDES (Cat. No.2209-01)
2.5 Buffers
1% crystal violet solution
5 g crystal violet solution, 50 ml 37% formaldehyde, 450 ml H2O
1M Lithium Acetate
40.8 g Lithium Acetate added ddH2O to 400 ml (pH 7.5)
5% Blocking buffer
2.5 g nonfat powdered milk dissolved in 50 ml 1X TBS buffer
5M EDTA stock solution
186.1 g EDTA added ddH2O to 800 ml (pH 8.0)
10% (v/v) Glycerol
12.6 g glycerol (density = 1.26 g/ml), make to 100 ml with dH2O
10X Running buffer (also called Laemmli buffer)
30.3 g Tris base, 144 g Glycine, 10 g SDS, make to 1L with dH2O
10X TE buffer
100 mM Tris-HCl (pH 8.0), 10mM EDTA
10X Transfer buffer
39 mM Glycine, 48mM Tri base, 10% SDS, 20% methanol
40% Dextrose
40g Dextrose added ddH2O to 100 ml
50% PEG3350
75 g polyethylene glycol3350 added ddH2O to 150 ml
50X TAE buffer
48.4g Tris base, 0.5M EDTA (pH 8.0) 20ml, 11.42 ml acetic acid added ddH2O
to 200 ml
Breaking buffer
100 mM Tris-HCl (pH 8.0), 1% (w/s) SDS, 2% (v/v) Triton X-100, 100 mM NaCl, 10mM EDTA
LATE buffer
0.1 M Lithium acetate, 10 mM Tris-HCl (pH 7.5), 1mM EDTA Lyticase digestion solution (in PBS)
2μl/ml β-ME (13.8M stock at 4℃) TBS buffer (Tris-buffered saline)
10 mM Tris-HCl (pH 8.0), 150 mM NaCl TBST buffer
10 mM Tris-HCl (pH 8.0), 150 mM NaCl, 0.05% Tween
PBS buffer
8 g NaCl, 0.2 g KCl, 1.44 g Na2HPO4, 0.24 g KH2PO4
in 800 ml of distilled H2O. Adjust the pH to 7.4 with HCl. Add H2O to 1 liter. PLATE buffer
40% polyethylene glycol3350 in LATE buffer
2.6 Medium
LB (Luri-Bertni) agar
1% tryptone, 0.5% yeast extract, 1%NaCl, 1.5% agar LB agar /Ampicilline
1% tryptone, 0.5% yeast extract, 1% NaCl, 1.5% agar, 50μg/ml Ampicillin LB broth
1% tryptone, 0.5% yeast extract, 1% NaCl LB broth/Ampicilline
1% tryptone, 0.5% yeast extract, 1% NaCl, 50μg/ml Ampicillin SD agar
0.67% Bacto-yeast nitrogen base w/o aminol acid, 2% dextrose, 2% agar SD broth
0.67% Bacto-yeast nitrogen base w/o aminol acid, 2% dextrose SD agar/Uridine. Histidine
80 mg/l uridine, 100 mg/l histidine SD broth/Uridine, Histidine
0.67% Bacto-yeast nitrogen base w/o aminol acid, 2% dextrose, 80 mg/l uridine, 100 mg/l histidine
YPD agar
2% Bacto-peptone, 1% yeast extract, 2% dextrose 2% agar YPD broth
2% Bacto-peptone, 1% yeast extract, 2% dextrose
2.7 Equipments
4℃ refrigerator KS-101MS (MINUTESI KINGCON)
-20℃ low temperature refrigerator (WHITE-WESTINGHOUSE) -80℃ low temperature refrigerator 925/926 (FRISTEK SCIENTIFIC) Bench top orbital shaker S101 (FIRSTEK)
Certrifuge model 5100 (Kubota Corporation) Digital scale PB153-S (METTLER TOLEDO) Digital scale TB-214 (DENVER INSTRUMENT)
Fluorescence Microscope ECLIPSE TE2000-U (NIKON)
GeneQuant pro DNA/RNA calculator (AMERSHAM PHARMACIA BIOTECH) Gene CycleTM (BIO-RAD)
Image system GEL DOC 2000 (BIO-RAD)
Microcentrifuge MICRO 240A (DENVILLE SCIENTIFIC INC.)
Olympus FluoView Confocal Laser Scanning Microscopes - FV500 (OLYMPUS) Orbital shaker IKA-VIBRAX-VXR
pH meter Φ360 (BACKMAN)
Shaker VORTEX-GENIE2 G560 (SCIENTIFIC INDUATRIC) Thermal Cycler PTC-100RT (MJ RESEARCH INC.)
Water bath B206-T1 (FIRSTEK SCIENTIFIC) TRANS-BLOT® SD CELL 221BR (BIO-RAD)
III. Method
3.1 E. coli Transformation
3.1.1 The preparation of competent cell
DH5α was inoculated into 5 ml LB broth and incubated at 37oC for 16~18 hours with vigorous shaking (~180 rpm/minutes). Then 2 ml of cultured cell solution was transferred to 50 ml LB broth and incubated at 37oC with vigorous shaking (~180 rpm/minutes). Until the OD600 arriving 0.6~0.8, the cultured cell solution was
transferred to 50 ml centrifugation tube and then put on the ice for 20 minutes. The cells were collected by centrifugation of 1620×g (eppendorf 5804R) at4oC for 10 minutes. Then the cells resuspended in cold 25 ml 0.1M CaCl2 solution and put on the
ice for 30 minutes. The cells were collected by centrifugation of 720×g (eppendorf 5804R) at4oC for 10 minutes and then resuspended in cold 5 ml 0.1M CaCl2 solution.
The cell solution was stored at 4oC for 18 hours and then centrifuged at 4oC , 720×g (eppendorf 5804R) for 10 minutes. Then the cells were resuspended in cold 5 ml 0.05M CaCl2 with 15% glycerol solution. Finally, the cell solution was separated into
100 μl for each eppendorf tube and then stored at -80oC.
3.1.2 Transformation of competent cell
The competent cell in the eppendorf tube from -80oC was put on the ice for unfreezing and then added 0.1~1μg plasmid DNA. After ice bath for 30 minutes, the competent cell was heat shock at 42oC for 1 minute and then added 300μl LB broth with 50μg/ml Ampicillin. The cell solution was incubated at 37oC for 1 hours with vigorous shaking (~180 rpm/minutes). Each 100μl of the cell solution was dispread on the LB agar medium with 50μg/ml Ampicillin and incubated at 37oC for 12~18 hours.
3.2 Isolation of E.coli plasmid DNA
The plasmid in E.coli was extracted with ExcelPureTM Plasmid Mini kit (Premier, Cat. No.PM250). The procedure is as following :
The DH5α with target plasmid was inoculated into 5 ml LB broth with 50μg/ml Ampicillin and incubated at 37oC for 16~18 hours with vigorous shaking (~180 rpm/minutes). 1.5 ml of cell solution was transferred to an eppendorf tube. The cells were recovered by centrifugation at 13000 rpm for 1 minute and then resupended in 200μl Solution I buffer (Premier, Cat. No.PM250). Then 200μl of Solution II buffer (Premier, Cat. No.PM250) was added to the mixture and mixed gently. Initially, 200μl of Solution III buffer (Premier, Cat. No.PM250) was added to the mixture and mixed gently again. The mixture was centrifuged at 13000 rpm for 5 minutes at room temperature. The supernatant was transferred to Mini-MTM Column (Premier, Cat. No.PM250) packed with collection tube and spun at 13000 rpm for 1 minute. The filtrate in the collection tube was discarded. 700 μl of Wash Solution (Premier, Cat. No.PM250) was added to Mini-MTM Column and spun at 13000 rpm for 1 minute. The filtrate was discarded and the washing step was repeated once again. After the filtrate was discarded, the column was centrifuged at 13000 rpm for 3 minutes to remove residual ethanol. The Mini-MTM Column was transferred to a new eppendorf tube and incubated at 60oC for 5 minutes to evaporate the ethanol. Finally, the DNA in the column was eluted in 50μl ddH2O by spinning at 13000 rpm for 1 minute. The
plasmid DNA was stored at -20oC.
3.3 Restriction enzyme digestion
reaction mixture was added by 0.5~10μg plasmid DNA, 0.1~1μl restriction enzyme and reaction buffer to appropriate volume (10~50μl). The reaction for each kind of restriction enzyme was according to the recommend condition in operation manual. After the reaction was finished, the DNA was analyzed by agarose gel electrophoresis.
3.4
Agarose Gel Electrophoresis
Preparation of sample for running gel: 2 ul 6 X loading dye was added to 1 0 ul reaction mix. Electrophoresis : 0.8% agarose gel (0.6-1.2 % depends on the size of DNA). Every 0.8 g agarose was add 100 ml 1 X TBE (or TAE) buffer. The mixture was microwaved till the agarose melt complete and then cooled to 50oC. While agarose solution was cooling, the gel box and comb was assembled and then the gel was poured into it. After the gel was solidified, the sample was loaded and run with 50-150V. After the DNA dye was on appropriate site, the gel was stained in EtBr 10 ug/ml for 5 minutes and then destained in running water for 10-15 minutes. The gel was take picture under UV box.
3.5 PCR reaction
The primers used in this study were designed from NCBI database for amplifying target genes. The total volume of reaction mixture was 50μl, contained DNA template(10~20 ng), 5μl of 10× reaction buffer, 1μl of each 5μM primer of pairs, 4μl of 2.5μM dNTP, 0.5μl of Tag (5U/μl) and fulfilled with ddH2O. The PCR reaction was
as following :
Step 1 : 95oC for 10 minutes Step 2 : 95oC for 1 minutes Step 3 : 50~60oC for 1 minutes Step 4 : 72oC for 1 minutes
Step 5 : back to step 2 and repeat for 29 cycles Step 6 : 72oC for 5 minutes
After the PCR reaction was finished, the PCR products were analyzed by agarose gel electrophoresis.
3.6 PCR clean up
For removing the extra material from PCR reaction mixtures, the PCR products
were clean up with ExcelPureTM PCR Cleanup kit (Cat. No.CU250).
3.7 Gel extraction
For isolating DNA from agarose gel, the band was excised out of the agarose gel
with PCR clean-up/Gel Extraction kit (Premier, N-DCE050).
3.8 Dephosphorylation
Restriction-digested vector (restriction enzyme and buffer removed, DNA in water or TE buffer) was incubated with Shrimp Alkaline Phosphatase (1 unit/μg DNA) (Promega, Cat. No.M8201) at 37°C for 15 minutes in 1X SAP reaction buffer in a final volume of 30–50μl. This is a sufficient amount of SAP to completely dephosphorylate the vector regardless of overhang type (5´, 3´ or blunt). Inactivate SAP by heating to 65°C for 15 minutes.
3.9 DNA ligation
For ligation of vector DNA and insert DNA, the total reaction volume was 10~30μl. The reaction solution contained 1 unit T4 DNA ligase, 1~3μl of 10× ligase buffer, vector DNA and insert DNA (the ratio of vector DNA to insert DNA was 1:3)
3.10 Yeast transformation
S. cerevisiae cells were grown in 10 ml of YPD or selective medium overnight at
30 for 18 hours with 300 rpm (OD℃ 600 > 1.0). 1 ml of culture was transfered into
eppendorf tubes (If more cells needed, use 2 ml of overnight culture, especially, when selective medium is used). Cells was spun for 30 seconds - 1 minutesute at high speed , and poured off supernatant. Cells was resuspended with 1 ml of 0.1 M of LioAC/TE, then spun for 30 secconds - 1 minutesute at low speed and poured off supernatant, repeated twice. Then cells was resuspended gently with 0.1 ml of 0.1 M of LioAC/TE. 0.1~1 μg plasmid (to be transformed) and 3 ~10 μl of boiled 10 mg/ml salmon sperm DNA as carrier (DNA was boiled for 1 minutesute and kept on ice right away) were added. The reaction mixture were mixed gently, then 0.4 ml of 50% PEG3350 /0.1 M of LioAC/TE was added. The reaction was then incubated at 30 on ℃
wheel for 30 minutes or sit in 30 incubator for 30℃ -60 minutes. The reaction mixture was then subjected to heat shock at 42 for 20 ℃ minutes in water bath. Cells were spun very gently at low speed for 30 seconds, and the supernatant was discarded. The reaction was further spun for 5 seconds, then all supernatant was removed with 200 μl pipette tip. 150 μl of SD or TE was added to resuspend cells. Then the cells were plated on selective media (SD agar/Uridine,Histidine) and incubated at 30 ℃ incubator for 3-5 days.
3.11 Western blot analysis
3.11.1 Preparation of protein sample
Protein sample from cell extract : S. cerevisiae cells were grown in 5 ml of SD
broth/Uridine,Histidine at 30 for 48 hours wi℃ th 300 rpm (OD600 ~ 2.0). The cell
discarded, the cells was resuspended in 10 ml Z buffer and then centriguged at 2500 rpm at 4 for 5 ℃ minutes once again. The cells was resuspended in 200μl breaking buffer in the eppendorf, and added 12.5μl PMSF and glass beads (near the fluid surface). The mixture was vortex at 4℃for 15 seconds, repeated four times. After the cells was broken completely, 200μl breaking buffer was added and vortex for 10 seconds. The cell mixture was centrifuged at 4 , 13000 rpm for 15 ℃ minutes. The supernatant was transferred to cooled eppendorf and added the same volume of 2× SDS-PAGE loading dye. The protein sample was stored at -20 .℃
Protein samples from supernatant of 5 ml cultured media was obtained as following : S. cerevisiae cells were grown in 5 ml of SD broth/Uridine,Histidine at 30 for 48 hours with 300 rpm (OD℃ 600 ~ 2.0) . The cell solution was centrifuged at
2500 rpm at 4 for 5 ℃ minutes. Then the supernatant was transferred to 15ml tube or concentrated by Amicon Ultra-15 (Cat. No.UFC9 010 08). Equal amount of the protein sample was added the same volume of 2× SDS-PAGE loading dye and stored at -20 .℃
Protein samples from supernatant of 50 ml cultured media was obtained as following: S. cerevisiae cells were grown in 5 ml of SD broth/Uridine,Histidine at 30 for 48 hours with 300 rpm (OD℃ 600 ~ 2.0). Then 2ml of cell solution was
transferred to 50 ml of SD broth/Uridine,Histidine and incubated at 30℃ for 48 hours (OD600 ~ 2.0). The cell solution was centrifuged at 2500 rpm at 4℃ for 5 minutes.
The supernatant was concentrated by Amicon Ultra-15 (Cat. No.UFC9 010 08). The protein sample was added the same volume of 2× SDS-PAGE loading dye and stored at -20 .℃
thin spacer was used and a comb was chosen--number of wells varies. Then APS and TEMED was added to resolving gel and mixed. The resolving gel mixture was poured into the spacer about 3-3.5 ml per gel and kept in room temperature for polymerizing. After resolving gel polymerizes, APS and TEMED were added to stacking gel mixture and poured gently on top of the resolving gel. Then the comb was set up to solidify. After the gel was solidified, the comb was removed and the gel was placed in holder/electrode and then was transferred to running tank. The tank was filled with 1X Running Buffer ( the inside and outside buffer chambers was kept separated). 10~50μl of protein samples were loaded in each well. The electrophoresis was conducted at 100V through the stacking gel, and then at 100V-200V until the dye front reached the bottom of the gel.
3.11.3 Western blot
After preparation of samples and SDS-PAGE electrophoresis, the gel was incubated in about 20 ml of transfer buffer for 15 minutes with shaking. In the mean time, one piece of Nitrocellulose membrane for each gel was incubated in methanol for 1 minute. After that, methanol was replaced with transfer buffer. The Nitrocellulose membrane was placed on top of the gel, and one filter paper placed on top of that and two filter papers below. of that. The proteins were transferred to Nitrocellulose membrane at 0.09 A for 37 minutes by TRANS-BLOT® SD CELL 221BR (BIO-RAD) for a gel. Non-specific binding sites were blocked by incubation of Nitrocellulose membrane in 20 ml of blocking buffer for 60 minutes at room temperature with continuous, gentle rotary agitation. Nitrocellulose membrane was then incubated with a dilution 1:1000 primary antibody-HRP conjugated (in blocking buffer) for 3 hours at room temperature, with continuous gentle agitation, or for 16 hours overnight at 4 °C. Nitrocellulose membrane was rinsed in 10 ml of TBST twice
and was washed in 20 ml of TBST for 1 x 20 minutes followed by 4 x 5 minutes, with continuous, rotary agitation on each occasion. Again, agitation should be vigorous but not too much so as to damage the membrane. The peroxidase detection method was applied. The membrane was incubated with HRP substrate and covered with saran wrap after removing the excessive solution from the surface. Then it was exposed to X-ray film in dark room for proper exposure time and treated with developer and fixer solution.
3.12 Fluorescence staining
3.12.1 Fix cells/Permerbilize
S. cerevisiae cells were grown in 5 ml of SD broth/Uridine,Histidine at 30℃ for 48 hours with 300 rpm (OD600 ~ 2.0). For fixing, 50μl of 36.5% formaldehyde was
added to 316 μl of cell solution and the mixture was incubated at room temperature for 15 minutes. Then the cells were centrifuged at 13000 rpm for 5 minutes. The supernatant was removed with 200μl pipette, and the cells were washed with 500μl of PBS solution. Then the cells were centrifuged at 13000 rpm for 5 minutes and washed once again. The cells were resuspended in 100 μl of lyticase digestion solution at 30 for 30 ℃ minutes and then added 900 μl PBS. Then the cells were centrifuged at 4 , 2000 rpm for 5 ℃ minutes. The supernatant was removed with 200μl pipette, and the cells were washed with 500μl of PBS solution. Then the cells were centrifuged a 4 , 2000 rpm for 5 ℃ minutes and wash once again. The cells were resuspended in 200 μl PBS. 10 μl of cell solution was placed on the polylysine coated slide at room temperature for 5~10 minutes. Then the slide was washed with 4℃ PBS and dry at room temperature.
For membrane labeling, the slide coated cells was added 10 μl of 1 μM Alexa
Fluor 594 WGA for 5 minutes. Then the slide was washed with PBS to remove excessive dye and dry the slide. After the slide was dry, 75% glycerol was added on the slide and the cover glass was covered on it. The slide was sealed with nail polish. Then the samples were viewed with a fluorescence microscope or confocalmicroscope with a standard fluorescent filter. For cell wall labeling, the procedure was the same as above, but the cells were stained with 10 μl of Calcofluor white without litycase treating.
IV. Result
In this study, the CaENO1 gene of C. albicans was cloned into YEP363 plasmid (named YEP363-CaENO1-TP) and expressed in S. cerevisiae (10560-2B). In order to examine whether the protein was secreted, I modified the CaENO1gene with HAHIS and EGFP tags fused to 3’ end.
4.1 The CaENO1 gene was expressed in S. cerevisiae
4.1.1 The restriction enzyme map of the YEP363-CaENO1-TP plasmid
The YEP363-CaENO1-TP plasmid was made previously in the laboratory. It was
diagramed into a circular map about 10 kb (shown in the Figure 2A ) and composed of the CaENO1 gene tagged with HA3HIS6 tag, pACT1 promoter, Leu2 gene, lacZ gene, ampR (ampicillin resistance), and 2μ (origin of S. cerevisiae). For selecting the correct plasmid, the possible samples were subjected to Nde I restriction digestion. Accordingly, three DNA fragments of 1868 bp, 3022 bp and 5632 bp will be produced, as those in the band A, band B and band C in lane1-6 of Figure 2B. Lane 7 was undigested plasmid. The plasmid samples from lane 1-6 were in accord with the prediction and used for following experiments.
4.1.2 The expression of CaENO1 gene
The YEP363-CaENO1-TP plasmid was transformed into strain 10560-2B to
express CaENO1 gene, and this transformed strain was named 10560-2B-f1 in this study. The protein product of the CaENO1 gene tagged HA3HIS6 was about 53 kDa, named eno-tp (tp, tag protein HA3HIS6) in this study. To ensure the strain 10560-2B-f1 can express target protein eno-tp, I incubated the cells at 30 for 48 ℃
hours and broke them to extract the proteins. Then the protein sample was checked with western blot. If the protein was expressed in the cell, a signal in the protein sample will be detected at about 53 kDa by anti-HA-HRP antibody with western blot. In the western blot result shown in Figure 3, a signal correspond to the size of the protein sample was detected (band A near 55kDa in lane 1-4) and the positive control (E-tag, E-protein tagged with HAHIS tag was about 40 kDa) and negative control (the strain transformed YEP363 was named 10560-2B-f0 in this study) were in lane 5 and lane 6, respectively. According to this result, the protein eno-tp was in accord with the prediction. The positive control (E-tag) was extracted from E. coli, and it was detected at about 55 kDa (band A in lane 5) lager than the prediction in this experiment. It might be result from incompletely denaturing.
4.1.3 The secretion of the eno-tp
In order to detect the secreted eno-tp, the centrifugation of cultured medium was
collected and checked with western blot. If the protein was secreted outside the cell, a signal about 53 kDa would be detected in the medium by anti-His-HRP antibody with western analysis. In the western blot result shown in Figure 4, a signal was detected in the medium sample by anti-HA-HRP antibody (as shown in the band B’ in lane 3-6) at about 55 kDa. According to this result, the eno-tp can be secreted outside the S.
cerevisiae cell. The positive control (E-tag, E-protein tagged with HAHIS tag was
about 40 kDa) and the negative control was shown in lane 2 and lane 1, respectively. The positive control (E-tag) was detected at about 40 kDa ( the band A in lane 2 ) in accord with prediction, but also detected at about 55 kDa and 80 kDa (the band B and C in lane 2) larger than the prediction in this experiment. It might be result from the incompletely denaturing.
4.2 The analysis of CaENO1 -EGFP fusion protein
Because the eno-tp protein cannot be observed for its localization inside the cell,
CaENO1 gene was further tagged with Enhanced Green Fluorescent Proteins (EGFP)
for visualization in this study. The EGFP is a 29 kDaa recombinant protein with Ex/Em = 488/507 nm, and it is a powerful tool for the visualization of tagged proteins.
4.2.1 The construction of the expressed plasmid
For the construction, the EGFP gene was amplified by PCR from pEGFP-N2
plasmid. Two kinds of PCR products (XbaΙ-EGFP-XbaΙ and XbaΙ-EGFP-PstΙ) were obtained through two pairs of primers (EGFP-L-XbaⅠSpeⅠ, EGFP-R-XbaⅠ and EGFP-L-Xba ⅠSpe Ⅰ, EGFP-R- Pst Ⅰ) by PCR. The PCR products of
XbaΙ-EGFP-XbaΙ was predicted to be 739 bp (the band A in lane 1of Figure 5B) and Xba1-EGFP-Pst1 was predicted to be 742 bp, (the band B in lane 2 of Figure 5B).
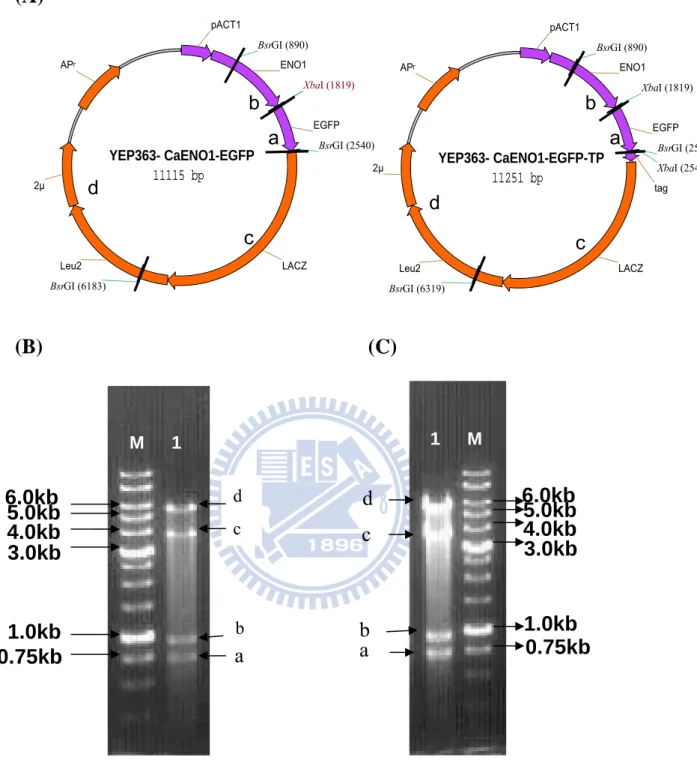
And then the PCR products as insert were ligated into vector (YEP363-CaENO1-TP plasmid) in frame to form recombinant plasmids. The diagram of construct was as shown in Figure 5A, and one of the construct was tagged with HA3HIS6 and the other not, named YEP363-CaENO1-EGFP-TP and YEP363-CaENO1-EGFP respectively in this study. The recombinant plasmids were checked by restriction enzyme digestion. The plasmid YEP363-CaENO1-EGFP was about 11115 bp and would be digested into four DNA fragments 721 bp, 929 bp , 5694 bp and 3771 bp ( the band a, b, c and d in lane1 of Figure 6B ) by XbaΙ and BsrGI. The plasmid YEP363-CaENO1-EGFP-TP was about 11251 bp and would be digested into four DNA fragments 721 bp, 929 bp, 3771 bp and 5830 bp DNA fragments ( the band a, b, c and d in lane1 of Figure 6C ) by XbaΙ and BsrGI. Both of them were in accord with the prediction. The recombinant
eno-EGFP-tp and eno-EGFPp (named in this study).
The S. cerevisiae strain transformed with the YEP363-CaENO1-EGFP-TP plasmid and YEP363-CaENO1-EGFP plasmid was named 10560-2B-f2 and 10560-2B-f3 in this study.
4.2.2 The expression of CaENO1-EGFP fusion protein
To ensure the strain 10560-2B-f2 and 10560-2B-f3 can express target fusion
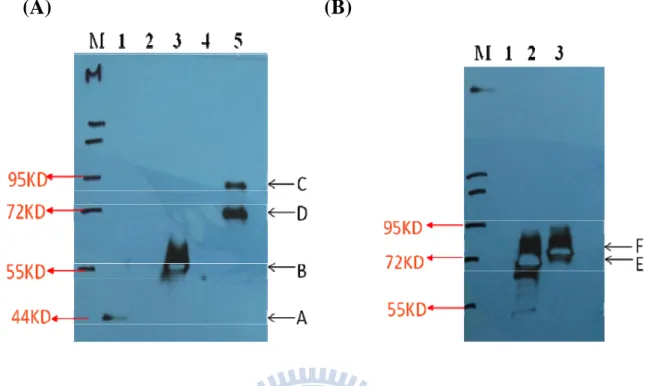
protein, eno-EGFP-tp and eno-EGFPp, the cells were incubated at 30 for 48 hours ℃ and broken to extract the protein sample. Then the protein sample was analyzed with western blot. The molecular weight of eno-EGFP-tp and eno-EGFPp was predicted to be about 79 kDa and 75kDa. If the fusion protein was expressed in the cell, the protein sample would be detected by antibody with western blot. In this experiment, two kinds of antibody (anti-HA-HRP antibody and anti-EGFP antibody) was used. The result with the anti-HA-HRP antibody was shown in Figure 7A. The positive control E-tag (the band A in lane 1) and the negative control was shown in lane 1 and lane 2, respectively. Tow signal in the sample of the eno-EGFP-tp was detected at about 79kDa and 72 kDa (band C and D in lane 4) and there was no signal for eno-EGFPp (lane 3). In addition, the result used anti-EGFP antibody was shown in Figure 7B, the eno-EGFPp was detected at about 75kDa (band E) in lane 2 and eno-EGFP-tp about 79kDa (band F) in lane 3. It follows that eno-EGFP-tp and eno-EGFPp were expressed in the cells.
4.2.3 The secretion of the CaENO1-EGFP fusion protein
In order to examine whether the EGFP fusion protein could be secreted outside the
S. cerevisiae cell, the centrifugate of cultured medium was collected and checked with
detected by antibody with western blot. In this experiment, two kinds of antibodies (anti-HA-HRP antibody and anti-EGFP antibody) were used.
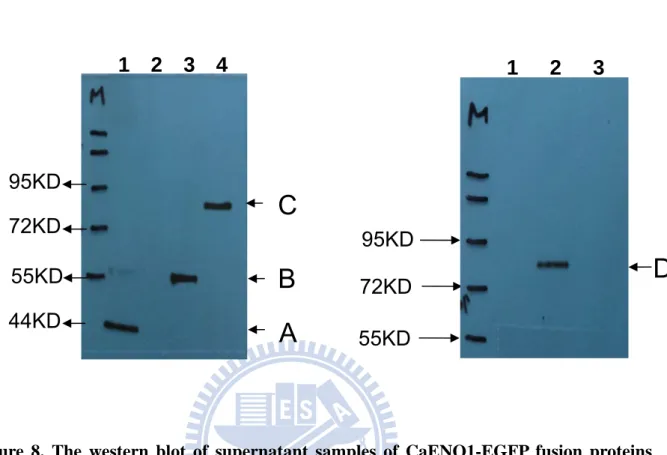
In Figure 8A (anti-HA-HRP antibody used), the eno-tp was detected at about 55kDa (band B in lane 2 ) and the eno-EGFP-tp was detected at about 79kDa (band C in lane 3); the positive control E-tag was about 40 kDa (band A in lane 1) and the negative control was in lane 2. In Figure 8B (anti-EGFP-HRP antibody used), the eno-EGFPp was detected at about 75kDa (band D in lane 2) and the eno-EGFP-tp can not be detected. Negative control was in lane 1.
According to the result, both eno-EGFP-tp and eno-EGFPp can be detected in the culture medium.
4.2.4 The fluorescence observation of CaENO1-EGFP fusion protein
To further examine whether the EGFP fusion protein could be expressed, I incubated the transformed cells at 30 for 48 hours℃ and observed under fluorescence microscope with 400X magnification.
As shown in Figure 9, 10560-2B-f2 (shown in B) and 10560-2B-f3(shown in C) were fluorescent under fluorescence microscope. 10560-2B-f0 (shown in A) was negative control in this data. It follows that the EGFP fusion protein was fluorescent.
4.3 The analysis of truncated CaENO1
In this experiment, in order to determine which region of CaENO1 gene was critical to secretion, I designed different constructs of truncated-CaENO1 fused to EGFP and compared their activities to the control construct. The diagram of this experiment was shown in Figure 10.
The fragments of truncated CaENO1 were amplified by PCR. I designed several
pairs of primers for PCR amplification of different length of truncated CaENO1. The PCR products were then treated with restriction enzymes for ligation with vector. The diagrams of constructs are shown in Figure 11.
4.3.1.1 The negative control YEP363-EGFP plasmid
For this construct, the vector and insert were ligated together to form the negative control plasmid named YEP363-EGFP in this study (shown in Figure 12A). The PCR products containing BamHI and SpeI site on 3’ and 5’end (band A in lane 1-2 of Figure 12B) as insert about 500 bp were obtained with primers ACT1-F and ACT1-R and then treated with BamHI and SpeI. The plasmid YEP363-CaENO1-EGFP, as vector, was also digested with restriction enzymes and then ligated with insert. The recombinant plasmid was checked by restriction enzyme digestion. The plasmid YEP363-EGFP was about 9783 bp and would be digested into two DNA fragments 3643 and 6140 bp ( the band a and d in lane1-2 of Figure 13B ) by BsrGI. The plasmid was in accord with the prediction.
4.3.1.2 The YEP363- CaENO1[1-150]-EGFP plasmid
For this construct, the YEP363-EGFP plasmid, as vector, was digested with restriction enzyme SpeI. The PCR product containing SpeI site on both 3’ and 5’end as insert was obtained with primers (eno/1-f and eno1/150R) and then treated by SpeI. It is about 150 bp (the band A in lane 1 of Figure 14B). The vector and insert were ligated together to form the recombinant plasmid named YEP363- CaENO1/[1-150]-EGFP in this study. The recombinant plasmid was checked by restriction enzyme digestion. The plasmid was about 9945 bp and would be digested into 871 bp, 3643 bp and 5431 bp DNA fragments (b, f and g in lane 1 of Figure 15B) by XbaΙ and BsrGI. The plasmid was in accord with the prediction.
For this construct, the YEP363-EGFP plasmid, as vector, was digested with restriction enzyme SpeI. The PCR product containing SpeI site on both 3’ and 5’end as insert was obtained with primers (eno/1-f and eno1/279R) by PCR and then treated by SpeI. It is about 279 bp (the band B in lane 2 of Figure 14B). The vector and insert were ligated together to form the recombinant plasmid named YEP363- CaENO1[1-279]-EGFP in this study. The recombinant plasmid was checked by restriction enzyme digestion. The plasmid was about 10074 bp and would be digested into 1000 bp, 3643 bp and 5431 bp DNA fragments (b, f and g in lane 2 of Figure 15B) by XbaΙ and BsrGI. The plasmid was in accord with the prediction.
4.3.1.4 The YEP363- CaENO1[1-387]-EGFP plasmid
For this construct, the YEP363-EGFP plasmid, as vector, was digested with restriction enzyme SpeI. The PCR product containing SpeI site on both 3’ and 5’end as insert was obtained with primers (eno/1-f and eno1/387R) by PCR and then treated by SpeI. It is about 279 bp (the band C in lane 3 of Figure 14B). The vector and insert were ligated together to form the recombinant plasmid named YEP363- CaENO1[1-387]-EGFP in this study. The recombinant plasmid was checked by restriction enzyme digestion. The plasmid was about 10182 bp and would be digested into 1108 bp, 3643 bp and 5431 bp DNA fragments (d, f and g in lane 3 of Figure 15B) by XbaΙ and BsrGI. The plasmid was in accord with the prediction.
4.3.1.5 The YEP363- CaENO1[1-510]-EGFP plasmid
For this construct, the YEP363-EGFP plasmid, as vector, was digested with restriction enzyme SpeI. The PCR product containing SpeI site on both 3’ and 5’end as insert was obtained with primers (eno/1-f and eno1/510R) by PCR and then treated by SpeI. It is about 279 bp (the band D in lane 4 of Figure 14B). The vector and insert were ligated together to form the recombinant plasmid named YEP363-
restriction enzyme digestion. The plasmid was about 10305 bp and would be digested into 397 bp, 843 bp, 3643 bp and 5431 bp DNA fragments (a, b, f and g in lane 4 of Figure 15B) by XbaΙ and BsrGI. The plasmid was in accord with the prediction. 4.3.1.6 The YEP363- CaENO1[280-1320]-EGFP plasmid
For this construct, the YEP363-EGFP plasmid, as vector, was digested with restriction enzyme SpeI. The PCR product containing SpeI site on both 3’ and 5’end as insert was obtained with primers (eno1/280F and eno/1320-r) by PCR and then treated by SpeI. It is about 1041 bp (the band E in lane 6 of Figure 14C). The vector and insert were ligated together to form the recombinant plasmid named YEP363- CaENO1[280-1320]-EGFP in this study. The recombinant plasmid was checked by restriction enzyme digestion. The plasmid was about 10837 bp and would be digested into 1644 bp, 3643 bp and 5550 bp DNA fragments (h, i and j in lane 5 of Figure 15B) by BsrGI. The plasmid was in accord with the prediction.
4.3.1.7 The YEP363- CaENO1[388-1320]-EGFP plasmid
For this construct, the YEP363-EGFP plasmid, as vector, was digested with restriction enzyme SpeI. The PCR product containing SpeI site on both 3’ and 5’end as insert was obtained with primers (eno1/388F and eno/1320-r) by PCR and then treated by SpeI. It is about 933 bp (the band G in lane 7 of Figure 14C). The vector and insert were ligated together to form the recombinant plasmid named YEP363- CaENO1[388-1320]-EGFP in this study. The recombinant plasmid was checked by restriction enzyme digestion. The plasmid was about 10729 bp and would be digested into 1644 bp, 3643 bp and 5442 bp DNA fragments (h, i and j in lane 6 of Figure 15B) by BsrGI. The plasmid was in accord with the prediction.
4.3.1.8 The YEP363- CaENO1[1-450]-EGFP plasmid
For this construct, the YEP363-EGFP plasmid, as vector, was digested with restriction enzyme SpeI. The PCR product containing SpeI site on both 3’ and 5’end
as insert was obtained with primers (eno/1-f and eno/450-r) by PCR and then treated by SpeI. It is about 450 bp (the band H in lane 8 of Figure 14D). The vector and insert were ligated together to form the recombinant plasmid named YEP363- CaENO1[1-450]-EGFP in this study. The recombinant plasmid was checked by restriction enzyme digestion. The plasmid was about 10245 bp and would be digested into 447 bp, 774 bp, 3643 bp and 5431 bp DNA fragments (l, m, r and s in lane 7 of Figure 15B) by XbaΙ and BsrGI. The plasmid was in accord with the prediction. 4.3.1.9 The YEP363- CaENO1[451-900]-EGFP plasmid
For this construct, the YEP363-EGFP plasmid, as vector, was digested with restriction enzyme SpeI. The PCR product containing SpeI site on both 3’ and 5’end as insert was obtained with primers (eno/451-f and eno/900-r) by PCR and then treated by SpeI. It is about 450 bp (the band H in lane 9 of Figure 14D). The vector and insert were ligated together to form the recombinant plasmid named YEP363- CaENO1[451-900]-EGFP in this study. The plasmid was about 10248 bp and would be digested into 1174 bp, 3643 bp and 5431 bp DNA fragments (n, r and s in lane 8 of Figure 15B) by XbaΙ and BsrGI. The plasmid was in accord with the prediction. 4.3.1.10 The YEP363- CaENO1[901-1320]-EGFP plasmid
For this construct, the YEP363-EGFP plasmid, as vector, was digested with restriction enzyme SpeI. The PCR product containing SpeI site on both 3’ and 5’end as insert was obtained with primers (eno/901-f and eno/1320-r) by PCR and then treated by SpeI. It is about 420 bp (the band I in lane 10 of Figure 14D). The vector and insert were ligated together to form the recombinant plasmid named YEP363- CaENO1[901-1320]-EGFP in this study. The plasmid was about 10218 bp and would be digested into 1144 bp, 3643 bp and 5431 bp DNA fragments (n, r and s in lane 9 of Figure 15B) by XbaΙ and BsrGI. The plasmid was in accord with the prediction.
For this construct, the YEP363-EGFP plasmid, as vector, was digested with restriction enzyme SpeI. The PCR product containing SpeI site on both 3’ and 5’end as insert was obtained with primers (eno/1-f and eno/900-r) by PCR and then treated by SpeI. It is about 900 bp (the band J in lane 11 of Figure 14D). The vector and insert were ligated together to form the recombinant plasmid named YEP363- CaENO1[901-1320]-EGFP in this study. The plasmid was about 10695 bp and would be digested into 397 bp, 1224 bp, 3643 bp and 5431 bp DNA fragments (k, n, r and s in lane 10 of Figure 15B) by XbaΙ and BsrGI. The plasmid was in accord with the prediction.
4.3.1.12 The YEP363- CaENO1[451-1320]-EGFP plasmid
For this construct, the YEP363-EGFP plasmid, as vector, was digested with restriction enzyme SpeI. The PCR product containing SpeI site on both 3’ and 5’end as insert was obtained with primers (eno/451-f and eno/1320-r) by PCR and then treated by SpeI. It is about 869 bp (the band K in lane 12 of Figure 14D). The vector and insert were ligated together to form the recombinant plasmid named YEP363- CaENO1[451-1320]-EGFP in this study. The plasmid was about 10668 bp and would be digested into 1594 bp, 3643 bp and 5431 bp DNA fragments (q, r, sin lane 11 of Figure 15B) by XbaΙ and BsrGI. The plasmid was in accord with the prediction.
All of above plasmids were transformed into 10560-2B strain to expressed truncated CaENO1-EGFP fusion protein. The transformed strain was named according to its target plasmid in this study; for example, the 10560-2B-CaENO1[1-150] strain was transformed by the YEP363- CaENO1[1-150]-EGFP plasmid.
4.3.2 The analysis of the truncated CaENO1-EGFP fusion protein
The expressed protein was named according to the remaining region of CaENO1
express eno[1-150]-EGFPp. To ensure the target protein was successfully expressed in
S. cerevisiae, I incubated the transformed cells at 30 for 48 hours and broke℃ them to extract the protein sample for western blot analysis.
4.3.2.1 The expression of recombinant protein
The protein of eno[1-150]-EGFPp was predicted to be about 31 kDa and there was a signal at the corresponding location (the band A in lane 1 of Figure 16). In addition, there was a lower weight signal near 26 kDa in lane 1. From this, it seems that the protein might be degraded. The sample of eno[1-279]-EGFPp was predicted to be about 36 kDa. The result of western blot showed that it was about 43kDa (the band B in lane 2 of Figure 16), which is larger than prediction. It seems that the protein might be modified. The protein of eno[1-387]-EGFPp was predicted to be about 40 kDa (the band C in lane 3 of Figure 16) and there was a signal at the corresponding location. In addition, there was a lower weight signal near 34 kDa in lane 3. From this, it seems that the protein was expressed but also degraded. The protein of eno[1-450]-EGFPp was predicted to be about 43 kDa (the band D in lane 4 of Figure 16) and there was a signal at the correct location. In addition, there were lower signals near 34 kDa and 26 kDa in lane 4. From this, it seems that the protein was expressed but also degraded. The sample of eno[1-510]-EGFPp was predicted to be about 45 kDa (the band E in lane 5 of Figure 16) and there was a signal at the correct location. In addition, there were lower signals near 34 kDa and 26 kDa in lane 5. From this, it seems that the protein was expressed but also degraded. The sample of eno[1-900]-EGFPp was predicted to be about 59 kDa (the band F in lane 6 of Figure 16) and there was a signal at the correct location. The protein was expressed in S. cerevisiae. The sample of EGFPp was predicted to be about 27 kDa (the band G in lane 7 of Figure 16) and there is a signal at the correct location. The protein was expressed in S. cerevisiae.