國
立
交
通
大
學
財務金融研究所
碩
士
論
文
研究發展活動與公司經營績效之研究-
比較亞太、歐洲與北美三個地區之差異
R&D Expenditures and Firm performances:
Comparison among Asia Pacific, Europe and North America
研 究 生:蔡志賢
指導教授:王淑芬 副教授
陳安斌 副教授
研究發展活動與公司經營績效之研究-
比較亞太、歐洲與北美三個地區之差異
R&D Expenditures and Firm performances:
Comparison among Asia Pacific, Europe and North America
研 究 生:蔡志賢 Student:Jhi-Shen Tsai
指導教授:王淑芬 Advisor:Sue-Fung Wang
陳安斌 Advisor:An-Pin Chen
國 立 交 通 大 學
財務金融研究所
碩 士 論 文
A ThesisSubmitted to Institute of Finance College of Management National Chiao Tung University in partial Fulfillment of the Requirements
for the Degree of Master
In
Finance
June 2004
Hsinchu, Taiwan, Republic of China
研究發展活動與企業經營績效之研究-
比較亞太、歐洲與北美三個地區之差異
學 生:蔡志賢 指 導 教 授:王淑芬
陳安斌
國立交通大學財務金融研究所碩士班
摘 要
本研究主要目的是分析比較亞太、歐洲與北美的高科技產業 R&D 的投入對經營績 效的影響。關於公司績效衡量指標的選取,本研究同時採用以市場資訊與會計盈餘為基 礎的衡量指標,Tobin’s q 和 ROA。特別是 Tobin’s q,在文獻上常被用來衡量企業的無 形資產,例如:R&D 費用。然而,R&D 投入的效率會因產業別不同而有不一樣的結果, 因此本研究進一步的分析是否 R&D 的投入在這三個地區會因產業別不同而有不一樣的 結果。本研究結果如下:R&D 密集度(R&D 費用除以銷貨收入)平均而言,北美是最高 (13%),其次為歐洲(7%),最低的地區是亞太(3%)。在控制了其它相關的因素後,廻歸 的結果顯示在這三個地區的高科技產業 R&D 的投入對於 Tobin’s q 有正的且一致的影 響,尤其是北美地區更為顯著。至於 ROA 的廻歸結果顯示 R&D 的投入與 ROA 為負相 關且顯著。在本質上,因為 R&D 為費用,因此短期而言會稀釋公司的盈餘,但長期而 言是有助於公司的成長。最後廻歸也顯示了個別的高科技產業 R&D 的投入與經營績效 的關係存在著顯著的差異。因此,這些結果意味著在決定公司的經營績效 R&D 的投入 扮演著非常重要的角色,尤其是北美的高科技產業。R&D Expenditures and Firm performances:
Comparison among Asia Pacific, Europe and North America
Student: Jhi-Shen Tsai Advisors:Dr. Sue-Fung Wang
Dr. An-Pin Chen
Institute of Finance
National Chiao Tung University
ABSTRACT
The purpose of this study is to investigate the impact of R&D on firm’s performances within the Asia Pacific, Europe and North America high-tech industries. Regarding the firm performance measures, this study simultaneously utilizes market- and accounting-based measures of the firm performance, Tobin’s q and ROA. In particular, Tobin’s q used to measure intangible assets of firms such as R&D expenditures. Since industries differ widely in the effectiveness of R&D, this paper further investigates whether R&D investment influences firm performances differently among the three regions based on three high-tech industries. The results show that R&D expenditures as a percentage of sales are, on average, greater for North America firms (13%) than for Europe (7%) and Asia Pacific firms (3%). Regression results show that after controlling for firm-related factors, R&D expenditures are found to have a persistently positive effect on the Tobin’s q among the three regions, with a more pronounced effect for North America. For ROA regressions, R&D intensity is negatively correlated with ROA. The benefits of R&D are long term in nature and could adversely affect short-term profitability. The results further show that there exist notable differences in R&D determinants in the three high-tech industries across regions. These results suggest that R&D expenditures play an important role in determining the firm’s performances in the high-tech industries across regions, especially in North America.
誌 謝
在碩士兩年期間內,本論文得以如期完成,首先必須感謝恩師王淑芬
與陳安斌老師。自主題選定、論文架構的建立與思考方向等諸多的指引,
並於論文撰寫期間內不斷地給予耐心親切的指導,感激之情莫可言喻,在
此謹向王老師與陳老師致上由衷的敬意謝忱。
其次,感謝口試委員張國平博士、李堯賢博士、梁馨科博士等先進們
的不吝指正,使我的論文更為周延。
最後謹以本論文獻給為我奉獻最多的祖父母、雙親、胞兄、叔叔與女
友家欣。尤其是我敬愛的阿公,生前常鼓勵我們兄弟多讀書。可惜,在我
考上碩士班那年,他就與世長辭,以致無緣親睹這番成果。在此,將我的
碩士論文與學位,獻給我敬愛的家人和女友,謝謝您們!
蔡 志 賢 謹誌
中華民國九十三年六月二十三日
Table of Contents
Abstract ……… i Acknowledgement ……… iii Table of Contents ……… iv List of Tables ……… v List of Figures ……… vi 1 Introduction……… 1 2 Literature Review……… 52.1 Relationship between R&D expenditures and Firm Performances……… 5
2.2 Related to literature with Tobin’s q……… 7
3 Research design and Methodology ……… 8
3.1 Selection of sample……… 8
3.2 Variables and their measurement……… 10
3.2.1 Firm performances with ROA and Tobin’s q……… 10
3.2.2 R&D intensity and Control variables……… 12
3.3 Statistical Analyses……… 14
4 Empirical results……… 14
4.1 Descriptive statistics……… 14
4.2 Results for Correlation analysis……… 20
4.3 Results for regressions analysis……… 23
4.3.1 Comparative Results among the Asia Pacific, Europe and North America 23 4.3.2 Industry Effects among the three regions……… 25
5 Conclusion……… 33
Reference ……… 35
List of Tables
Table 1.1 Gross domestic expenditure on R&D……… 2
Table 3.1 Industry composition by countries……… 9
Table 4.1 All firms-years by region……… 17
Table 4.2 Three high-tech industries by region……… 18
Table 4.3 Pearson correlations among study variables……… 21
Table 4.4 Variance Inflation Factor (V.I.F)……… 22
Table 4.5 OLS regressions of Tobin's q and ROA on R&D intensity and control variables by each region……… 29
Table 4.6 OLS regressions of Tobin's q and ROA on R&D intensity and control variables in SIC 28 industries……… 30
Table 4.7 OLS regressions of Tobin's q and ROA on R&D intensity and control variables in SIC 35 industries……… 31
Table 4.8 OLS regressions of Tobin's q and ROA on R&D intensity and control variables in SIC 36 industries……… 32
List of Figures
Figure 1.1 Share of total R&D among the three regions……… 3
Figure 4.1 Average Tobin’s q among the three regions……… 19
Figure 4.2 Average ROA among the three regions……… 19
1. Introduction
Corporate research and development (R&D) investment plays a pivotal role in a firm’s future growth. R&D expenditures normally result in new product(s) and techniques that help a firm develop and sustain its competitive advantage, to increase market share, or to penetrate new markets. Finance and economics literature has documented that a firm’s R&D investment has a positive and consistent influence on the market valuation of the firm (see Chan et al., 1990; Chauvin and Hirschey, 1993; Lee and Shim, 1995; Szewczyk et al., 1996; Bae and Seungwook, 2001). Lee and Shim, 1995, for example, show that the relationship between R&D activity and market growth in high-tech industries is positive and significant in both United States and Japan over a 5-year period from 1986 through 1990. While the evidence on the effectiveness of R&D investments is abundant, little attention has been given to the R&D activities of the firms or industries across regions such as Asia Pacific, Europe and North America. This paper intends to fill this gap.
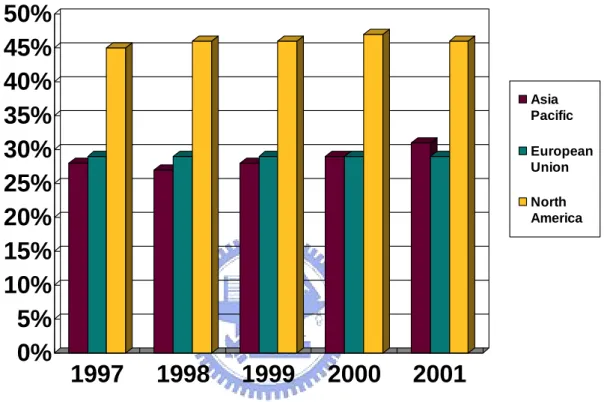
The worldwide distribution of R&D performance is concentrated on relatively few industrialized nations. Of the $638 billion in estimated 2001 R&D expenditures for the 30 OECD1 countries, fully 81 percent is expended in only G-7 countries (see Table 1.1). These estimates are based on reported R&D investments converted to U.S. dollars with purchasing power parity (PPP) exchange rates2. The North America (U.S. and Canada) continually accounts for roughly 45 percent, European Union accounts for 29 percent and Asia Pacific3
1 Current OECD members are Australia, Austria, Belgium, Canada, the Czech Republic, Denmark, Finland, France, Germany, Greece, Hungary, Iceland, Ireland, Italy, Japan, South Korea, Luxembourg, Mexico, the Netherlands, New Zealand, Norway, Poland, Portugal, the Slovak Republic, Spain, Sweden, Switzerland, Turkey, the United Kingdom, and the United States.
2 Although PPPs technically are not equivalent to R&D exchange rates, they better reflect differences in countries’ research costs than do market exchange rates.
accounts for 30 percent of all OECD member countries’ R&D investments4 (see Figure 1.1). In particular, U.S. R&D investments continue to outdistance by 150 percent R&D investments made in Japan, the second largest R&D-performing country. The United States not only spent more money on R&D activities in 2001 than any other country but also spent as much by itself as the rest of the G-7 countries.
Table 1.1 Gross domestic expenditure on R&D (millions of current PPP dollars)
1997 1998 1999 2000 2001 United States 212,690.3 226,767.1 244,023.8 265,194.0 274,757.6 Canada 12,456.3 13,483.1 14,666.5 16,193.4 17,408.6 Japan 90,754.4 90,507.6 92,773.7 98,320.2 103,845.4 China 25,384.3 27,938.6 35,985.2 48,509.2 57,144.0 South Korea 16,181.8 14,446.0 15,792.6 18,939.6 22,009.2 Taiwan 7,859.2 8,600.3 9,616.8 10,326.0 10,901.9 Singapore 1,115.7 1,358.0 1,576.2 1,810.5 1,972.0 G-7 423,461.4 442,548.3 471,487.1 508,757.7 515,557.7 European Union 143,841.0 150,527.0 162,520.0 175,713.0 187,210.0 Total OECD 500,438.8 521,003.0 557,056.0 604,341.0 638,411.5 SOURCE: RAND, based on OECD, Main Science and Technology Indicators: 2004-2 Edition.
Another indicator of a country’s commitment to growth in science and technology is the ratio of R&D spending to the GDP. According to the most-recent data from the OECD5, Sweden has the highest R&D-to-GDP ratio, followed by Finland, Iceland, Japan, South Korea and United States. Other large R&D performers in the OECD, including Switzerland, Germany, Denmark, France, Belgium, and Austria, all invest smaller shares of their GDP in
(Non-OECD members).
4 Most of the R&D data presented here are from reports to OECD, the most reliable source of such international comparisons.
R&D than the United States. Of the non-OECD member countries, Israel and Taiwan’s R&D-to-GDP ratios compare favorably with those of the OECD member countries. Although China and Russia spend a lot in absolute terms on R&D, their investments in R&D as shares of their GDPs are substantially lower than that of the OECD member countries.
0%
5%
10%
15%
20%
25%
30%
35%
40%
45%
50%
1997
1998
1999
2000
2001
Asia Pacific European Union North AmericaFigure 1.1 Share of total R&D among the three regions
Absolute levels of R&D expenditures are indicators of the breadth and scope of a nation’s scientific and technological (S&T) activities and are a harbinger of future growth and productivity. Indeed, investments in the R&D enterprise strengthen the technological base on which economic prosperity increasingly depends worldwide. As we have seen, North America, especially, the United States has led the world in total spending on R&D in contrast with Europe and Asia Pacific. At present, however, five other nations (Sweden, Finland and Iceland from Europe; Japan and South Korea from Asia Pacific) spend more of their GDP on R&D than does the United States. Accordingly, since the differences in absolute and relative
(R&D-to-GDP ratio) levels of R&D expenditures, whether R&D investment influences firm performances differently among North America, Europe and Asia Pacific.
Regarding the firm performance measures, most studies show the ROA and Tobin’s q are the key variables. This paper simultaneously utilizes market- and accounting-based measures of the firm performance, Tobin’s q and ROA, the two alternative measures of performance, one is based on market based measure and the other is based on accounting measure of performance. In particular, Tobin’s q (defined as the ratio of the market value to replacement values of a firm’s assets) has been used to explain a wide variety of phenomena. Tobin (1969) argues that q measures profitable investment opportunities. Lindenberg and Ross (1981) use q as a measure of the capitalized value of monopoly rents. Cockburn and Griliches (1988) and Griliches (1981) relate q to intangible capital. The purpose of this study is to investigate whether measures of R&D expenditure contribute significantly to variation in q and ROA differently among North America, Europe and Asia Pacific.
Several previous studies have demonstrated that there is merit in investigating this issue in industry studies. Examples are as follows: Megna and Klock, 1993 (investigating semiconductors); Chauvin and Hirschey, 1993 (investigating manufacturing and non-manufacturing sectors); Megna and Klock, 1993 (investigating semiconductors); Megna and Klock, 2000 (investigating wireless communications); and Christoffersen, 2002 (investigating textiles). In these different industries, R&D activity is considered one of the most important parts of maintaining a lead, especially, in high-tech industries (e.g., chemicals, drugs, electric and electronics, and machinery). Specifically, R&D activity seems to substantially contribute to high-tech industries in gaining competitive advantage as well as superior market performance (Tassey, 1983). For the reason, there are three different high-tech industries employed in our study, which are Chemicals & Pharmaceutics, Machinery & Computer Hardware and Electrical & Electronics, respectively.
Finally, because industries differ widely in the effectiveness of R&D, even if all industries from high-tech industries, studies that include data from various industries are flawed by too much aggregation. Hence, the paper also examines whether R&D investment influences Tobin’s q and ROA differently among North America, Europe and Asia Pacific based on industries classified according the Chemicals, Machinery and Electrical.
The remainder of the paper is organized as follows. The section 2 reviews relevant literature on R&D expenditures and firm performances. The section 3 describes research design and methodology. The section 4 presents empirical results and provides analysis. The section 5 concludes the paper.
2. Literature review
2.1. R&D expenditures and Firm performances
Most of the previous empirical findings suggest that R&D investment has a positive impact on firm’s performances such as, market value, market share, market growth in sales and Tobin’s q. Chan et al. (1990) find that share-price responses to 95 announcements of increased R&D spending are significantly positive even when the announcement occurs in the face of an earning’s decline. These results suggest that investors look beyond the short term earning’s impact of major strategic investment when valuing a firm’s stock. Chauvin and Hirschey (1993) also find a significant and positive relationship between R&D expenditures and market value of approximately 1500 US firms over a 3-year period from 1988 through 1990. Their results suggest that investors evaluate the R&D effort of firms with a long-term perspective. Lee and Shim (1995), show that the relationship between R&D activity and market growth in high-tech industries is positive and significant in both United States and Japan over a 5-year period from 1986 through 1990. Szewczyk et al. (1996) document significant positive
announcement effects associated with increases in firms’ R&D and investment opportunities. They also report a significant relationship of the market’s response to R&D announcements to the firm’s debt ratio and the level of institutional ownership. Bae and Seungwook (2001) examine the effect of the degree of a firm’s multinationality on the firm’s R&D activities. They show that R&D expenditures as a percentage of sales are, on average, significantly greater for Multinational corporations (MNCs) than for domestic corporations (DCs), indicating that MNCs are on average, more R&D intensive. After controlling for firm and market-related factors, R&D expenditures are found to have a persistently positive effect on the market value of both DCs and MNCs, with more pronounced effect for MNCs.
Several studies have used q to measure specific intangible assets, by taking the predicted value from a regression of Tobin’s q on accounting or survey measures of the intangible asset of interest. Examples are Hall (1993); Megna and Klock (1993, 2000); Cockburn and Griliches (1988); Wernerfelt and Montgomery (1988); Bharadwaj et al (1999); Christoffersen (2002); Villalonga (2004). For example, Megna and Klock (2000), investigate the measurement and valuation of intangible capital in the wireless telecommunications industry. Four specific sources of intangible capital are investigated: advertising, research and development (R&D), radio spectrum licenses, and measures of installed customer base. All four sources of intangible capital explain a statistically significant portion of the variation in Tobin’s q, but the variation explained by R&D is subsumed by that explained by licenses. Together, licenses and advertising explain over 60% of the variation in q, and licenses are the much more powerful predictor of the two. Bharadwaj et al (1999), however, show the coefficient for R&D in a model with Tobin’s q as the dependent variable is negative.
The general consensus of the previous studies is that R&D investment increases the firm performance such as, market value, market share, market growth in sales and Tobin’s q. A firm’s R&D activities may work as intangible capital stocks, barriers to entry for other firms,
or market demand factors that bring positive values to a firm’s performances.
2.2. Related to literature with Tobin’s q
When Tobin (1969) first introduced the concept of q (defined as the ratio of the market value to replacement values of a firm’s assets), his intent was to capture a firm’s propensity to invest. Since that time, it is used in the literature as a proxy for a number of diverse corporate phenomena, such as the relationship between managerial equity ownership and firm value (Morck, Shleifer and Vishy 1988 and Cui and Mak 2002), the measure of investment opportunities (Szewczyk et al 1996), industry concentration (Wernerfelt and Montgomery 1988), corporate diversification (Lang and Stulz 1994), information technology (IT) investments (Bharadwaj et al 1999) and research and development (Cockburn and Griliches 1988; Megna and Klock 1993) has also been examined using the Tobin’s q. In particular, the q ratio has been used as a measure of firm’s intangible value. The use of q for measuring intangible value is based on the assumption that the long-run equilibrium market value must be equal to the replacement value of its assets, giving a q value close to unity. Deviations from this relationship (where q is significantly greater than one) are interpreted as signifying an unmeasured source of value, and generally attributed to the intangible value of the firm investments (Bharadwaj et al 1999). Several studies have also explored the relationship q and intangible value to examine the effects of factors such as R&D, patents and IT that are considered to contribute significantly to a firm’s intangible value (Megna and Klock 1993; Hall 1999; Bharadwaj et al 1999).
Tobin’s q typically estimated using one of two competing approaches. The first, referred as the computationally costly approach, uses an extensive of financial statement information as a starting point for estimating both market and replacement values. The data are then adjusted for factors that are likely to cause systematic divergences between market and accounting values. A typical representative is Lindenberg and Ross (1981) approach that in the approach,
market price are collected for each traded financial claim (i.e., common stock, debt, or preferred stock) of the firm. The market values for each claim are then summed as an estimate of the market value of the entire firm. The replacement value of the firm is estimated by adjusting the book value of assets for cumulative inflation and depreciation occurring between the time fixed assets are placed in service and the present. Although this approach results in the most defensible estimate of the market value of the firm, it has enjoyed limited use because of the lack of widespread availability of machine-readable data sources for market prices of corporate debt and preferred stock claims. In contrast, the second approach, referred to as the simple approach, uses a comparatively small set of financial statement data with minimal adjustments. A typical representative is Chung and Pruitt (1994) approach, the advantage of this approach is that it uses a simple formula that requires financial and accounting information available from the Compustat database and is highly correlated with q calculated by using the more traditional Lindenberg and Ross’s approach, more detail discussion will be presented in the next chapter.
3. Research design and Methodology
3.1. Selection of sample
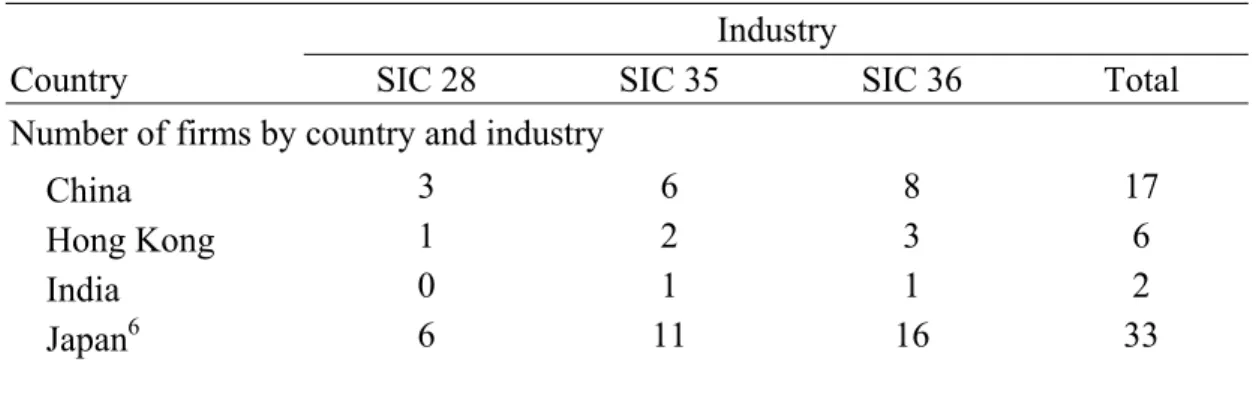
Our sample consists of 634 firms from three different high-tech industries in twenty countries from Asia Pacific, Europe and North America over the period of 1996 to 2002. Data for all accounting variables are obtained primarily from the Compustat database of Global Vantage which offers a world-class research solution for analyzing global marketplace. The three high-tech industries include Chemicals & Pharmaceutics, Machinery & Computer Hardware and Electrical & Electronics which SIC codes are 28, 35 and 36, respectively.
employed ratios of R&D expenditures to sales (Chauvin and Hirschey, 1993; Lee and Shim, 1995). The industries represented in the sample are presented in Table 3.1. The industries which are presented in relatively greater portions are “Electric and electronics” (279 firms or 44%), “Machinery” (242 firms or 38%) and “Chemicals” (113 firms or 18%) respectively.
The following criteria are used to determine the final sample in this research.
(1). All firms are included in Compustat database of Global Vantage and the accounting data required for the study variables are reported in Compustat database of Global Vantage.
(2). All firms have a December fiscal year end each year. This criterion is set because Smith and Pourciau (1988) show that firms with December fiscal year end and non-December fiscal year end have significant differences in financial characteristics. We choose only the firms with December fiscal year end as our sample to reduce noise and to ensure comparable return periods for all firms.
(3). 102 observations with Tobin’s q and ROA outside of three standard deviations of the mean are deleted in each of the three two-digit SIC code industries for each region separately. (4). Correct data for the study variables for each firm from year 1996 to 2002.
Excluding firms with missing accounting information resulted in a final sample consists of 2748 firm-year observations.
Table 3.1 Industry composition by countries
Industry
Country SIC 28 SIC 35 SIC 36 Total Number of firms by country and industry
China 3 6 8 17
Hong Kong 1 2 3 6
India 0 1 1 2
Japan6 6 11 16 33
6 Note: Most of the firms (About 90%) in Japan have a March fiscal year in Compustat database, so that they are not being included in our samples.
Korea 6 4 6 16 Malaysia 0 0 4 4 Singapore 1 8 4 13 Taiwan 13 22 19 54 Asia Pacific 30 54 61 145 Belgium 3 1 3 7 Denmark 2 1 3 6 Finland 3 10 6 19 France 6 6 6 18 Germany 7 26 17 50 Netherlands 3 5 2 10 Norway 0 3 3 6 Sweden 0 10 10 20 Switzerland 7 14 6 27 United Kingdom 7 16 20 43 Europe 38 92 76 206 Canada 6 4 13 23 USA 39 92 129 260 North America 45 96 142 283 Total 113 242 279 634
Note, SIC 28, Chemicals & Pharmaceutics; SIC 35, Machinery & Computer Hardware; SIC 36, Electrical & Electronics.
3.2. Variables and their measurements
3.2.1. Firm performances with ROA and Tobin’s q
Regarding the firm performance measures, most studies show the ROA and Tobin’s q are the key variables. This paper simultaneously utilizes market- and accounting-based measures of the firm performance, Tobin’s q and ROA, the two alternative measures of performance, one is based on market based measure and the other is based on accounting measure of performance. The accounting based measure of the performance of firms is ROA (Return on Assets) which is one of the most widely employed measures of the performance and it has been shown to be related to a variety of other indicators of financial performance for firms (Keats and Hitt 1998). The Return on Assets is calculated as income before extraordinary
items, divided by total assets.
The market measure used is Tobin’s q which is defined as the ratio of the market value of a firm’s debt and equity to the replacement costs of its assets. Following earlier research, the paper uses Tobin’s q to measure resource intangibility. From an empirical point of view, it is well known that Tobin’s q proxies for the intangible assets of firms as a result of the accounting treatment of intangibles (Lev, 2001). Tangible assets are capitalized, i.e. recognized as assets and reported on firms’ balance sheets. In contrast, intangibles are expensed, i.e. written off in the income statement along with regular expenses such as wages, rents, and interests. As a result, the book value of assets does not reflect the stock of intangibles that results from cumulative investment, but market value does. The empirical association between q and intangibility is evident from studies such as Lindenberg and Ross (1981), which reveal that the q’s of firms in R&D or advertising-intensive industries are abnormally high. In fact, it is a fairly common practice in studies that use Tobin’s q as a measure of firm performance to “correct” the denominator of q for the presence of such intangibles. Supposing q greater or less than one implies market disequilibrium or “an unmeasured source of rents driving a wedge between the market and book value of assets.” Investment in R&D may be such a wedge. If the stock market expects future pay-offs from the R&D, stock prices will increase, driving q above one.
Although various methods have been proposed for calculating the q ratio, according to Chung and Pruitt (1994), different approaches tend to yield similar value for q ratio. In this study, we use Chung and Pruitt’s method to calculate q ratio. The main advantage of this method is that it used a simple formula that requires financial and accounting information available from the Compustat database and is highly correlated with q calculated by using the more traditional Lindenberg and Ross’s method (1981). This estimator is computed as:
MVE + PS + DEBT q
TA Approximate =
Where MVE is the product of a firm’s share price and the number of common stock shares outstanding, PS is the book value of the firm’s preferred stocks, DEBT is the value of the firm’s short-term liabilities net of its short-term assets, plus the book value of the firm’s long term debt, and TA is the book value of the total assets of the firm.
3.2.2. R&D intensity and Control variables
To measure R&D intensity, the paper follows previous empirical studies employing the ratios of R&D expenditures to sales (Chauvin and Hirschey, 1993; Lee and Shim, 1995). This section examines the influence of R&D activities on firm performances among Asia Pacific, Europe and North America. The performance of a firm may also be affected by factors other than R&D such as Firm size, Growth, Leverage and Capital intensity. Given below are discussions on these four factors which are used as control variables in cross-sectional regression analysis.
The potential impact of firm size on the performance of firms is allowed for by the inclusion of the logarithm of total asset. A firm’s size potentially affects performance through at least two different avenues. First, the economies of scale which accompany size enables the firm to create entry barriers with the associated beneficial effects on the performance of firms. Second, there is a potential financing effect, in that larger firms may find it easier to generate funds internally and to access funds from external sources. A reduced financing constraint allows the firm to make greater use of profitable projects.
Following the comments of Mork et al. (1988) and McConnell and Servaes (1995), we include a variable to capture firm growth (GROWTH, measured as the percentage annual change in sales, averaged over the sample period) to control for the impact of growth on the firm’s performance and for potential linkages between the firm’s performance, financing structure and growth.
a theoretical perspective, this impact is noticeably rooted in the binding nature of debt: debt financing raises the pressure on managers to perform, because it reduces the moral hazard behavior by reducing “free cash-flow” at the disposal of managers (Jensen 1986). Consequently, the firms with the higher leverage should be the most inclined to improve their performance. However, a higher leverage means higher agency costs because of the diverging interests between shareholders and debt-holders: this moral hazard problem suggests that leverage may be negatively associated with performance (Jensen and Meckling 1976). Thus, the literature provides opposing arguments regarding the relationship between leverage and performance.
Capital expenditures are important corporate strategic investments and are provided for projects such capacity expansions, plant modernization, as well as general expenditure to update equipment7. McConnell and Muscarella (1985) examine the market reaction to capital expenditure decisions by industrial and public utility firms. They find that announcements of increase (decrease) in capital expenditures lead to significant positive (negative) stock returns for industrial firms. For public utility firms, however, they find that announcements of capital expenditure decisions do not have any material effect on stock returns. Chung, Wright and Charoenwong (1998) find that announcements of increase (decrease) in capital expenditures positively (negatively) affect the stock prices of firms with valuable investment opportunities. Contrarily, they predict that announcement of increase (decrease) in capital spending negatively (positively) affect the share prices of firms without such opportunities.
3.3. Statistical Analyses
Based on the above-mentioned considerations, the following cross-sectional regression model is estimated separately for Asia Pacific, Europe and North America samples to examine the influence of R&D investment on the Tobin’s q and ROA values of firm i. The standardized
7 Capital expenditures can be categorized as follow: general capacity expansion construction (including mining and exploration), plant modernization projects, and general increases in capital budgets (Woolridge 1988).
multiple regression analysis is used to estimate the following equations:
, 0 1 i,t 2 i,t 3 i,t 4 i,t
5 i,t t
Tobin's q β + β R&D intensity + β Firm Size + β Growth + β Leverage +β Capital intensity +ε (1)
i t =
, 0 1 i,t 2 i,t 3 i,t 4 i,t
5 i,t t
ROA β + β R&D intensity + β Firm Size + β Growth + β Leverage +β Capital intensity +ε (2)
i t =
Whereqi,t = Tobin's q for firm i in year t;
i,t
ROA = Income before extraordinary items, divided by total assets for firm i in year t;
i,t
R&D intensity = R&D expenditure divided by sales for firm i in year t;
i,t
Firm Size = Natural logarithm of total assets for firm i in year t;
i,t
Growth = Percentage growth rate of total sales for firm i in year t;
i,t
Leverage = Book value of total liabilities divided by total assets for firm i in year t;
i,t
Capital intensity = Capital expenditure divided by total assets for firm i in year t;
= An i.i.d. error term with zero mean;
t
ε
Equation (1) and (2), Tobin’s q and ROA are dependent variables for the measurement models. As to R&D intensity, Firm size, Growth, Leverage and Capital intensity are all independent variables.
4. Empirical results
4.1. Descriptive statistics
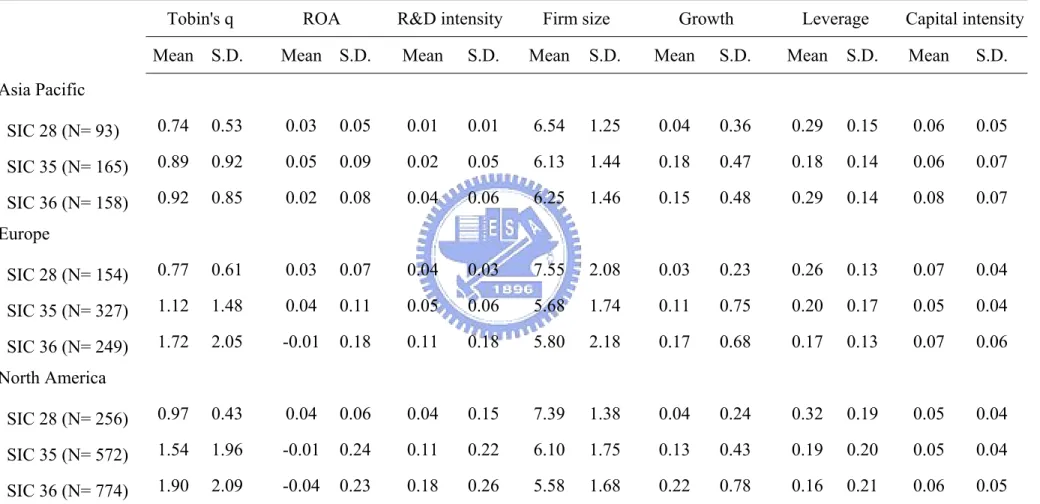
Table 4.1 reports descriptive statistics for firm performances, R&D intensity and control variables for all firms-years by each region and each two-digit SIC code industry (Table 4.2) for each region separately. Conforming to analyze financial statement data, the most extreme observations with Tobin’s q and ROA outside of three standard deviations of the mean are deleted in order to mitigate the influence of outliers.
(0.68), compared to 1.25 (0.73) for Europe firms and 1.62 (1.02) for the North America firms. It is obvious that these variables are significantly different from each other. However, the mean ROA of the North America firms is -0.01. Both Asia Pacific and Europe samples have a significantly higher mean ROA: 0.03 for the Asia Pacific and 0.02 for the Europe. In Table 4.2, on average, the Tobin’s q of the three high-tech industries in North America firms are greater than the same SIC code industry in Europe and Asia Pacific, but there are different results on ROA.
It is interesting to note that the higher q and the lower ROA among the three regions. This is especially noteworthy in the case of North America, the negative ROA but the highest q, implies that short-term profitability for the stock market investors in North America is not the key consideration in the market valuation of high-tech firms. However, the lowest q but highest ROA in Asia Pacific, indicate investors are more conservative with firm long-term profitability, even if firms, on average, have the highest short-term profitability.
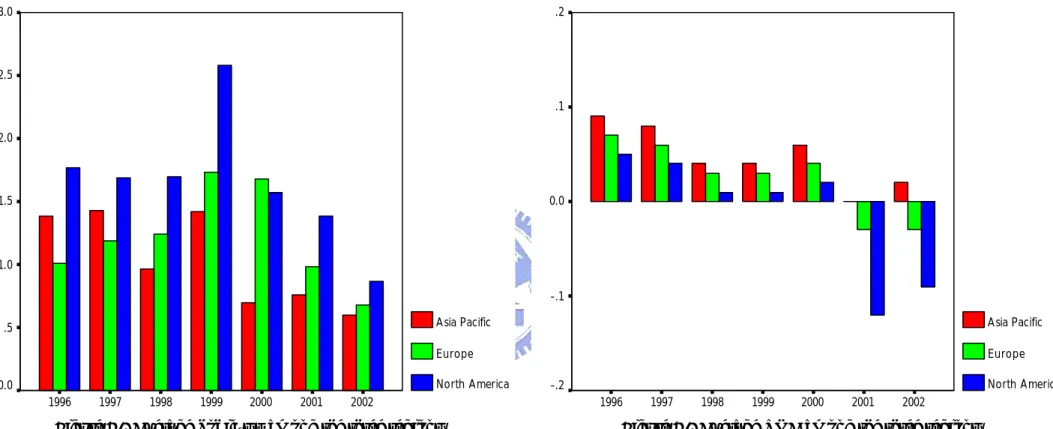
Here are two figures which show two dynamic firm performances in three high-tech industries for each region separately during 1996 to 2002. Figure 4.1 summarizes the average Tobin’s q of the three high-tech industries in three geographical regions. We find that during the sample period mean annual Tobin’s q of the North America firms have substantially outperformed those of other Asia Pacific firms as well as those of the continental European firms (Except in 2000). Figure 4.2 shows the average ROA of the three high-tech industries in three geographical regions. However, it is interesting that the results of average ROA during the sample period are contrary to those of the average Tobin’s q in three geographical regions, Asia Pacific firms have substantially outperformed those of other firms in Europe and North America.
These results also show some other notable difference among Asia Pacific, Europe and North America.
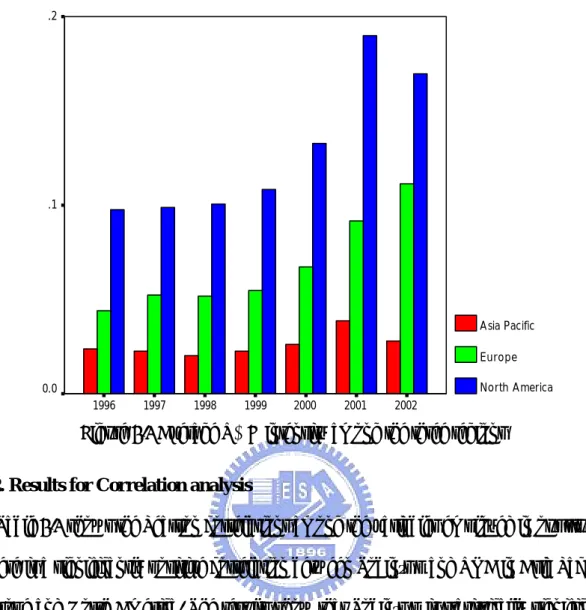
1. North America (13%) high-tech industries appear to place more emphasis on R&D activity (R&D intensity) than Asia Pacific and Europe (3% and 7%). It is clear that these variables are also significantly different from each other (Table 4.1). In Table 4.2, R&D activity is relatively concentrated in SIC 36 industries, whereas more broadly dispersed across both SIC 28 and SIC 35 industries among the three regions. From Figure 4.3, R&D activities in Europe and North America are the rise continues throughout the seven years. However, it is no markedly change in each year in Asia Pacific.
2. Asia Pacific firms show higher value for Firm size and Leverage (Table 4.1). Due to industry characteristics, Chemicals industries, on average, have the highest Firm size and Leverage among the three regions (Table 4.2).
3. In Table 4.1, though the descriptive statistics show that Growth do not differ much from each other, on average, North America firms have a higher growth in sales than that of Asia Pacific and Europe firms. In Table 4.2, Electrical & Electronics industries, on average, have a higher Growth among the three regions.
4. Finally, looking at the capital intensity of the Asia Pacific, Europe and North America firms in Table 4.1, we observe that the North America firms have significantly lower values than the Asia Pacific and Europe firms.
Table 4.1 All Firms-Years by Region
Descriptive statistics for study samples of three high-tech industries in Asia Pacific, Europe and North America from the periods 1996 to 2002. For all firms-years by region (Table 4.1) and each two-digit SIC code industry for each region separately (Table 4.2). The variables include: Tobin's q, a firm's market value divided by its replacement cost. Tobin's q is computed according to the methodology presented in Chung and Pruitt (1994). ROA represents the income before extraordinary items divided by total assets. R&D intensity represents the R&D expenditure divided by total sales. Firm size is the natural logarithm of annual assets. Growth is percentage growth rate of total sales. Leverage represents the book value of total liabilities divided by total assets. Capital intensity represents the capital expenditure divided by total assets.
Variables Asia Pacific (N= 416) Europe (N= 730) North America (N= 1,602)
Mean Median S.D. Min. Max Mean Median S.D. Min. Max. Mean Median S.D. Min. Max. Tobin's q 0.87 (E, N) 0.68 (E, N) 0.82 -0.38 4.40 1.25 (A, N) 0.73 (A, N) 1.62 -0.38 10.98 1.62 (A, E) 1.02 (A, E) 1.90 -0.61 15.61
ROA 0.03 (N) 0.03 0.08 -0.27 0.24 0.02 (N) 0.04 0.13 -0.95 0.34 -0.01(A, E) 0.04 0.22 -1.78 1.63
R&D intensity 0.03 (E, N) 0.01 (E, N) 0.05 0 0.47 0.07 (A, N) 0.04 (A, N) 0.12 0 1.30 0.13 (A, E) 0.06 (A, E) 0.24 0 2.89
Firm size 6.27 (N) 6.19 (E, N) 1.41 2.43 10.14 6.12 5.92 (A) 2.11 1.19 10.77 6.05 (A) 5.99 (A) 1.78 1.43 10.78
Growth 0.13 0.036 0.45 -0.67 3.03 0.11 0.015 (N) 0.65 -0.83 8.78 0.16 0.048 (E) 0.61 -0.92 14.08
Leverage 0.25 (E, N) 0.24 (E, N) 0.15 0 0.69 0.20 (A) 0.18 (A, N) 0.15 0 1.08 0.20 (A) 0.16 (A, E) 0.21 0 2.34
Capital intensity 0.06 (N) 0.04 0.07 0 0.42 0.06 (N) 0.05 (N) 0.05 0 0.53 0.05 (A, E) 0.04 (E) 0.05 0 0.43
Note: Annual data for a seven year period are analyzed. The superscripts A, E and N denote if there are statistically significant differences (at the 5% level) in mean and median values among the Asia Pacific, the Europe and the North America, respectively. We use a two-tailed t-test for means and Wilcoxon signed rank test for medians.
Table 4.2 Three high-tech industries by region
Tobin's q ROA R&D intensity Firm size Growth Leverage Capital intensity Mean S.D. Mean S.D. Mean S.D. Mean S.D. Mean S.D. Mean S.D. Mean S.D. Asia Pacific SIC 28 (N= 93) 0.74 0.53 0.03 0.05 0.01 0.01 6.54 1.25 0.04 0.36 0.29 0.15 0.06 0.05 SIC 35 (N= 165) 0.89 0.92 0.05 0.09 0.02 0.05 6.13 1.44 0.18 0.47 0.18 0.14 0.06 0.07 SIC 36 (N= 158) 0.92 0.85 0.02 0.08 0.04 0.06 6.25 1.46 0.15 0.48 0.29 0.14 0.08 0.07 Europe SIC 28 (N= 154) 0.77 0.61 0.03 0.07 0.04 0.03 7.55 2.08 0.03 0.23 0.26 0.13 0.07 0.04 SIC 35 (N= 327) 1.12 1.48 0.04 0.11 0.05 0.06 5.68 1.74 0.11 0.75 0.20 0.17 0.05 0.04 SIC 36 (N= 249) 1.72 2.05 -0.01 0.18 0.11 0.18 5.80 2.18 0.17 0.68 0.17 0.13 0.07 0.06 North America SIC 28 (N= 256) 0.97 0.43 0.04 0.06 0.04 0.15 7.39 1.38 0.04 0.24 0.32 0.19 0.05 0.04 SIC 35 (N= 572) 1.54 1.96 -0.01 0.24 0.11 0.22 6.10 1.75 0.13 0.43 0.19 0.20 0.05 0.04 SIC 36 (N= 774) 1.90 2.09 -0.04 0.23 0.18 0.26 5.58 1.68 0.22 0.78 0.16 0.21 0.06 0.05 Note: SIC 28, Chemicals & Pharmaceutics; SIC 35, Machinery & Computer Hardware; SIC 36, Electrical & Electronics.
2002 2001 2000 1999 1998 1997 1996 3.0 2.5 2.0 1.5 1.0 .5 0.0 Asia Pacific Europe North America 2002 2001 2000 1999 1998 1997 1996 .2 .1 0.0 -.1 -.2 Asia Pacific Europe North America
2002 2001 2000 1999 1998 1997 1996 .2 .1 0.0 Asia Pacific Europe North America
Figure 4.3 Average R&D intensity among the three regions
4.2. Results for Correlation analysis
Table 4.3 shows the Pearson correlations among the variables employed in our study. There is a significantly positive correlation between Tobin’s q and ROA in Asia Pacific, Europe and North America. The results show that Tobin’s q is statistically significant and positively correlated with the R&D intensity and Growth in the three regions. That is, increase in R&D expenditures will increase market valuation of Asia Pacific, Europe and North America high-tech firms. At the same time, R&D intensity has a significantly positive correlation with Growth in both Europe and North America, but it is negative in Asia Pacific. ROA is negatively correlated with R&D intensity in the three regions. That is, the benefits of R&D are long term in nature and could adversely affect short-term profitability.
Growth of Asia Pacific firms is significant and positively correlated to Tobin’s q and ROA, while only Growth is significant to Tobin’s q in the Europe firms and only
and negatively correlated with Tobin’s q in both Europe and North America but it is positively significant in Asia Pacific. The relationship between ROA and size in contrast with the relationship between Tobin’s q and size, and suggests that large firms have higher current profitability, but less potential for future growth in profitability in both Europe and North America, however, this condition is not to hold in Asia Pacific. Capital intensity represents a firm’s long-term commitment to building its technological base and upgrading its productive capacity. Capital intensity is positively linked with Tobin’s q and ROA in both Asia Pacific and North America. As expected, leverage is negatively related to Tobin’s q and ROA regardless of different economic environment. Smaller firms have higher R&D intensity in both Europe and North America, consistent with smaller firms being growth firms. Nevertheless, larger firms have higher R&D intensity only in Asia Pacific, it is implied smaller firms don’t have enough capital expensed in R&D expenditure in Asia Pacific. Finally, firms with higher growth in sales have higher R&D intensity in both Europe and North America. Nevertheless, it has lower R&D intensity in Asia Pacific.
In addition to the Pearson correlations analysis, Variance Inflation Factor (VIF) for all independent variables is presented in Tables 4.4. The VIF does not appear to be a serious problem because it is under the acceptable value (VIF < 10). Hence, it suggests that there is no multicollinearity problem among the variables tested in this study.
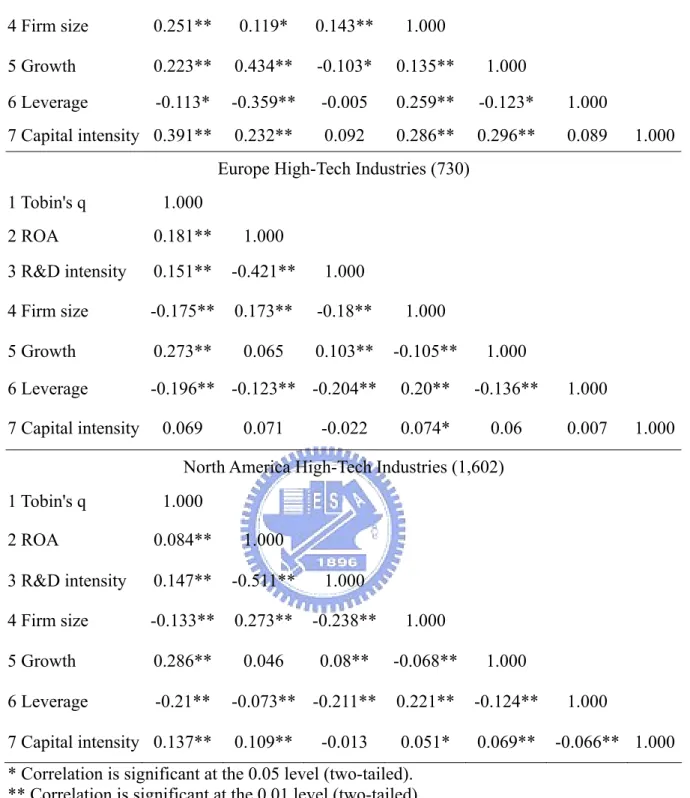
Table 4.3 Pearson correlations among study variables
1 2 3 4 5 6 7
Asia Pacific High-Tech Industries (416) 1 Tobin's q 1.000
2 ROA 0.464** 1.000
4 Firm size 0.251** 0.119* 0.143** 1.000
5 Growth 0.223** 0.434** -0.103* 0.135** 1.000 6 Leverage -0.113* -0.359** -0.005 0.259** -0.123* 1.000 7 Capital intensity 0.391** 0.232** 0.092 0.286** 0.296** 0.089 1.000
Europe High-Tech Industries (730)
1 Tobin's q 1.000 2 ROA 0.181** 1.000 3 R&D intensity 0.151** -0.421** 1.000 4 Firm size -0.175** 0.173** -0.18** 1.000 5 Growth 0.273** 0.065 0.103** -0.105** 1.000 6 Leverage -0.196** -0.123** -0.204** 0.20** -0.136** 1.000 7 Capital intensity 0.069 0.071 -0.022 0.074* 0.06 0.007 1.000 North America High-Tech Industries (1,602)
1 Tobin's q 1.000 2 ROA 0.084** 1.000 3 R&D intensity 0.147** -0.511** 1.000 4 Firm size -0.133** 0.273** -0.238** 1.000 5 Growth 0.286** 0.046 0.08** -0.068** 1.000 6 Leverage -0.21** -0.073** -0.211** 0.221** -0.124** 1.000 7 Capital intensity 0.137** 0.109** -0.013 0.051* 0.069** -0.066** 1.000 * Correlation is significant at the 0.05 level (two-tailed).
** Correlation is significant at the 0.01 level (two-tailed).
Table 4.4 Variance Inflation Factor (V.I.F) V.I.F
Independent Variables Asia Pacific Europe North America R&D intensity 1.148 1.175 1.147 Firm size 1.236 1.223 1.227
Leverage 1.254 1.127 1.139 Capital intensity 1.274 1.087 1.123
Year Dummy1996-2002 2.293~6.625 2.60~3.485 1.805~2.170 SIC Dummy SIC 28, 35 1.373~1.443 1.424~1.477 1.181~1.359
4.3. Results for regressions analysis
This section examines the influence of R&D activities on Tobin’s q and ROA of firms in Asia Pacific, Europe and North America. As discussed earlier, the control variables of Firm size, Growth, Leverage and Capital intensity are used in each regression. Since our sample data are collected from firms in 7 years (1996-2002), three two-digit SIC code high-tech industries, there is a possibility that year and industry may influence the results. Thus, we include dummy variables for each year and each two-digit SIC code industry. Our research objective is to investigate whether the firm performances are related to the R&D investment differently among the three regions, in addition to region-specific results, findings are also reported separately industry-specific results in the three regions.
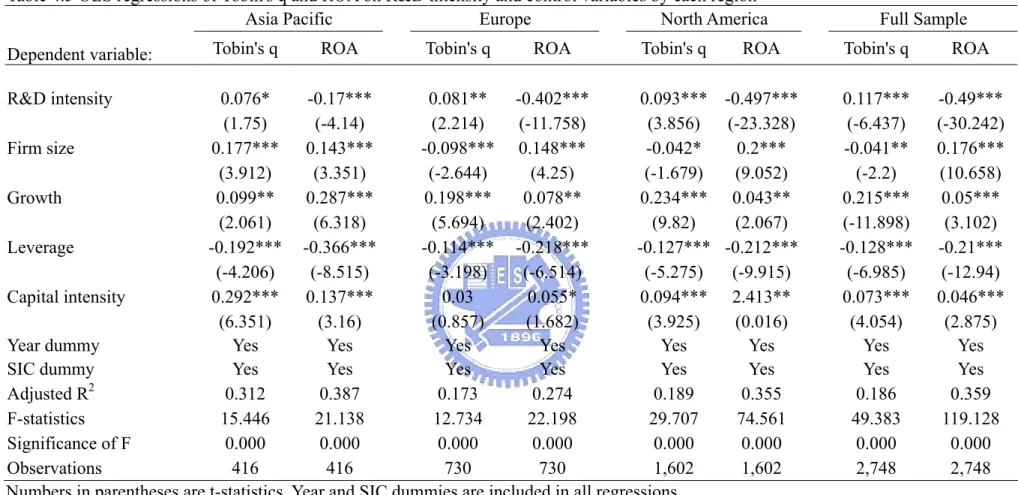
4.3.1. Comparative Results among the Asia Pacific, Europe and North America
Table 4.5 shows regression results of Tobin’s q and ROA of firms in Asia Pacific, Europe and North America. The results show that after controlling for potential factors which might influence a firm’s Tobin’s q, the relationship between R&D intensity and the firm’s Tobin’s q is positive and significant at the 0.01 level in the full sample. It is clear that Tobin’s q is also positive and significant among Asia Pacific, Europe and North America, despite some differences in explanatory power. These results suggest that R&D plays a critical role in determining Tobin’s q in the high-tech industries across regions.
ROA, which is not surprising because the expensing of R&D expenditure will reduce current profitability. The benefits of R&D are long term in nature and could adversely affect short-term profitability. These results are consistent with earlier studies (Cui and Mak 2002).
To further look at the results of the regression among the three regions, however, there are some differences in explanatory power of the R&D intensity among the Asia Pacific, Europe and North America. As we have seen, from Table 4.2, it is clear that R&D activity is concentrated among firms from within the North America region (13%), whereas is more broadly dispersed across both the Asia Pacific (3%) and Europe (7%). By itself, the relatively concentrated nature of R&D activity suggests the potential for a greater level of R&D effectiveness in North America. To lead to R&D intensity is strongly significantly positive to q in North America, but it is slightly significant at the 10% and 5% level in Asia Pacific and Europe, indicating greater contributions of R&D investment to the Tobin’s q of firms in North America than to those firms in Asia Pacific and Europe. Thus, it is evident that why those during the sample period mean annual Tobin’s q of the North America firms have substantially outperformed those of other Asia Pacific firms as well as those of the continental European firms (Except 2000).
Table 4.5 point out some similarities, but also distinct differences on the effects of other control variables on the Tobin’s q and ROA of a firm among the three regions. To be more specific, both Growth and Capital intensity have significant positive impacts on the Tobin’s q and ROA of a firm. In particular, Capital intensity is one of the most important factors for the industries with high capital investments. It is significantly and directly associated with firm performances, while Capital intensity is not significant to Tobin’s q only in Europe. More effective use of capital will ensure the firm to maintain
a competitive posture in its industry and only a favorable linkage between R&D and capital investments for a technological innovation may boost and sustain a competitive edge in the world marketplace (Lee and Shim, 1995). Leverage, however, generates a much greater impact on the Tobin’s q and ROA among the three regions. This result suggests that high levels of leverage negatively affect firm performances. High leverage could prevent firms from raising additional funds for productive R&D projects and the firm could be less competitive in the long-run.
It is also worthwhile to note that firm size. From Table 4.2, it is apparent that the firm size in Asia Pacific has significantly higher values than Europe and North America and it is statistically significant positive association with Tobin’s q only in Asia Pacific. Nevertheless, the coefficients in Europe and North America are negative effects. Evidently, the relative roles of firm size on the market valuation depend more upon economic and cultural differences (e.g., quality of labor, venture capital sources, and industry characteristics) and, in Table 3.1, the most countries in Asia Pacific are emerging countries (Except Japan), in contrast to Europe and North America are all developed countries. To conclude that due to the differences effect of firm size among the three regions, it seems to imply that investors in Asia Pacific evaluate larger firms have more future growth in profitability in the market valuation of high-tech firms. To contrast with developed countries, stock market investors evaluate smaller firms have higher potential for future growth in profitability.
4.3.2. Industry Effects among the three regions
Lustgarten and Thomadakis (1987) find that the cross-sectional relation of Tobin’s q to firm characteristics can depend upon market structure influences. Thus, the potential exists for the q ratio implications of firm-specific features, such as R&D intensity, firm size, growth, leverage and capital intensity in our study, to vary with industry
conditions. Since industries differ widely in the effectiveness of R&D, studies that include data from various industries are flawed by too much aggregation. In support of this hypothesis, Chauvin and Hirschey (1993), report the market value effects of variations in the levels of advertising and R&D expenditures for a variety of advertising-intensive and R&D-intensive industries. Hence, the paper also examines whether R&D investment influences Tobin’s q and ROA differently among North America, Europe and Asia Pacific based on industries classified according the Chemicals, Machinery and Electrical & Electronics.
To further investigate the extent to which the results may be influenced by industry-related considerations, Table 4.6 to 4.8 reports the Tobin’s q and ROA effects of variations in the levels of the R&D intensity and control variables for the three high-tech industries. From Table 4.6 to 4.8, for the full samples from three high-tech industries, the results show that Tobin’s q is positive and significant to R&D intensity, while ROA is negative relationship with R&D intensity. The results strongly suggest that R&D plays a critical role in determining Tobin’s q in the high-tech industries in the worldwide, even if R&D expenditures will reduce current profitability.
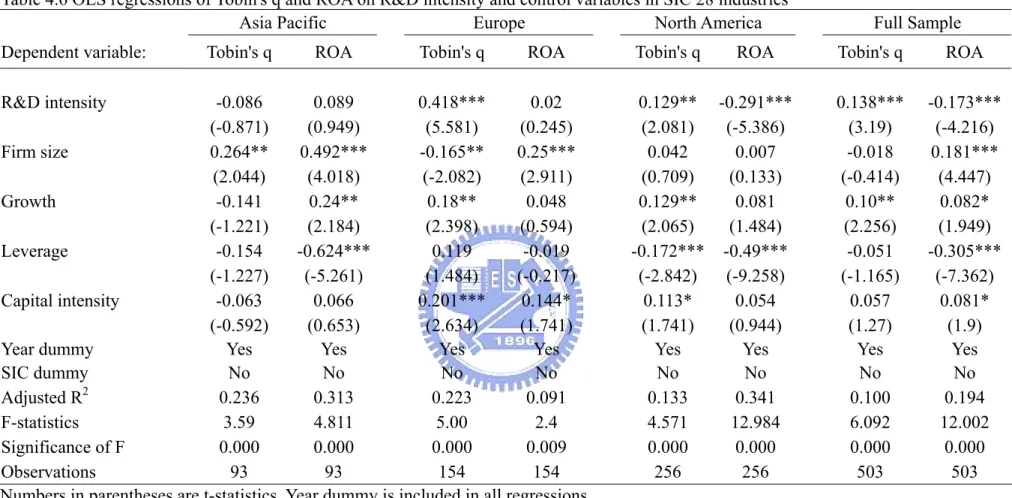
To further look at the results of the regression among the three regions, however, all the coefficients of the R&D intensity are insignificant association with Tobin’s q in the three high-tech industries in Asia Pacific. Except in Electrical & Electronics industries, it is significantly positive in the other two industries in Europe, whereas all the coefficients of the R&D intensity are significantly positive to Tobin’s q in the three high-tech industries in North America. These results suggest for the stock market investors in North America evaluate R&D expenditure as the key consideration in the market valuation of three high-tech industries. In Asia Pacific, however, it is not the key consideration in the market valuation of three high-tech industries. It is deserved to
be mentioned, although R&D intensity in SIC 36 industries in Europe has significant higher values than in SIC 28 and SIC 36 industries, the result of regression is not significant. The rational interpretation is that the stock market investors have high appreciation of the SIC 28 and 35 industries in Europe even if the R&D intensity is lower than SIC 36 industries.
These results also show some other notable difference in the three high-tech industries among Asia Pacific, Europe and North America.
1. Almost the coefficients of firm size are positively associated with a firm’s ROA in the three high-tech industries among the three regions. Notable differences are, however, found for the relationships of a firm’s firm size to its Tobin’s q in Asia Pacific, it is significant and positively associated with Tobin’s q in SIC 28 and 36 industries while most coefficients of firm size are significantly negatively related to Tobin’s q in the three high-tech industries in Europe and North America. Due to different economic environments, investors evaluate the firm sizes of different industries will lead to significant differences.
2. In most cases, the results show that financial leverage is significant but negatively associated with firm performances in the three high-tech industries among the three regions. The important point to note is SIC 36 industries, all the coefficients of the leverage are negatively related to firm performances, the results suggest that higher leverage will reduce firm’s current and future growth in profitability in the market valuation of high-tech industries, in particular, SIC 36 industries.
3. It is interesting to note that growths in sales are only significant and positive to ROA in Asia Pacific while only significant and positive to Tobin’s q in Europe and North America across the three high-tech industries. The results indicate investors in Asia Pacific are more conservative with firm short-term performances
in the market valuation of three high-tech industries. However, investors in Europe and North America are attaching importance to firm’s growth in the three high-tech industries.
4. Despite some coefficients of capital intensity are insignificant within individual industry among the three regions, most the capital intensity is significant and positive to firm performances.
In sum, research and development activity, growth in sales and capital intensity have a significantly positive association with firm performances, however, financial leverage are significantly negative to firm performances among Asia Pacific, Europe and North America. Overall the results indicate that such competitive forces as R&D activity and effective use of capital are the major determinants of a firm’s Tobin’s q in the high-tech industries of the North America. Finally, from Table 4.5 to 4.8, we can see that the total explanatory power in the ROA regressions is much higher than the Tobin’s q regressions. This implies that there are many factors other than those listed in Table 4.5 to 4.8 that affect the market valuation. This finding is consistent with earlier studies (Cui and Mak 2002).
Table 4.5 OLS regressions of Tobin's q and ROA on R&D intensity and control variables by each region
Asia Pacific Europe North America Full Sample Dependent variable: Tobin's q ROA Tobin's q ROA Tobin's q ROA Tobin's q ROA R&D intensity 0.076* -0.17*** 0.081** -0.402*** 0.093*** -0.497*** 0.117*** -0.49*** (1.75) (-4.14) (2.214) (-11.758) (3.856) (-23.328) (-6.437) (-30.242) Firm size 0.177*** 0.143*** -0.098*** 0.148*** -0.042* 0.2*** -0.041** 0.176*** (3.912) (3.351) (-2.644) (4.25) (-1.679) (9.052) (-2.2) (10.658) Growth 0.099** 0.287*** 0.198*** 0.078** 0.234*** 0.043** 0.215*** 0.05*** (2.061) (6.318) (5.694) (2.402) (9.82) (2.067) (-11.898) (3.102) Leverage -0.192*** -0.366*** -0.114*** -0.218*** -0.127*** -0.212*** -0.128*** -0.21*** (-4.206) (-8.515) (-3.198) (-6.514) (-5.275) (-9.915) (-6.985) (-12.94) Capital intensity 0.292*** 0.137*** 0.03 0.055* 0.094*** 2.413** 0.073*** 0.046*** (6.351) (3.16) (0.857) (1.682) (3.925) (0.016) (4.054) (2.875) Year dummy Yes Yes Yes Yes Yes Yes Yes Yes SIC dummy Yes Yes Yes Yes Yes Yes Yes Yes Adjusted R2 0.312 0.387 0.173 0.274 0.189 0.355 0.186 0.359 F-statistics 15.446 21.138 12.734 22.198 29.707 74.561 49.383 119.128 Significance of F 0.000 0.000 0.000 0.000 0.000 0.000 0.000 0.000 Observations 416 416 730 730 1,602 1,602 2,748 2,748 Numbers in parentheses are t-statistics. Year and SIC dummies are included in all regressions.
* Means significant at 0.10 level (two-tailed). ** Means significant at 0.05 level (two-tailed). *** Means significant at 0.01 level (two-tailed).
Table 4.6 OLS regressions of Tobin's q and ROA on R&D intensity and control variables in SIC 28 industries
Asia Pacific Europe North America Full Sample Dependent variable: Tobin's q ROA Tobin's q ROA Tobin's q ROA Tobin's q ROA
R&D intensity -0.086 0.089 0.418*** 0.02 0.129** -0.291*** 0.138*** -0.173*** (-0.871) (0.949) (5.581) (0.245) (2.081) (-5.386) (3.19) (-4.216) Firm size 0.264** 0.492*** -0.165** 0.25*** 0.042 0.007 -0.018 0.181*** (2.044) (4.018) (-2.082) (2.911) (0.709) (0.133) (-0.414) (4.447) Growth -0.141 0.24** 0.18** 0.048 0.129** 0.081 0.10** 0.082* (-1.221) (2.184) (2.398) (0.594) (2.065) (1.484) (2.256) (1.949) Leverage -0.154 -0.624*** 0.119 -0.019 -0.172*** -0.49*** -0.051 -0.305*** (-1.227) (-5.261) (1.484) (-0.217) (-2.842) (-9.258) (-1.165) (-7.362) Capital intensity -0.063 0.066 0.201*** 0.144* 0.113* 0.054 0.057 0.081* (-0.592) (0.653) (2.634) (1.741) (1.741) (0.944) (1.27) (1.9) Year dummy Yes Yes Yes Yes Yes Yes Yes Yes SIC dummy No No No No No No No No Adjusted R2 0.236 0.313 0.223 0.091 0.133 0.341 0.100 0.194 F-statistics 3.59 4.811 5.00 2.4 4.571 12.984 6.092 12.002 Significance of F 0.000 0.000 0.000 0.009 0.000 0.000 0.000 0.000 Observations 93 93 154 154 256 256 503 503 Numbers in parentheses are t-statistics. Year dummy is included in all regressions.
* Means significant at 0.10 level (two-tailed). ** Means significant at 0.05 level (two-tailed). *** Means significant at 0.01 level (two-tailed).
Table 4.7 OLS regressions of Tobin's q and ROA on R&D intensity and control variables in SIC 35 industries
Asia Pacific Europe North America Full Sample Dependent variable: Tobin's q ROA Tobin's q ROA Tobin's q ROA Tobin's q ROA
R&D intensity 0.081 -0.019 0.142*** -0.18*** 0.115*** -0.531*** 0.143*** -0.536*** (1.186) (-0.296) (2.654) (-3.538) (2.877) (-15.409) (4.908) (-21.218) Firm size 0.11 0.137** -0.177*** 0.047 -0.092** 0.195*** -0.095*** 0.132*** (1.579) (2.054) (-3.298) (0.933) (-2.293) (5.64) (-3.246) (5.205) Growth 0.123 0.307*** 0.226*** 0.072 0.315*** 0.042 0.25*** 0.071*** (1.511) (3.921) (4.236) (1.431) (8.101) (1.238) (8.678) (2.853) Leverage -0.164** -0.368*** -0.073 -0.392*** -0.112*** -0.123*** -0.093*** -0.168*** (-2.313) (-5.427) (-1.393) (-7.879) (-2.896) (-3.696) (-3.232) (-6.739) Capital intensity 0.323*** 0.241*** 0.068 0.001 0.091** 0.068** 0.091*** 0.059** (4.092) (3.184) (1.277) (0.021) (2.349) (2.042) (3.155) (2.354) Year dummy Yes Yes Yes Yes Yes Yes Yes Yes SIC dummy No No No No No No No No Adjusted R2 0.277 0.334 0.156 0.240 0.209 0.412 0.171 0.377 F-statistics 6.699 8.492 6.458 10.371 14.695 37.355 20.882 59.395 Significance of F 0.000 0.000 0.000 0.000 0.000 0.000 0.000 0.000 Observations 165 165 327 327 572 572 1,064 1,064 Numbers in parentheses are t-statistics. Year dummy is included in all regressions.
* Means significant at 0.10 level (two-tailed). ** Means significant at 0.05 level (two-tailed). *** Means significant at 0.01 level (two-tailed).
Table 4.8 OLS regressions of Tobin’s q and ROA on R&D intensity and control variables in SIC 36 industries
Asia Pacific Europe North America Full Sample Dependent variable: Tobin’s q ROA Tobin’s q ROA Tobin’s q ROA Tobin’s q ROA
R&D intensity 0.083 -0.274*** 0.037 -0.466*** 0.089*** -0.44*** 0.103*** -0.469*** (1.206) (-4.373) (0.57) (-7.994) (2.581) (-14.924) (3.702) (-19.351) Firm size 0.211*** 0.105 -0.036 0.171*** 0.009 0.23*** -0.002 0.196*** (2.845) (1.556) (-0.584) (3.079) (0.276) (7.817) (-0.071) (8.226) Growth 0.088 0.306*** 0.166*** 0.054 0.207*** -0.021 0.19*** 0.015 (1.166) (4.455) (2.7) (0.97) (5.86) (-0.678) (6.753) (0.61) Leverage -0.243*** -0.336*** -0.215*** -0.124** -0.142*** -0.255*** -0.17*** -0.233*** (-3.644) (-5.52) (-3.432) (-2.184) (-4.188) (-8.759) (-6.131) (-9.622) Capital intensity 0.324*** 0.042 0.02 0.11** 0.077** -0.02 0.063** 0.033 (4.429) (0.635) (0.319) (1.993) (2.179) (-0.665) (2.263) (1.357) Year dummy Yes Yes Yes Yes Yes Yes Yes Yes SIC dummy No No No No No No No No Adjusted R2 0.390 0.494 0.145 0.303 0.172 0.390 0.179 0.372 F-statistics 10.137 14.916 4.833 10.789 15.597 45.989 24.329 64.632 Significance of F 0.000 0.000 0.000 0.000 0.000 0.000 0.000 0.000 Observations 158 158 249 249 774 774 1,181 1,181 Numbers in parentheses are t-statistics. Year dummy is included in all regressions.
* Means significant at 0.10 level (two-tailed). ** Means significant at 0.05 level (two-tailed). *** Means significant at 0.01 level (two-tailed).
5. Conclusion
A firm’s R&D investment plays a pivotal role in the firm’s innovation activities, representing future growth opportunities. This study broadens the analysis of R&D investments to the direct effects (impact) of firm performances for three high-tech industries among Asia Pacific, Europe and North America. Regarding the firm performance measures, this study simultaneously utilizes market- and accounting-based measures of the firm performance, Tobin’s q and ROA. The results show that R&D expenditures as a percentage of sales are, on average, greater for North America firms (13%) than for Europe (7%) and Asia Pacific firms (3%). Regression results show that after controlling for firm-related factors, R&D investment has a persistently positive effect on the Tobin’s q among Asia Pacific, Europe and North America, with a more pronounced effect for North America. These results indicate that while long-term investments of firms such as R&D are valued highly in capital markets regardless of their regions, they make relatively more contributions to the Tobin’s q of North America firms. As expected, for ROA regressions, R&D intensity is negatively correlated with ROA. The benefits of R&D are long term in nature and could adversely affect short-term profitability.
Because industries differ widely in the effectiveness of R&D, studies that include data from various industries are flawed by too much aggregation. To further investigate these effects of R&D on firm performances based on different high-tech industries, this study further show that all the coefficients of the R&D intensity are insignificant association with Tobin’s q in the three high-tech industries in Asia Pacific. Except in Electrical & Electronics industries, it is significantly positive in the other two industries in Europe, whereas R&D investment has a persistently positive effect on the
Tobin’s q for the three high-tech industries in North America. These results suggest for the stock market investors in North America evaluate R&D expenditure as the key consideration in the market valuation of three high-tech industries.
The results further show that there exist notable differences in firm size among the three regions. For both Europe and North America, firm sizes are significantly negative related to Tobin’s q, while it is significantly positive to Tobin’s q only for Asia Pacific. A firm’s financial leverage is, however, significantly negatively related to the firm performances among the three regions, in particular, SIC 36 industries. In most cases, growth in sales and capital intensity are significant and positive to firm performances in the three high-tech industries among the Asia Pacific, Europe and North America. Finally, this study can be extended with samples of other industries (e.g., non high-tech based industries) in order to generalize the finding of this study. The study using other industry samples will help us in finding the existence of a general relationship between R&D and firm performances. The existence of the relationship between firm performance and R&D expenditures will also help us in justifying R&D related expenditures. The extension of the study could be conducted with different industry samples and longer time periods and other performance measures. The future research would clarify not only the generalization of the findings, but also provide additional insight into the strategic effects of R&D on a firm’s profit and performance.
Reference
[1] Bae, S.C., and Noh, S., “Multinational Corporations versus Domestic Corporations: A Comparative Study of R&D Investment Activities”, Journal of Multinational Financial Management, 11, pp. 89-104, 2001.
[2] Bharadwaj, A.S., Bharadwaj S.G., and Konsynski B.R., “Information Technology Effects on Firm Performance a Measured by Tobin's q”, Management Science, 45, pp. 1008-1024, 1999.
[3] Chan, S.H., Martin, J.D., and Kensinger, J.W., “Corporate research and
development expenditures and share value”, Journal of Financial Economics, 26 , pp. 255-276, August1990.
[4] Chauvin, K.W., and Hirschey, M., “Advertising, R&D expenditures and the market value of the firm”, Financial Management, 22, pp. 128-140, Winter 1993.
[5] Christoffersen, S., “The textile industry: Does R&D deliver success?”, Competitiveness Review , 12, pp. 77-95, 2002.
[6] Chung, K.H., and Pruitt, S.W., “A Simple Approximation of Tobin’s q”, Financial Management, 23, pp. 70-74, 1994.
[7] Chung, K., Wright, P., and Charoenwong, C., “Investment opportunities and market reaction to capital expenditure decisions”, Journal of Banking and Finance, 22, pp. 41-60, 1998.
[8] Cockburn, I., and Griliches, Z., “The estimation and measurement of spillover effects of R&D investment”, American Economic Review, 78, pp. 419-423, 1998. [9] Cui, H., and Mak, Y.T., “The relationship between managerial ownership and firm
performance in high R&D firms”, Journal of Corporate Finance, 8, pp 313-336, 2002.
[10] Griliches, Z., “Market value, R&D, and patents”, Economics Letters, 7, pp. 183-187, 1981.
[11] Hall, B.H., “The stock market’s valuation of R&D investment during the 1980’s”, American Economic Review, 83, pp. 259-264, 1993.
[12] Jensen, M.C., “Agency costs of free cash flow, corporate finance and takeovers”, American Economic Review, 76, pp. 323-329, 1986.
[13] Jensen, M.C., and Meckling, W.H., “Theory of the firm: Managerial behavior, agency costs and ownership structure”, Journal of Financial Economics, 4, pp. 305-360, 1976.
[14] Keats, B., and Hitt, M., “A Causal Model of Linkages among Environmental Dimensions, Macro Organizational Characteristics, and Performance”, Academy of Management Journal, 31, pp. 570-598, 1988.
[15] Lang, L.H.P., and Stulz, R.M., “Tobin’s q, Corporate Diversification and Firm Performance”, Journal of Political Economy, 102, pp. 1248-1280, 1994. [16] Lee, J., and Shim, E., “Moderating effects of R&D on corporate growth in U.S.
and Japanese hi-tech industries: An empirical study”, The Journal of High Technology Management Research, 6(2), pp. 179-191, 2001.
[17] Lev, B., Intangibles: Management, Measurement, and Reporting. Brookings Institution Press, Washington, DC, 2001.
[18] Lindenberg, E.B., and S.A. Ross, “Tobin’s q ratio and industrial organization”, Journal of Business, 54, pp. 1-32, 1981.
[19] Lustgarten, S., and Thomadakis, S., “Mobility barriers and Tobin’s q”, Journal of Business, 60, pp. 519-537, 1987.
[20] McConnell, J., and Muscarella, C., “Corporate Capital Expenditure Decisions and the Market Value of the firm”, Journal of Financial Economics, 14, pp. 399-422, 1985.
[21] Megna, P., and Klock, M., “The impact of intangible capital on Tobin’s q in the semiconductor industry”, American Economic Review, 83, pp. 265-269, 1993. [22] Megna, P., and Klock, M., “Measuring and valuing intangible capital in the
wireless communications industry”, The Quarterly Review of Economics and Finance, 40, pp. 519-532, 2000.
[23] Morck, R., Shleifer, A., and Vishny, A., “Management Ownership and Market Valuation: An Empirical Analysis”, Journal of Financial Economics, 20, pp. 293-316, 1988.
[24] Smith, D.B., and Pourciau, S., “A comparison of the financial characteristics of December and non-December year-end companies”, Journal of Accounting and Economics, 10, pp. 335-344, 1988.
[25] Szewczyk, S.H., Tsetsekos, G.P., and Zantout, Z., “The valuation of corporate R&D expenditures: evidence from investment opportunities and free cash flow”, Financial Management, 25, pp. 105-110, Spring 1996.
[26] Tassey, G., “Competitive strategies and performance in technology-based industries”, Journal of Economic Business, 35, pp. 21-40, 1983.
differences”, Journal of Economic Behavior & Organization, 54, pp. 205-230, 2004.
[28] Wernerfelt, B., and Montgomery, C.A., “Tobin’s q and the importance of focus in firm performance”, American Economic Review, 78, pp. 246-250, 1988.
[29] Woolridge, J., “Competitive Decline and Corporate Restructuring: Is a Myopic Stock Market to Blame?”, Journal of Applied Corporate Finance, 1, pp. 26-36, 1988.