1
行政院國家科學委員會補助專題研究計畫成果報告
※※※※※※※※※※※※※※※※※※※※※※※※※
※ ※
※ 具有序結構之金屬氧化物的合成與特性分析 ※
※ ※
※※※※※※※※※※※※※※※※※※※※※※※※※
計畫類別:
R
個別型計畫
□整合型計畫
計畫編號:NSC 90-2113-M-002-048
執行期間:90 年 8 月 1 日 至 91 年 7 月 31 日
計畫主持人:劉如熹
本成果報告包括以下應繳交之附件:
□赴國外出差或研習心得報告一份
□赴大陸地區出差或研習心得報告一份
R
出席國際學術會議心得報告及發表之論文各一份
□國際合作研究計畫國外研究報告書一份
執行單位:台灣大學化學系
中華民國九十一年七月三十一日
2
行政院國家科學委員會專題研究計畫成果報告
具有序結構之金屬氧化物的合成與特性分析
Synthesis and char acter ization of metal-oxide compounds with
or der ed str uctur es
計畫編號:NSC 90-2113-M-002-048
執行期限:90 年 8 月 1 日至 91 年 7 月 31 日
主持人:劉如熹 教授(台灣大學化學系)
計畫參與人員:詹丁山、王健源、張嵩駿、黃明義、陳政琪
林欣瑋、紀喨勝、康佳正、林益山(台灣大學化學系)
一、中文摘要 本研究內容分為二部分,第一部分乃關於具有 序結構之金屬氧化物應用於鋰離子二次電池之材 料特性探討。本研究利用固態反應法成功合成單相 之 LiVMoO6樣品,其為一具層狀結構之晶體化合 物。本研究亦利用各種方法鑑定與分析此材料之特 性,並組裝成硬幣型半電池進行充放電測試。此半 電池分別於 2.1-2.0 V、0.6-0.5 V 與 0.2-0.01 V 間可 展現三段平穩之放電平台。經數次量測所得之平均 值,半電池之總放電電容量約為 1250 mAh/g。此值 較目前已開發之大部分負極材料的電容量高。未來 工作將著重於充放電過程中鑑定晶體結構之變 化,並基於此合理地推測其電化學反應之反應機 制,以期設計出可逆電容量高、循環次數多與放電 電位穩定之新材料。 第二部分主要研究將離子半徑較小的鈣離子 取代離子半徑較大之緦離子,探討化學壓力取代, 對(Sr2-xCax)FeMoO6 (0 x 2.0)系列樣品,其晶體 結構、磁性及導電性質之影響。由研究結果發現, 隨鈣添加量之增加,鐵/鉬樣品之有序程度增加,且 磁矩接近理論值 4ìB,此外導電率亦隨鈣添加量之 增加而改善,此現象乃(Fe2+ + Mo6+)/(Fe3+ + Mo5+) 能帶重疊之增加而非帶寬之改變。相關之物理性質 乃藉由測量鐵、鉬 X-光吸收近邊緣結構光譜及能帶 理論計算加以證實。 關鍵詞: 鋰離子二次電池、LiVMoO6、雙層鈣鈦 礦、(Sr2-xCax)FeMoO6. Abstr actThis study is divided into two parts. The issue of the first part is about the investigation of the characterization of metal-oxide compounds with ordered structures, which is used for rechargeable lithium ion battery. The single-phase sample of LiVMoO6 has been synthesized by solid-state reaction method, which is crystallized with layered structure. The synthesized powder has been characterized by several analytic technologies. At the same time, the electrochemical behaviors of the prepared electrodes assembled in coin cells were also investigated in terms of half-cell performance. The amplitudes of three discharge plateaus are about 2.1-2.0 V, 0.6-0.5 V and
0.2-0.01 V, respectively. The total discharge capacity, averaged over several test runs, is about 1250 mAh/g which is much higher than the capacities, about 370-800 mAh/g, exhibited by many kinds of developed anode materials. Further work therefore needs to focus on the identification of the changing crystal structures during the cycling, and based on such that a plausible mechanism of the electrochemical reaction can be realized. Furthermore, increasing the reversible capacity of LiVMoO6 is also important.
The second part of this study is about the effects of variations of crystal structure, magnetization and conductivity resulting from the chemical pressure effects of substituting Sr2+ by the smaller Ca2+ on (Sr2-xCax)FeMoO6. An increase in the Ca-content leads to an increase in the Fe/Mo ordering in the materials, which raises the magnetic moments close to the theoretical value of 4 µB. An increase in conductivity with increasing Ca-content is also found and is consistent with an increase in (Fe2+ + Mo6+)/(Fe3+ + Mo5+) band overlap rather than bandwidth changes. The changes observed by physical measurements are supported by the X-ray absorption near edge structures of Fe and Mo, and band structure calculations.
Keywords: rechargeable Li-ion battery, LiVMoO6, double perovskite, (Sr2-xCax)FeMoO6.
二、緣由與目的
(a) Secondary battery material of LiVMoO6
Rechargeable batteries have been considered an attractive power source for a wide variety of applications and in particular, lithium-ion batteries are emerging as the technology of choice for portable electronics. One of the main challenges in the design of these batteries is to ensure that the electrodes maintain their integrity over many discharge and recharge cycles. Michael et al. have reported that LiVMoO6 can be synthesized by a soft-combustion (wet chemical) method [1]. However, the XRD pattern of LiVMoO6 reported by them was not indexed. On the other hand, Gopalakrishnan et al. have shown [2] that LiVMoO6 as well as its reduced product, LiVMoO5, obtained by solid-state reaction method can be identified by their XRD patterns. Moreover, the
3 authors performed many measurements on the physical properties of these materials. In the present work, we focus on finding a moderate method for preparing LiVMoO6 and on understanding the factors that influence its electrochemical properties.
(b)Magnectic resistance materials of
(Sr2-xCax)F eMoO6
Half-metallic compounds which have electrons with only one spin direction at the Fermi level have recently received considerable attention for their potential applications in spintronics. Several magnetic oxides have been identified as having half-metallic behavior at low temperatures, however, their spin polarization is strongly reduced at room temperature (RT). Therefore, oxides with both high spin polarization and high Curie temperatures are of particular interest. Recently, Kobayashi et al. [3] have reported a high spin polarization for an oxide material with a double-perovskite structure, Sr2FeMoO6 which also has a high Curie temperature, (Tc = 420 K).
In Sr2FeMoO6, the Fe2+ or Fe3+ ions are in a high-spin state with all the spin-up 3d orbitals occupied. Sleight and Weiher [4] proposed that if the spin-down 3d orbitals of Fe have similar energy to the 4d orbitals of Mo, the empty spin-down states (π*-β) of Fe3+ are degenerate to the one electron occupied spin down states (π*-β) of Mo5+ which may lead to the formation of a narrow band. The electrons in this band have antiparallel spins to the localized spins in the spin-up states (σ*-α and π*-α) of Fe3+. A ferromagnetic half-metallic state is thus observed in this ordered perovskite with localized up-spins of Fe3+ and itinerant spin-down electron of Mo5+. This is supported by the band calculations, which show at the Fermi level a mixing of the spin-down O 2p, Fe 3d and Mo 4d bands. [5] This band description is equivalent to an internal redox equilibrium between (Fe2+ + Mo6+) and (Fe3+ + Mo5+) states.
It is thus of great interesting to explore other prospective half-metallic compounds with large MR effects at low magnetic fields, in ferromagnetic compounds with Tc as close to RT as possible. We also present our studies on the variation of crystal structure and magnetic properties of the double perovskite system by chemical substitution of the smaller Ca2+ ions into the bigger Sr2+ sites (applying the internal anisotropic pressure) resulting in the system (Sr2-xCax)FeMoO6 (0 ≤ x ≤ 2.0).
二、結果與討論
(a) Secondary battery material of LiVMoO6
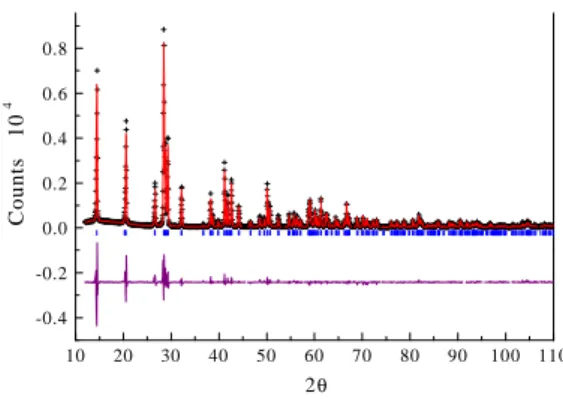
The powder XRD pattern of LiVMoO6 and the structural parameters calculated with Rietveld refinement are presented in Fig. 1 and Table 1, respectively.
Fig. 1. Observed (cross), calculated (solid line) X-ray powder diffraction pattern of LiVMoO6. Small bars indicate the positions of Bragg reflections for LiVMoO6. The difference between the calculated and experimental patterns is plotted along the bottom.
Table 1. Refined fractional atomic positions, unit cell parameters and reliability factors (%) of LiVMoO6 having space group C12/m1 at room temperature.
atoms x y z fraction Uiso (Å2)
Li V Mo O O O 0.00000 0.18577(15) 0.18577(15) 0.9676(7) 0.3329(7) 0.3124(7) 0.00000 0.00000 0.00000 0.00000 0.00000 0.00000 0.00000 0.65371(21) 0.65371(21) 0.2783(8) 0.8957(9) 0.4309(9) 1 0.5 0.5 1 1 1 0.054(17) 0.0252(6) 0.0252(6) 0.0385(26) 0.0420(26) 0.0524(30) space group: C12/m1 reliability factor bond distances (Å )
lattice parameters: a = 9.3443(4) Å b = 3.6461(1) Å c = 6.6364(3) Å Rp = 7.25% Rwp = 10.69% ÷2 = 2.11 V(Mo)-O 1.6839 1.7180 2.1833 1.8894
The XRD pattern of LiVMoO6 could be indexed on the basis of a monoclinic cell [ a = 9.3443(4) Å , b
= 3.64610(14) Å , c = 6.63636(25) Å , á = ã = 90° and
â = 111.6382(10)°] and the space group of its crystal structure is C12/m1. The sample could be synthesized successfully in single phase, as evidenced from the XRD refinement results. The layered structure of LiVMoO6 is shown in Fig. 2. LiVMoO6 crystallizes in the brannerite (ThTi2O6) structure which consists of edge- and corner-sharing MO6 (M = V or Mo) octahedra. The negative charges on the M2O6 sheets are compensated by additional cations (Li) which reside in the interlayer space [2].
The XANES spectra of LiVMoO6 and the standard samples at the V and Mo K-edges are shown in Figs. 3 and 4, respectively. The differences between the energy values corresponding to half height of normalized absorption (Ɠx) can usually be used to compare the oxidation states of the metal cations. Hence, according to the chemical shift of LiVMoO6 spectra, the oxidation number of the vanadium ion is about 4.5+ (as shown in Fig. 3) while that of molybdenum ion is 6+ (as shown in Fig. 4).
Moreover, the pre-edge feature can be assigned to the forbidden transition 1s to 3d, the lower-energy shoulder to the 1s to 4p shakedown transition and the strong peak to the dipole-allowed transition 1s to 4p. The initial 1s state being a gerade state, the 1s to 3d
transition is dipole forbidden in the regular octahedral VO6 units with a center of inversion. When the symmetry of the VO6 is lowered to distorted octahedral (as in V2O3) or distorted square-pyramidal (as in V2O5), the inversion center is broken. The pre-edge absorption becomes dipole allowed due to a combination of stronger 3d-4p mixing and overlap of the vanadium 3d orbital with the 2p orbital of oxygen.
10 20 30 40 50 60 70 80 90 100 110 -0.4 -0.2 0.0 0.2 0.4 0.6 0.8 1.0 C ounts 1 0 4 2θ
4 Fig. 2. Ideal crystal structure of LiVMoO6 with monoclinic cell (space group: C12/m1). Unit cell is shown in the center. Part of each V(Mo)O6 octahedra is shaded.
Fig. 3. Normalized V K-edge XANES spectra of
LiVMoO6 and those of the standard samples.
Fig. 4. Normalized Mo K-edge XANES spectra of LiVMoO6 and those of the standard samples.
The intense dipole-allowed absorption occurring in the pre-edge region of the vanadium K-edge in LiVMoO6 is shown in Fig. 3. This is consistent with the result of the XRD refinement (Table 1.) in the manner of bond lengths between metal and oxygen.
The charge, discharge and cycling plotted in the
form of potential vs. capacity are shown in Fig. 5. It is observed that although the ratio of the discharge capacity to charge in each cycle remains almost 95% for 30 cycles, the absolute values of the capacities were very low, 0.12 mAh/g.
Fig. 5. Typical charge and discharge curves of LiVMoO6 at a voltage of 2.80-4.25 V.
Based on the chemical formula of LiVMoO6 that is used for a cathode material, the theoretical capacity is calculated to be 107 mAh/g, while the practical utilizable capacity was 92 mAh/g for the first cycle, which was reported by Michael et al. [1]. However, based on our experimental results presented above, we feel that LiVMoO6 is not suitable as a cathode material in rechargeable Li-ion batteries. The reasons are as follows: First, since de-intercalation of positive lithium ions from the crystal structure must be electrically compensated by oxidation of V4.5+ or Mo6+, this suggests that even for layered structure phase, only the amount of V4.5+ contributes to the charge-discharge capacity. As a result, the initial capacity of LiVMoO6 is limited by the intrinsic amount of V4.5+ in the material. On the other hand, the expected capacity owing to V ions that can be oxidized seem to be much less than the experimental result of Michael et al.
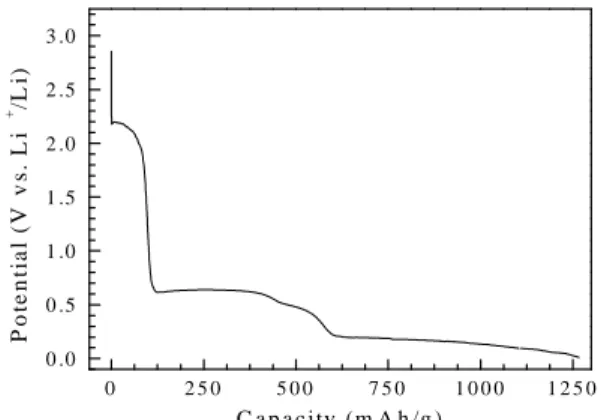
Second, as we know, the LiVMoO6 phase has a layered structure. When it is used for the cathode material in the Li-ion batteries and the charge current is passed, the Li-ions are extracted during this period. But it is reasonable to expect that the layered structure needs a sufficient amount of Li ions in the lattice to maintain the structure or else, the structure would break down. Furthermore, it might be an irreversible process. Therefore, coin type cells were also assembled and cycled between 3.00 and 0.01 V. When the cell was discharged, the potential rapidly drops to reach a plateau, and then continuously decreases down to 0.01 V as shown in Fig. 6. The amplitudes of three plateaus are about 2.1-2.0 V, 0.6-0.5 V and 0.2-0.01 V, respectively. The total discharge capacity, averaged over several test runs, is about 1250 mAh/g which is much higher than the capacities, about 370-800 mAh/g, exhibited by many kinds of anode materials.
Fig. 6. Typical discharge curves of LiVMoO6 at a voltage of 3.00-0.01 V. 5460 5470 5480 5490 5500 0.0 0.5 1.0 1.5 V2O3 VO2 V6O13 V2O5 LiVMoO6 N orm alized ab sorp ti on Energy (eV) 19960 20000 20040 20080 0.0 0.5 1.0 Mo MoO 2 MoO 3 LiVMoO 6 Energy (eV) N o rm a lize d a bso rp tion 20000 20005 20010 20015 0.3 0.4 0.5 0.6 2 .8 3 .0 3 .2 3 .4 3 .6 3 .8 4 .0 4 .2 0 .0 0 0 .0 2 0 .0 4 0 .0 6 0 .0 8 0 .1 0 0 .1 2 cy cle n u m b er in creas in g C h arge D isch arg e P o ten ti a l (V v s. L i + /L i) 0 2 5 0 5 0 0 7 5 0 1 0 0 0 1 2 5 0 0 .0 0 .5 1 .0 1 .5 2 .0 2 .5 3 .0 P o te n ti a l (V v s . L i + /L i) C a p a c ity (m A h /g )
5 The capacity of the LiVMoO6/Li cell on cycling was also examined. The irreversible capacity of the first cycle is about 450 mAh/g which means only one-third lithium ions intercalated (or deposited) into this layered material can be extracted out. From the second cycle, the reversible capacity decayed continuously until the fortieth cycle. After fortieths to one hundredth cycle, the charge/discharge efficiency of each cycle can maintain >95%. This phenomenon implies that it is necessary for LiVMoO6 to activate its reactivity by over-doping lithium ions through electrochemical reaction. We also think that it is impossible to synthesis a Li1+xVMoO6 (x>>1) compound by the conventional solid-state reaction method, which can exhibit good electrochemical activity. In the other word, the layered material, LiVMoO6, should be seen as a starting substance which is able to perform its good cyclability after electrochemical treatment. Furthermore, we suggest that the capability on cycling of the products of LiVMoO6 might be related to dramatic changing on surface reactivity as well as its electrochemical potential.
(b)Magnectic resistance materials of
(Sr2-xCax)F eMoO6
The powder XRD patterns of the (Sr2-xCax)FeMoO6 (0 x 2.0) samples are shown in Fig.7. Each composition of the series is single phase. For the samples with x < 1.0 and x > 1.5, all the peaks in each pattern can be indexed on the basis of a tetragonal unit cell (space group: I4/mmm) and monoclinic (space group: P21/n), respectively. This indicates that in the x = 1-1.5 region the structure changes from tetragonal to monoclinic at RT.
The initial structural models fitted with the Rietveld profile method were based on Sr2FeMoO6 for x = 0, 0.5 and 1.0 and Ca2FeMoO6 for x =1.5 and 2.0. In Fig.8. (a) and (b) display the observed and calculated X-ray powder diffraction profiles at 300 K of (Sr2-xCax)FeMoO6 with x = 0.5 and 2.0. All the observed peaks can be fitted with the reflection conditions of the space groups I4/mmm for x = 0.5 and
P21/n for x = 2.0, respectively. The ideal crystal structure of x = 0.5 with a tetragonal cell and x = 2.0 with a monoclinic cell at room temperature is shown in the inset. The lattice parameters (a and c) and cell volume (inset of Fig. 9.) decrease with increasing Ca content as shown in Fig.9. which is due to the substitution of the smaller Ca2+ ions (1.34 Å ) for the larger Sr2+ (1.44 Å ) cations. Importantly, these structural parameters indicate that the structure phase transition is continuous.
Fig.7. XRD patterns of (Sr2-xCax)FeMoO6, indexed on a tetragonal unit cell (I4/mmm) for x = 0, 0.5 ,1, and indexed in a monoclinic unit cell (P21/n) for x = 1.5 and 2.0.
The transport properties of (Sr2-xCax)FeMoO6 (x = 0.5, 1.0, and 2.0) are illustrated in Fig.10. Both ñ(H = 0) and ñ(H = 3T) show a semi-metallic behavior over the whole temperature range, down to 5 K. The observed value for x = 2.0, ñ (T = 300 K, H = 0), of 2×10⁻³Ω cm is considerably smaller than that of the Sr doped analogues (x = 0.5 and 1.0). The Ca-doped samples which are characterized by a homogeneous particle size, probably have an improved connectivity, so that the measurements provide a better approximation of the bulk (integrated) resistivity. The more metallic behavior observed for the Ca-doped materials suggests a higher degree of electronic itinerancy.
The Fe L-edge XANES spectra of (Sr2-xCax)FeMoO6 (x = 0 , 0.5 , 1.0 and 1.5) are shown in Fig.11 (a). For comparison, the spectra of FeO, Fe2O3 and Fe2O3 are also plotted. The spectra show two broad multiplet structures separated by spin–orbit splitting (of Fe 2p3/2 and 2p1/2). The chemical shift does not vary significantly although the Fe profile changes systematically when the Ca content is increased from x = 0 to x =1.5. It is well established that an effective Fe valence can be measured from the peak width at the Fe 2p X-ray adsorption edge in FeO and Fe2O3. We therefore adopted the same scheme to obtain the Fe valence. As
20 25 30 35 40 45 50 55 60 (0 2 4 ) (1 3 2 ) (1 2 3 ) (2 2 0 ) (0 0 4 ) (1 2 1 ) (0 1 3 ) (0 2 0 ) (1 1 2 ) (1 10) x = 0
In
te
n
si
ty
2
θ
x = 0.5 x = 1.0 (2 1 -3 )(3 0 1 ) (2 2 2 ) (3 1 0 ) (2 1 -2 ) (2 1 2 ) (1 3 2 ) (1 3 1 ) (31 2 ) (1 1 4 ) (0 2 -1 ) (1 1 1 ) (2 2 1 ) (0 2 -3 ) (1 2 -2 ) (1 2 2 ) (1 1 3 ) (1 2 1 ) (2 1 0 ) (1 2 0 ) (2 0 0 ) (1 1 -2 ) (1 1 2 ) (0 2 0 ) (1 1 0 ) (0 0 -2 ) (1 0 -1 ) (3 0 -1 ) (1 2 3 ) (0 3 -1 ) (1 3 0 )(2 2 -2 ) (1 1 -4 ) (1 3 -1 ) (1 0 -3 ) (1 0 3 ) (0 1 -3 ) (1 1 -1 ) (3 1 -2 ) (2 0 4 ) (31 -2 ) (1 3 -2 ) (0 2 -4 ) (1 0 1 ) (22 -1 ) (1 1 -3 ) (0 0 -4 ) (2 2 0 )T
et
ra
g
o
n
a
l
(
I
4/
mmm
)
M
o
n
o
cl
in
ic
(
P
2
1/n
)
20 40 60 80 100 0.0 0.2 0.4 0.6 0.8 1.0 (a ) x=0.5 I4/mmm C o u n t x 1 0 4 2θ 20 40 60 80 100 120 0.0 0.2 0.4 0.6 0.8 1.0 (b) x=2.0 P 21/n C o u n t x 1 0 4 2θ (a ) o r m a li z e d a b so r b a n c e (a b s. u n it s)6
L
a
tt
ic
e
co
n
st
a
n
t
(Å
)
L
a
tt
ic
e
co
n
st
a
n
t
(Å
)
C el l Vo lu me (Å 3)Fig.8. Rietveld fits to powder XRD data of (Sr2-xCax)FeMoO6 with (a) x = 0.5; space group
I4/mmm and (b) x = 2.0 space group P21/n, at 300K. Observed (crosses) and calculated (solid line) intensities are shown with the difference at the bottom.
Fig.9. Lattice constants (a and c) as a function of x in (Sr2-xCax)FeMoO6 (0 x 2.0). The cell volume as a function of x is shown in the inset.
Fig.10. Temperature dependence of resistivity of the (Sr2-xCax)FeMoO6 (x = 0.5 and 1.0) samples. Effect of a magnetic field of 3 T is shown.
deduced from Fig.11 (a), the Fe valence is much greater than 2+ but less than 3+ over the range of Ca substitution. From the chemical formula (Sr2-xCax)FeMoO6, assuming oxygen stoichiometry, if the valence of Fe is 2+y, then Mo should formally be in the 6-y state. In Fig.11 (b), the Mo M-edge absorption spectra of (Sr2-xCax)FeMoO6 along with
Fig.11. (a) Fe 2p-edge X-ray absorption near edge structure spectra of FeO (Fe2+), Fe2O3 (Fe2.67+), Fe2O3 (Fe3+) and (Sr2-xCax)FeMoO6 (x = 0 , 0.5 , 1.0 and 1.5). (b) Mo 3p-edge X-ray absorption near edge structure spectra of MoO2 (Mo4+), MoO3 (Mo6+) and (Sr2-xCax)FeMoO6 (x = 0 , 0.5 , 1.0 and 1.5).
those of MoO2 (Mo4+), and MoO3 (Mo6+) standards are shown. The intense peaks at the Mo M-edge onset involve 3p-core to 4d final-state transitions. These features can provide a probe of the 4d states, albeit modified by transition matrix element, core-hole-interaction and multiplet effects. Two strong spectral features are clearly visible in the MoO3 standard: the low energy peak (A), due to the 3p to 4d t2g excitations; and the high-energy peak (B), due to 3p to 4de g excitations. A clear decrease in the relative (B)-feature strength strongly supports the Mo-valence reduction with the increasing Ca-content. Moreover, the Mo valence is consistent with a significant value of y<1 in the formal value of 6-y. Hence, an increase in Ca content will tend to valence states of Fe (3d5) and Mo (4d1) to 2 +~3+ and 5+~6+, respectively.
To discuss the anticipated half-metallic features, we first show the electronic structures of double perovskites (Sr2-xCax)FeMoO6 (x = 0 and x = 2.0), calculated by the full-potential augmented plane-wave (FLAPW) method. The calculations were based on the Rietveld refined models of x = 0 with the tetragonal unit cell and x = 2.0 with the monoclinic unit cell. The 0.0 0.5 1.0 1.5 2.0 5.4 0 5.4 5 5.5 0 5.5 5 5.6 0
x
7.7 0 7.7 5 7.8 0 7.8 5 7.9 0 7.9 5 c a 0.0 0.5 1.0 1.5 2.0 228 232 236 240 244 x 0 50 100 150 200 250 300 1 2 3 4 5 6 7 ρ ( 1 0 -3 o h m -c m ) x=1.0 (0T ) x=2.0 (3T ) x= 1.0 (3T ) x=2.0 (0T ) x=0.5 (3T ) x=0.5 (0T ) T em p er a t u r e (K )(a)
7 density of states obtained by this calculation is shown in Figure 12 (a) for x = 0 and 11 (b) for x = 2.0. At the Fermi level (EF), the density of states is non-zero only in the spin-down band. The occupied spin-up band just below EF mainly consists of Fe 3d electrons forming the localized spins on the Fe sites. In contrast, the spin-down band around EF is made up of hybridized Fe 3d t2g and Mo 4d t2g states. The predicted electronic features for Sr2FeMoO6 resembles those calculated by Kobayashi et al. [3] and Fang et al. [5] Compared to Sr2FeMoO6, the change in the spin-up band of Ca2FeMoO6 is minor, but the change in the spin-down band is significant. A splitting of the hybridized Fe 3d t2g and Mo 4d t2g bands is observed in Ca2FeMoO6 for the first time, which may be due to the decrease in of structural symmetry compared to that of Sr2FeMoO6. Moreover, the density of states of the (Sr2-xCax)FeMoO6 (x = 2.0) sample in the spin-down band has a local peak at EF and so is strongly enhanced (by 1.5 times) compared to the x = 0 sample, which is consistent with the resistivity results (the x = 2.0 sample has a higher conductivity than the x = 0 sample).
Conductivity in this system can be viewed as arising from electron transfer from Fe2+ to Mo6+ so the influence of Ca content x on the charge transfer y in (Sr2-xCax)Fe
2+y
Mo6-yO6 is very important. A simple predictor for the change in y is to compare the sums of ionic radii for the extremes of y. For y = 0, r(Fe2+) = 0.78 Å and r(Mo6+) = 0.59 Å and their sum is 1.37 Å ; at y =1, r(Fe3+) = 0.645 Å and r(Mo5+) = 0.61 Å giving a sum of 1.255 Å . Hence, an increase in Ca content will tend to shift the charge balance towards Fe3++ Mo5+ as this allows the transition metal oxide framework to contract, and so y increases with x. This increase in band overlap is supported by our conductivity, XANES and band calculation results.
Fig.12. The total and site-decomposed density of states (D.O.S) of (Sr2-xCax)FeMoO6 (a) x = 0 and (b) x = 2.0
Fig. 12. The total and site-decomposed density of states (D.O.S) of (Sr2-xCax)FeMoO6 (a) x = 0 and (b) x = 2.0
四、結論
LiVMoO6 was successfully synthesized using the conventional solid-state reaction method. We have shown that LiVMoO6 does not possess good structural characteristics for a lithium half cell (Li / LiVMoO6) as a cathode in non-aqueous electrolyte environment. Furthermore, we suggest that LiVMoO6 may instead be considered as an anode material of choice for developing rechargeable lithium-ion battery technology.
The increasing Ca-content in (Sr2-xCax)FeMoO6 samples increases the magnetic moment close to the theoretical value due to a reduction of Fe/Mo anti-site disorder. An increase of conductivity with Ca-doping is also observed resulting from an increase in the Fe 3d-Mo 4d band overlap. This is explained from simple ionic size arguments and is supported by XANES spectra and band structure calculations. We conclude that the chemical pressure effects of doping Ca from Sr site is an important factor in control the charge transfer and hence the electrical and magnetic properties of the magnetoresistive Sr2FeMoO6 type materials.
五、計畫成果自評
We have reached the goals of the research plan, some parts of the results have been publicized in scientific journals [6-21].
8
六、參考文獻
[1] M.S. Michael, A. Fauzi and S.R.S. Prabaharan,
Int. J. Inorg. Mater. 2000, 2, 261. [2] J. Gopalakrishnan, N.S.P. Bhuvanesh, R.
Vijayaraghavan and N.Y. Vasanthacharya, J.
Mater. Chem. 1997, 7, 307.
[3] K. -I. Kobayashi et al., Nature 1998, 395, 677. [4] A. W. Sleight et al., J. Phys. Chem. Solids 1972, 33,
679.
[5] Z. Fang et al., J. Phys. Rev. B 2001, 63, 180407. [6] R. S. Liu et al., Mater. Res. Bull. 2001, 36, 1479. [7] C. H. Shen et al., Mater. Res. Bull. 2001, 36,1139. [8] R. S. Liu et al., Phys. Rev. B 2001, 63,212507. [9] R. S. Liu et al., J. Phys. Chem. Solids 2001, 62,
1847.
[10] C. H. Shen et al., Mater. Chem. Phys. 2001, 72, 281.
[11] R. S. Liu et al., Physica C 2001, 364-365, 567. [12] R. S. Liu et al., Int. J. Inorg. Mat. 2001, 3, 1063. [13] R. Gundakaram et al., IEEE Trans. Appl.
Superconductivity 2001, 11, 03182.
[14] Y.-W. Hsueh et al., Mater. Res. Bull. 2001, 36, 1653.
[15] C. H. Shen et al., J. Solid State Chem. 2001, 156, 117.
[16] G. H. M. Williams et al., Phys. Rev. B 2002, 65, 064508.
[17] B. Ammundsen et al., J. Electrochem. Soc. 2002, 149, A431.
[18] J. -F. Lee et al., Mater. Res. Bull. 2002, 37, 555. [19] C. C. Chem et al., Mater. Res. Bull. 2002, 37,
235.
[20] R. S. Liu et al., J. Mag. Mag. Mat. 2002, 239, 164.
9
(附件)
參加第五屆歐洲應用超導會議報告
劉如熹
國立台灣大學
化學系
一、參加會議經過
第五屆歐洲應用
超導會議 (5
thEuropean Conference on Applied
Superconductivity; EUCAS),於 2001 年 8 月 26 日至 30 日在丹麥
(Denmark) 的 哥 本 哈 根 市 (Copenhagen) 之 丹 麥科 技大 學 (Technical
University Denmark) 舉行。本次會議由該大學 Ole Tonnesen 教授主
辦。來自各個國家之超導領域專家與學者約一千參加。
本次大會共有計有口頭發表論文及海報發表論文 (posters) 八
百八十多篇,主要內容以超導材料之製作與應用為主。其中更加入
最近被發現之 MgB
2新高溫超導材料。
大會首先邀請瑞士的 H.ten Kate 博士介紹物理研究之大尺度超
導 磁 鐵 (Large Scale Superconducting Magnets For Physics
Research) ,其從傳統 NbSn 超導磁鐵至 Bi-Sr-Ca-Cu-O (BSCCO)/Ag
高溫超導磁鐵之應用均有詳細之說明,其於演講中再次強調高溫超
導在高磁場應用之重要性。爾後大會分為下列不同組別舉行,其有:
LTS junctions and circuit、Novel devices、Metrology Applications、Thin
Film Characterization、Transformers、Oscillators integrated receivers
arrays and stacked junctions、coated conductors (Other HTS wires and
tapes )、 BSCCO wires and tapes、Motors and Generators。本人則被
安 排 於 Cuprate bulk material 的海報論文中發表,論文的題目
為 : ”Maturization of High-T
cPrecursar Powders for Use in
Superconducting Tapes” , 主 要 乃 探 討 如 何提 供一 較佳之 前驅物
(precursor)粉末,使其可應用於高溫超導材料之製作。於此論文發表
中,得到較多的與會專家對本研究之肯定,並提供一些寶貴意見,
使我們於此項研究能更完整及更近實用性,
二、與會心得
本次超導會議來自世界各地的學者專家共聚一堂,討論有關各
項超導材料之製作與應用,茲就與會心得分別描述如下:
10
(1) 超導材料及應用
發現新的 MgB
2材料,其超導臨界溫度 T
c為 39 K。目前將其封於
Ni 及 Fe 之管中所得線材臨界電流密度(J
c)於 5 K 及 0 T 下分別可達
2.6x10
6A/m
2及 8.5x10
5A/m
2;而於 4.2 K 及 1.5 T 下分別可達 2.3×10
5A/m
2及 10
4A/m
2。而其中原材料 MgB
2之晶粒(grain size)大小對 J
c之影
響很大。
(2) 參觀 Amager substation AMK 中心
Amager substation AMK 中心主要從事高溫超導之 BSCCO 電纜
於電力系統之應用,其於 2001 年 5 月 28 日已可實際運轉三條 30 米長
之高溫超導電纜,所載之電壓為 30 kV/50 Hz,可提供 2 KA (rms)之電
流,為全世界第一個完成此項研發者。此計畫乃結合 Danish electrical
power companies、 Copenhagen Energy、NESA、Elkraft and Eltra、NKT
Cables、NKT Research、DEFU 與 Danish Technical University。由 Danish
DOE 提供主要之研究經費。
(3)中國大陸的發展
中國大陸於本次會議之公司產品展示中,已推出一家名為英納超
導公司(Innova Superconductor Technology; InnoST),其目前已可生
產 200 公尺之 BSCCO 高溫超導線,因其為大陸第一家高溫超導公司,
故得到與會者之注目。
三、建議
於此會議中全世界已有多家公司推出高溫超導電線及纜,反觀我國
於高溫超導之研究已漸冷卻,屆時若高溫超導之應用呈現景氣時,則
我國之工業界又將陷入向外國外或甚至中國大陸移轉技術之窘境。故
政府於支持各項科技研發時,宜亦應重視需長時投入之研發項目。
四、攜回資料
大會議程手冊。
11
論文發表
‘Matur ization’ of High-T
cPr ecur sor Powder s for Use in Super conducting
Tapes
R.S. Liu
*, R. Gundakaram, S.C. Chang
Department of Chemistry, National Taiwan University, Taipei 10617
Taiwan, R.O.C.
L. Woodall and M. Gerards
Merck KGaA, Darmstadt 64271, Germany
Abstr act
In recent years, the focus of research on high-T
csuperconductors has
shifted towards the use of these materials in practical applications.
Superconducting tapes and wires have the potential for use in power
transmission. After fabrication, the tapes are subjected to mechanical and
thermal treatments, causing changes in the phase assemblage to occur within. It
is therefore of paramount importance to understand the behaviour of the
precursor powders under different heat treatment schedules. In this paper, we
present our studies on precursor powders with the nominal starting composition
Bi
1.7Pb
0.4Sr
1.8Ca
2.2Cu
3.2O
ysynthesized by spray pyrolysis. By a combination of
X-ray diffraction and magnetization studies, we have identified a ‘mature’
heating schedule, by which we can control the Pb content in the (Bi,Pb)-2212
precursor powders, which we take as the schedule for optimum conversion to
the (Bi,Pb)-2223 phase.
12
1. Intr oduction
Since the discovery of high-
T
Csuperconductivity in Bi
2Sr
2Ca
n-1Cu
nO
2n+4[1],
intense research activity has led to the discovery of several new phases in this
system. While most of the subset members seem to be non-superconducting, the
n = 1, 2 and 3 members (also known as 2201, 2212 and 2223) show
superconductivity with transition temperatures (
T
C) around 6 K, 85 K and 110 K
respectively [2]. The Bi-Sr-Ca-Cu-O system possesses a very complex phase
diagram and synthesis of single-phase members with higher values of
T
Cis
difficult due to the problem of intergrowths. The phase field is further
complicated due to the addition of an extra element, Pb, which is necessary to
stabilize the n = 3 member of the above-mentioned series [3].
From the point of view of practical applications, power transmission with
negligible loss is an area where high-
T
Csuperconductors have a great potential.
The proposed devices are tapes and wires, which are usually manufactured by
the powder-in- tube method where the precursor powder is densely filled into
Ag tubes and drawn into the necessary shape. The products are then subjected
to different mechanical and thermal processes.
The n = 3 member, i.e., the (Bi,Pb)
2Sr
2Ca
2Cu
3O
yphase, is of choice due
to its high
T
Cand
J
Cvalues. However, synthesis of this composition in single
phase is difficult. Different phases in the phase diagram coexist at different
temperatures and it is very important to understand the influence of the
fabrication conditions on the phase assemblages; such knowledge would help in
optimizing the phase of choice while minimizing additional phases. Since the
tapes and wires are subjected to various heat treatments in the fabrication
process, it is desirable to start with a suitable precursor powder and let it
convert to the (Bi,Pb)-2223 phase inside the tape or wire.
This study aims at understanding the effect of different processing
conditions on the precursor powders towards conversion to 2223. In the first
step, we had undertaken a comparative study of the different synthesis methods
[4] and concluded that the powders prepared by the method of spray pyrolysis
are most suitable for conversion to the (Bi,Pb)-2223 phase. In this paper, we
report heat-treatment studies on the phase Bi
1.7Pb
0.4Sr
1.8Ca
2.2Cu
3.2O
yand suggest
a ‘mature’ heating schedule, which we take as the schedule for optimum
conversion to the (Bi,Pb)-2223 phase.
2. Exper imental
The
precursor
powder
with
the
nominal
composition
Bi
1.7Pb
0.4Sr
1.8Ca
2.2Cu
3.2O
ywas synthesized by the method of spray pyrolysis [4]
at Merck KGaA. Different batches of the ‘as-prepared’ powders (i.e., those
obtained from the spray pyrolysis unit) were heat-treated at 730ºC and 800ºC
13
for 24 h each and then at 810ºC for 12 h with intermediate grindings. Following
this, they were heated at 820ºC for varying durations. For conversion to the
(Bi,Pb)-2223 phase, the powders were heated at 842ºC for 12, 24, 48 and 72 h.
Powder X-ray diffraction (XRD) patterns were recorded after each heat
treatment on a Scintag D1 powder diffractometer. The diamagnetic behaviour
was studied by means of DC magnetic susceptibility, measured on a SQUID
magnetometer (Quantum Design).
3. Results and Discussion
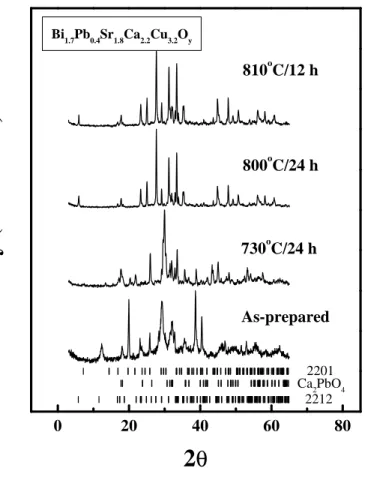
Fig. 1 shows the powder XRD patterns of the as-prepared sample and after
initial treatments at 730ºC and 800ºC for 24 h each and at 810ºC for 12 h. After
the 730ºC treatment, the sample consists mostly of the 2201 phase, with
Ca
2PbO
4(CP) present as the major secondary phase. After the treatments at
800ºC and 810ºC, the 2212 phase evolves as the majority phase, with CP as the
secondary phase. Following the treatment at 810ºC, the powders were heated at
820ºC for 12, 24 and
36 h, followed by treatments at 842ºC for varying durations. The treatment at
842ºC is for the conversion to the (Bi,Pb)-2223 phase.
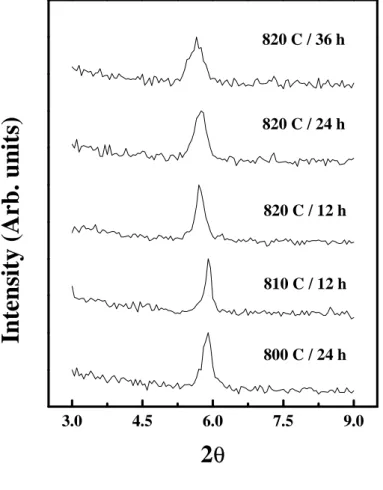
Fig. 2 shows the low-angle (002) reflection in the XRD patterns of the
powders after treatments at 800ºC, 810ºC and 820ºC. As can be seen, there is a
shift to lower 2θ with increasing temperature and time, indicating that the larger
Pb
+2ion substitutes the smaller Bi
3+site [5]. Our heat treatment schedule thus
offers a method of controlling the amount of Pb in the (Bi,Pb)-2212 precursor
powder, which may be an important factor in the optimum conversion to the
2223 phase.
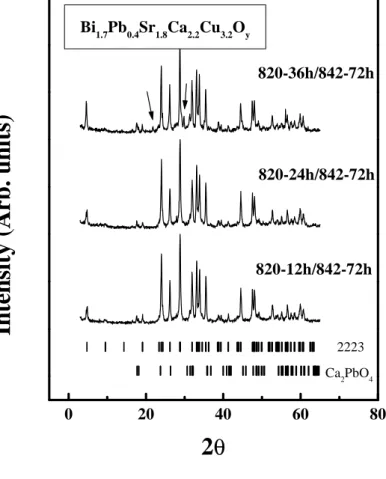
Fig. 3 shows the XRD patterns of the powders after treatment at 820ºC
for 12, 24 and 36 h, followed by heating at 842ºC for 72 h (three treatments
each of 24 h with intermediate grindings). It can be seen that when the powder
is heated for a longer duration at 820ºC, the XRD pattern shows extra
reflections (indicated by arrows in the figure) indicating the appearance of
impurity phases. Thus, we find that a shorter duration of treatment at 820ºC for
12 h is ideal.
In the process of conversion to the 2223 phase, samples heated for
durations of 24 h or less show the presence of the 2212 phase and hence a
longer duration of heating is necessary. Samples heated at 820ºC for 12 h
followed by treatments at 842ºC for 72 h show nearly single phase 2223, with
CP as the minor secondary phase.
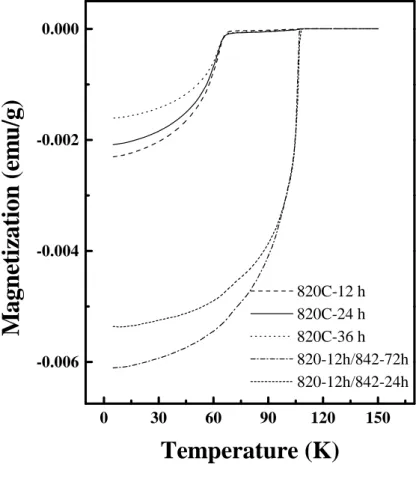
Fig 4 shows the temperature variation of magnetization for the samples
treated for different durations at 820ºC and 842ºC. The samples for
susceptibility measurements were carefully weighed and nearly the same mass
14
of the sample was used for each run so that the magnitude of the signal is
proportional to the superconducting volume fraction. It can be seen from Fig. 4
that with increasing duration at 820ºC, the strength of the diamagnetic signal
decreases, showing a decrease in the superconducting volume fraction, which is
probably due to the appearance of an impurity phase. This is in agreement with
the result obtained from the XRD study.
The two curves on the right side of the Fig. 4 are after conversion to the
(Bi,Pb)-2223 phase. Again, it can be seen that the magnitude of the signal is
larger for the powder heated for 72 h at 842ºC, showing that a combination of
lower heating times at 820ºC and longer durations at 842ºC is favourable for
optimum conversion.
In conclusion, we find that for the precursor powder with the composition
used in the present study, treatments at 730ºC, 800ºC, 810ºC and 820ºC,
followed by heating at 842ºC is suitable for conversion to the (Bi,Pb)-2223
phase. We suggest this schedule as the ‘mature’ schedule for precursor powders
with the composition used in the present study. Powders heated for longer
durations at 820ºC show the growth of additional phases.
Acknowledgments
The authors thank the National Science Council of Taiwan (grant no. NSC
90-2113-M-002-048) and Merck KGaA, Germany, for financial support of this
work.
Refer ences
1. H. Maeda, Y. Tanaka, M. Fukutomi and T. Asano, Jpn. J. Appl. Phys. 27
(1988) L209.
2. See P. J. Ford and J. A. Saunders, Contemp. Phys. 38 (1997) 63.
3. P. Majewski, S. Kaesche and F. Aldinger, J. Am. Ceram. Soc. 80 (1997)
1174.
4. Y.-W. Hsueh, S.C. Chang, R.S. Liu, L. Woodall and M. Gerards,
Mater. Res. Bull. 36 (2001) 1653.
5. R.S. Liu, S.C. Chang, R. Gundakaram, J.M. Chen, L.Y. Jang, L. Woodall
and M. Gerards, Physica C (2001), in press.
15
Figur e Captions
Fig. 1 XRD patterns of the powders at different stages of the heat treatments.
The vertical bars at the bottom of the figure indicate the calculated peak
positions for each phase.
Fig. 2
The low-angle (002) reflection in the XRD patterns of powders after
treatments at 800º, 810ºC and 820ºC.
Fig. 3 XRD patterns after treatments at 820ºC for different durations, followed
by treatments at 842ºC for 72 h.
Fig. 4
Temperature variation of magnetization at different stages of the heat
16
0
20
40
60
80
2212 Ca22012PbO4 Bi1.7Pb0.4Sr1.8Ca2.2Cu3.2Oy810
oC/12 h
800
oC/24 h
730
oC/24 h
As-pr epar ed
In
te
n
si
ty
(
A
rb
.
u
n
it
s)
2
θ
17
3.0
4.5
6.0
7.5
9.0
820 C / 36 h
820 C / 24 h
820 C / 12 h
810 C / 12 h
800 C / 24 h
In
te
n
si
ty
(
A
rb
.
u
n
it
s)
2
θ
18
0
20
40
60
80
Bi
1.7Pb
0.4Sr
1.8Ca
2.2Cu
3.2O
y820-36h/842-72h
820-24h/842-72h
820-12h/842-72h
2223 Ca2PbO4In
te
n
si
ty
(
A
rb
.
u
n
it
s)
2
θ
19