活性碳去除消毒副產物生成前質
及其生成潛能之模式分析(3/3)
NSC 90-2211-E-002-005
計畫主持人:蔣本基教授、張怡怡教授
執行期間:90 年 8 月 1 日至 91 年 7 月 31 日
Chapter I INTRODUCTION
Since the increasing pollutions from industrials, agricultures and domestic discharge, water suppliers have to employ advanced processes to ensure their water meeting regulations, and further to supply higher quality and more stable water.
Granular activated carbon (GAC) adsorption has been widely used on water treatment and wastewater treatment for decades. In spite of the high efficiency for removing pollutants, the regeneration of exhausted GAC will raise the cost and operational problems when using GAC. On the other hand, the biological activated carbon (BAC), which possesses both adsorption and biodegradation properties, has become in focus.
Using BAC can reduce the demand of chemical dosages, and can elongate the useful life of GAC beds; however, there are still some problems of BAC to solve. Although some empirical approaches have been reported, no theoretical model has been proposed for BAC columns. Hence, to quantify and differentiate the capacities of adsorption and biodegradation is the major study of BAC. Furthermore, studies of the effects of operational conditions, i.e. hydraulic loading, can improve the performance of BAC for practical application.
The objectives of this thesis are intended to:
1. Evaluate the effect of hydraulic loading on adsorption and biodegradation on BAC, and then quantify the performance of adsorption and biodegradation through isotherm tests.
2. Evaluating the effect of hydraulic loading on biomass and bioactivity profiles, and the eco-system of the microbial on BAC column.
3. Develop a mathematical model for the quantification of the above behaviors of BAC column, and further to simulate operational conditions for water treatment applications.
Chapter II LITERATURE REVIEW
2-1 The Usage of BAC
The granular activated carbon (GAC) has been applied to the waste water and potable water industry to eliminate dissolved organic matter for many years. The bioactivity occurring on the surface of the activated carbon granules can effectively elongate the useful life of GAC (Servais et. al., 1991; LeChevallier et. al., 1992; Servais et. al., 1996), so that the mechanism of the filtering media for reducing organic matters changes from adsorption to biodegradation and called the biological activated carbon (BAC).
2-1-1 Benefits of Using BAC
In comparison with Physic-chemical processes, the BAC has the below advantages:
1. It can remove most BDOC, so that solve the re-growth and fouling problems in distribution systems efficiently (Rittmann and Snoeyink, 1984; Huch et al., 1991). 2. It can lower the regeneration cost and prolong the useful life of GAC (Servais et al.,
1991, 1996; LeChevallier et al., 1992).
3. It can remove ammonia nitrogen as well as Fe(II) and Mn(II) (Rittmann and Snoeyink, 1984).
4. It can lower the demand of post-chlorination, so that reduce the cost and formation of chlorinated DBPs (Le Chavallier, 1992).
2000).
2-1-2 Problems of Quantification
However, the adsorption and biodegradation steps are present simultaneously in the BAC bed, and it is rather difficult to differentiate the predominant mechanism. Consequently, one of the major problems concerning the application of BAC is to identify and quantify the contaminant removal mechanisms on the granules. The adsorption and biodegradation mechanisms overlap in BAC bed and it is difficult to recognize the predominant mechanism (Servais et al., 1991).
Chang and Rittmann (1987) developed a mathematical model to quantify the extent of adsorption and biodegradation characteristics of biofilm on activated carbon. However, their model was not applicable under unsteady condition nor in a plug-flow system. Column experiments with curves have been used to determine the capacities of GAC and BAC, but the interactions between the two mechanisms remains unclear (Carlson et al., 1994).
2-2 Effects of Ozonation on BAC
2-2-1 The Gener ation of Ozonation by-ProductsOzone has been widely applied on water treatment for the reduction of organic matters as well as chlorinated disinfection by-products precursors (Jacangelo et al., 1989; Singer, 1990; Amy et al., 1991; Galapate et al., 2001). In addition, due to the modification of the high molecular weight fraction of dissolved organic matter to prevent large pores from blockage, ozonation can effectively improve the performance of granular activated carbon (GAC) to remove natural organic matters (Pelekani and Snoeyink, 1999; Ebie et al., 2001).
Unfortunately, numerous investigators have identified ozonation by-products (OBPs) as low molecular weight aliphatic aldehydes and mixed functional and saturated carboxylic acids (Weinberg and Glaze, 1997; Gracia et al., 1996), which can be related to possible adverse health effects and are highly biodegradable (Schechter and Singer, 1995).
2-2-2 Effects on Adsor ption and Biodegr adation
For removal of organic pollutants, ozone is often coupled with GAC or BAC as a pretreatment process. It is well established that ozonation can enhance biodegradation (Dewaters and DoGiano, 1990; Goel et al., 1995; Urfer et al., 1997; Cipparone et al., 1997; Griffini et al., 1999), and hence cause microbial re-growth problem in distribution system (van der Kooij et al., 1982; Lehtola et al., 2001).
On the other hand, one of the prominent effects of ozonation on activated carbon adsorption is the generation of some intermediates that are unfavorable for adsorption because of the increase in polarity and hydrophilicity (Glaze and Wallace, 1984). Typical ozonation by-products of DOM include low molecular-weight
aliphatic aldehydes, and mixed functional and saturated carboxylic acids (Glaze et al., 1989; Gracia et al., 1996; Weinberg and Glaze, 1997). In general, ozonation can increase the hydrophilicity of DOM, without significant degradation of dissolved organic carbon, or DOC (Galapate et al., 2001), and cause a negative effect on the removal of the low-molecular-weight organics via adsorption. Hence, additional treatment processes should be considered to prevent those disadvantages occurring.
2-3 Effects of Operational Conditions on BAC
2-3-1 Effects of Hydr aulic LoadingAnother problem concerned for BAC column operation is the hydraulic loading. It has been reported that contact time significantly influences the performance of a biological filter (Ufer et al., 1997). Previous studies reported that biomass concentration profiles in biofilter beds varied markedly with the influent mass flow of biodegradable organic matter; that is, higher biodegradable organic matter mass flow rates will increase the concentration of surface biomass and the depth of penetration (Carlson and Amy, 1998). Meanwhile, in a pilot-scale study using natural water as the organic source, the amount of attached biomass decreased as filter depth increased, suggesting that most biodegradation occurred at the top in the filter, and biomass concentration was related to the concentration of the organic substrate (Wang et al., 1995).
2-3-2 Differences of Using Var ious Media
The alternatives media used in biofilter are with adsorption capacity such as GAC, and without adsorption capacity such as anthracite, quartz sand. In the case of using GAC, the meso and micro pores (<100 nm) are too small for bacteria to enter, which is often considered greater than 200 nm. So the affects usually caused by the surface properties of the used media (Urfer et.al., 1995).
2-4 The Growth of Bacterial on BAC Granular
The bioactivity can be expressed directly due to total plate counting, biological oxygen demand (BOD), respiration measurement; indirectly in forms of dissolved oxygen reduction, pH reduction, and turbidity increase (Scholz and Martin, 1997). The biomass concentration is one of the most important parameters governing the overall removal of organic contaminants. In the presence of solid media such as GAC, it was able to enhance the attached bacterial activity (Saito et al., 1996). On the other hand, the adsorption capacity of the biologically regenerated GAC was low in comparison to that of new GAC, which implied that bacteria may not be able to fully utilize the substances adsorbed on GAC (Nakano et al., 2000).
Ozonation may also change the ecology of microorganisms attached on the media. Takeuchi et al. (1996) made a comparison of microorganisms ecology on GAC between the column influent w/o ozonation. The results showed that bacteria preferring high dissolved oxygen shuc as Rotaria sp. and Colurella sp. only be
detected in the ozonation case, which implied that ozonation can ensured the dissolved oxygen being kept at a certain level in the BAC column, so that prevent from Litonotus sp. or Colpidium sp. which is the indicator of bad operating condition.
Table 2-1. Microorganisms detected in GAC columns w/o ozonation
Ozonated Unozonated
Paramecium sp. (wide BOD range) Paramecium sp. (wide BOD range)
Vorticella sp. (good condition) Lepadella sp. (very low BOD) Rotaria sp. (high DO)
Litonotus sp. (bad-recovering condition) Arcella sp. (low BOD, high pH)
Colurella sp. (low BOD, high DO)
Monostyla sp. (low BOD) Actinophrys sp. (a little high loading) Colpidium sp. (bad condition)
Chapter III MATERIALS and METHOD
3-1 Overview of Experiments
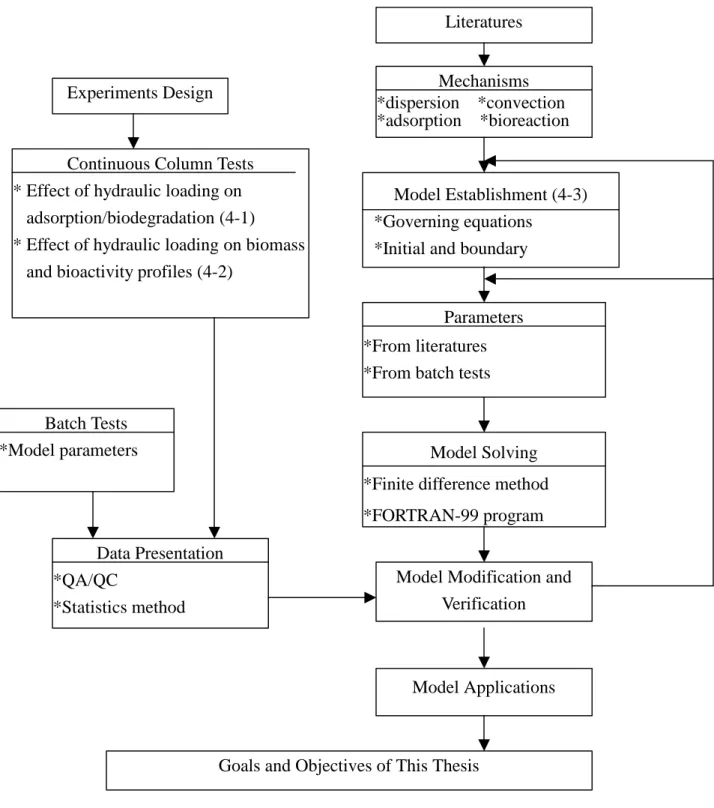
Figure 3-1. Schematic Flow Chart of the Thesis Mechanisms *dispersion *convection *adsorption *bioreaction
Model Establishment (4-3) *Governing equations
*Initial and boundary conditions
Parameters *From literatures *From batch tests
Model Solving *Finite difference method *FORTRAN-99 program
Model Applications Literatures
Experiments Design
Model Modification and Verification
Goals and Objectives of This Thesis Continuous Column Tests
* Effect of hydraulic loading on adsorption/biodegradation (4-1)
* Effect of hydraulic loading on biomass and bioactivity profiles (4-2)
Batch Tests *Model parameters
Data Presentation *QA/QC
Exper imental appar atus
Water flow Chemical flow Ozone flow On-line sensor
A. Stor age tank
B. Per istaltic pump I
C. Per istaltic pump II
D. Chemical Stor age tank E. Mixing tank H. Per istaltic pump III L. Per istaltic pump IV F. 25 oC water bath I. Ozone gener ator J . Ozone r eactor K. Ozone de-gas tank M. On-line sensor I
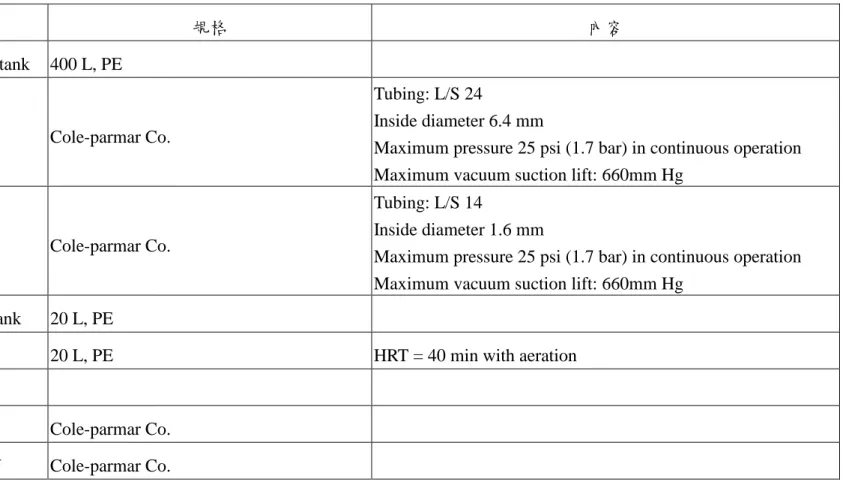
表 3-1 設備規格與內容
編號 名稱 規格 內容
A Raw water storage tank 400 L, PE
B Peristaltic pump I Cole-parmar Co.
Tubing: L/S 24
Inside diameter 6.4 mm
Maximum pressure 25 psi (1.7 bar) in continuous operation Maximum vacuum suction lift: 660mm Hg
C Peristaltic pump II Cole-parmar Co.
Tubing: L/S 14
Inside diameter 1.6 mm
Maximum pressure 25 psi (1.7 bar) in continuous operation Maximum vacuum suction lift: 660mm Hg
D Chemical storage tank 20 L, PE
E Mixing tank 20 L, PE HRT = 40 min with aeration
F 25 oC water bath
G Peristaltic pump III Cole-parmar Co. H Peristaltic pump IV Cole-parmar Co.
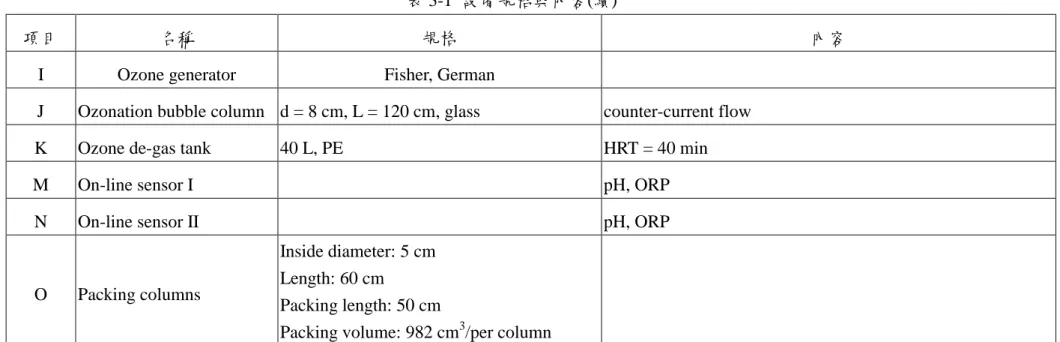
表 3-1 設備規格與內容(續)
項目 名稱 規格 內容
I Ozone generator Fisher, German
J Ozonation bubble column d = 8 cm, L = 120 cm, glass counter-current flow
K Ozone de-gas tank 40 L, PE HRT = 40 min
M On-line sensor I pH, ORP
N On-line sensor II pH, ORP
O Packing columns
Inside diameter: 5 cm Length: 60 cm
Packing length: 50 cm
3-2 Effect of Hydraulic Loading on Adsorption and
Biodegradation of Biological Activated Carbon
3-2-1 Appar atus
The effective length of the experimental column is 50 cm, with 5-cm-diameter glass columns. Tap water (total organic carbon and ammonia nitrogen < 0.1 mg/L) was pre-aerated for dechlorination and saturating the dissolved oxygen (DO). The aerated water was pumped (Cole-Parmer) through a water bath heater (25 oC) to a mixing tank with the feed solution. Hydraulic loading (HL) was controlled at 12, 6, 3, 2 and 1.2 m/hr.
3-2-2 Media
The packing media were GAC and glass beads. The GAC used in this study was "SorboNorit 3" (Norit, crashed and sieved from 2.4 to 2.0 mm size), and the glass beads were 2 mm in diameter. The media were washed by de-ionized water (Milli-Q SP) and then dried at 250 oC for 24 hours. The “GAC column” was packed with the baked GAC; while the “glass bead” column and “BAC” column were packed with the seeded glass beads and GAC, respectively. For seeding, the media were immersed in natural pond water supplemented with feed solution; after aerated for 48 hours, the media were washed by de-ionized water to remove residual organics and then packed into the respective column.
3-2-3 Water Samples
The feed solution consists of four OBPs, which included two aldehydes (formaldehyde and glyoxal, Sigma), and two ketoacids (glyoxalic and ketomalonic acid, Sigma); each initial concentration was 200, 200, 400 and 400 ìg/L, respectively.
Mineral nutrients (KH2PO4, K2HPO4, Na2HPO4, KNO3, MgSO4, CaCl2, FeCl3, and
NaHCO3) were added in the feed solution.
3-2-4 Adsor ption deter mination
The equilibrium adsorption capacity of a virgin GAC was evaluated by an isotherm test at 25 oC for four days. Glyoxal (with 10-3 M phosphate buffer) was used as a target compound to represent the organic carbon (OC). GAC granular was crashed into powder to shorten the equilibrium time. The initial concentrations of glyoxal were 50 and 100 mg/L (as 20 and 41 mg OC/L), and various GAC dosages (0.2 to 1.4 g) were added to yield the equilibrium concentrations ranging from 0.1 to 30 mg OC/L. Similar procedure was used to evaluate the residual adsorption capacities of GAC and BAC granular: two cm3 media (with 0.62 g dry-weight) was taken out from various depths of the experimental columns (0, 10, 20 and 30 cm from the top), after manually crashing sample was put in a screw-cap bottle, with 50 mg/L glyoxal (20 mg/L as OC), phosphate buffer and a small amount of HgCl2. After
shaking 48 hrs, the difference of solution final to its initial concentration was determined as the residual adsorption capacity (mg OC/g-granular). In this research, the quantity of OC absorbed on the GAC granular was defined as the difference between residual adsorption capacity and the equilibrium adsorption capacity, which is derived from the result of isotherm test.
3-2-5 Analytical methods
Aldehydes were analyzed using the method described by Sclimenti et al. (1990). O-(2,3,4,5,6-pentafluorobenzyl)-hydroxylamine hydrochloride (PFBOA.HCl) and potassium hydrogen phthalate/NaOH buffer (pH 6) reacts with carbonyl compounds in aqueous solution to form the corresponding oximes. Derivatives were then extracted with n-hexane. The extract was analyzed using GC-ECD (HP 5890)
with a fused silica capillary column (DB-5, 30m * 0.25mm ID, 1.0m film thickness). Modified procedure was used to analyze the ketoacids. The deviation procedure of PFBOA.HCl was similar but without buffer adding, and followed by an acidification procedure. Then 4 mL Methyl tert-butyl ether (MTBE) was added for extraction.
The extract was then methylated by diazomethane in MTBE solution. After quenching the excess diazomethane by little silica gel samples were analyzed with GC-ECD. Detailed procedure was also described by Melin and Ø degaard (2000).
3-3 Effect of Hydraulic Loading on the Profiles of Biomass and
Bioactivity in BAC Column
3-3-1 Appar atus Same as Section 3-3. 3-3-2 Media Same as Section 3-1. 3-3-3 Water samples Same as Section 3-3.
3-3-4 Biological par ameter s deter mination
Media were taken out at the top of Columns I and II, and placed into 200-mL sterilized saline buffer with ultrasonic vibration for the measurement of viable biomass. The biomass was enumerated by heterotroph plate counting on tryptone glucose extract agar. The bioactivity of the media in terms of the removal of biodegradable organic matters was assessed by the respirometric method (biomass respiration potential, BRP) proposed by Urfer (Urfer and Huck, 2001). Briefly, a given amount of media was placed in an autoclaved BOD bottle (about 300 mL) filled with the aerated tap water, and DO was measured with the feed solution using a DO-probe (Oxi330i, WTW). The DO was measured again after incubation for 5 hours on a shaker table, and the bioactivity was expressed as the difference of DO in mg O2/L per cm3 media.
3-3-5 Analytical methods
Chapter IV RESULTS and DISCUSION
4-1 Effect of Hydraulic Loading on Adsorption and
Biodegradation of Biological Activated Carbon
4-1-1 Effects of EBCT on biodegr adation
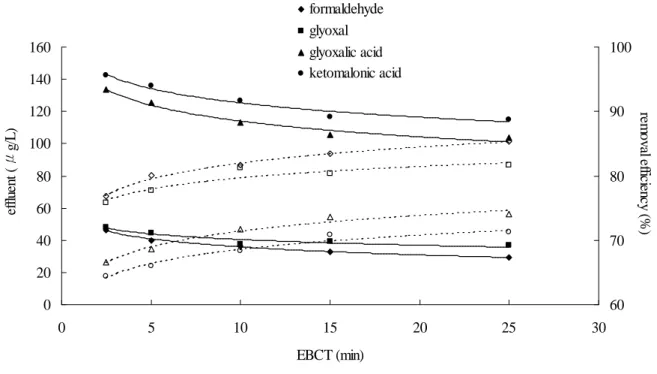
The mechanism in the glass bead column is considered as a sole biodegradation phenomenon, and the effluent of four OBPs is shown in Figure 4-1-1. One of the effects of EBCT on removing OBPs was the minimum substrate concentration (Smin)
maintained on the surface of the steady-state biofilm, which was first reported by Rittmann and McCarty (1980). In this research, biodegradation was initiated from an unsteady to a steady-state condition after approximately 15 days operation when the effluents varied within ±15% range of the average. Besides the influent concentration, the values of Smin at various EBCTs shown in Figure 4-1-1 indicates
that there is a trend forSmin to decrease with an increase in EBCT; i.e., Smin changed
from 46.4 to 26.7 ìg/L as the EBCT went from 2.5 to 25 min for formaldehyde.
The removal efficiencies at steady state for the four OBPs are also shown in Figure 4-1-1. In contrast to Smin values, the removal efficiencies increase as the EBCT
increases. However, the incense is insignificant in comparison with the extension of EBCT; i.e., the EBCT extends from 2.5 to 25 min whereas the removal efficiency increases only from 78 to 85%. It has been reported that the external mass transfer has little effect on the performance of a biofilter. Although extending the EBCT can reduce the Smin value and increase the removal efficiency, the improvement is trivial
Figure 4-1-1. Effluent concentrations removal efficiencies of the glass bead column.
With regard to the other OBPs, glyoxal exhibited a trend similar to that of formaldehyde, but the average Smin was greater (47.3 to 35.3 ìg/L) than that in the
formaldehyde, which showed that the biodegradation equilibrium of glyoxal is slower than that of formaldehyde. On the other hand, the equilibrium effluent concentrations of the two ketoacids were much higher. One of the reasons is the influent concentrations of the two ketoacids (400 ìg/L) were double those in the aldehydes cases (200 ìg/L); as a result, Smin (133.8 to 103.6 and 142.2 to 115.1 ìg/L)
were much higher than those in the aldehydes.
0 20 40 60 80 100 120 140 160 0 5 10 15 20 25 30 EBCT (min) ef flu en t (μ g/ L ) 60 70 80 90 100 re m o va l e ffic ie nc y ( % ) formaldehyde glyoxal glyoxalic acid ketomalonic acid
4-1-2 Deter mination of adsor ption capacities
To determine the adsorption capacities of BAC, the residual adsorption capacity approach was used to calculate the amount of OC absorbed. The presentation of the four OBPs was translated as the summary of OC. Although their carbon constitutions are different, i.e., 40%, 41%, 32% and 27% for formaldehyde, glyoxal, glyoxalic acid and ketomalonic acid, respectively, in this research glyoxal was chosen as the target compound in the isotherm test. Figure 4-1-2 shows the result of adsorption isotherm test expressed by the Freundlich equation:
n e F
e K C
q =
where qe is the amount absorbed at equilibrium (mg OC/ g-granular), KF and n are
Freundlich parameters, and Ce is the concentration of solution at equilibrium (mg/L).
Figure4-1-2. Isotherm of virgin GAC granular for glyoxal (C0 = 20, 41 mg/L as
organic carbon.) 1 10 100 0.01 0.1 1 10 100 Ce (mg/L) qe ( m g/ g)
Figure 4-1-3. Breakthrough curves of four OBPs of the GAC column (a) formaldehyde, (b) glyoxal, (c) glyoxalic acid and (d) ketomalonic acid.
(a) 0 50 100 150 200 0 5000 10000 15000 20000 25000 HL=12 HL=3 HL=1.2 (m/hr) (b) 0 50 100 150 200 0 5000 10000 15000 20000 25000 (c) 0 50 100 150 200 250 300 350 400 0 5000 10000 15000 20000 25000 e ff lu e n t (μ g /L ) (d) 0 50 100 150 200 250 300 350 400 0 5000 10000 15000 20000 25000 bed volume Influent concentration Influent concentration Influent concentration Influent concentration
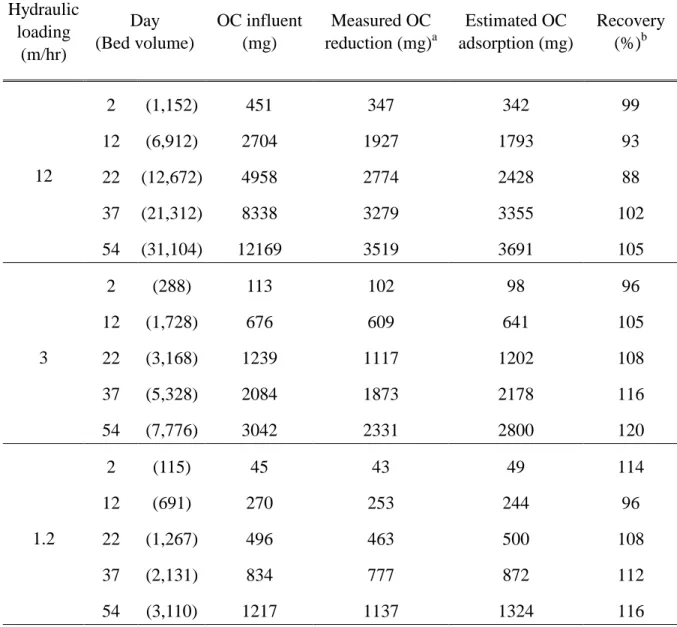
As mentioned above, the quantity of OC absorbed on the granular GAC was defined as the difference between the residual adsorption capacity and the equilibrium adsorption capacity, which is derived from the result of the isotherm test. For the GAC column, the amounts of OC absorbed on GAC at various depths along the column are shown in Figure 4-1-3. Furthermore, the average OC that has been absorbed on the unit GAC can be derived from extrapolating (show in Figure 4), and then multiplied by the total mass of granular GAC in the GAC column (g-GAC) can derive the total amount of OC absorbed on the GAC column. The results are shown in Table 1.
The estimation of mass balance for the absorbed OC in GAC column is shown in Table 4-1-1. In this research the influent concentration was kept constantly, so the cumulative OC mass inflow was simply proportional to the operation time and HL (the third column from left). The removed OC was determined as the difference of the column influent and the effluent multiplied by the water volume treated (the fourth column from left), which represented the mass of OC removed from the liquid phase. Compared with that in the solid phase, the total amount of OC absorbed on the GAC column, the mass balance then can be derived (represented as the recovery ratio, %). In this research, the results of mass balance represented by the recovery ratios were between 100±20% ranges.
Table 4-1-1. Mass balance of organic carbon absorbed on GAC. Hydraulic loading (m/hr) Day (Bed volume) OC influent (mg) Measured OC reduction (mg)a Estimated OC adsorption (mg) Recovery (%)b 2 (1,152) 451 347 342 99 12 (6,912) 2704 1927 1793 93 22 (12,672) 4958 2774 2428 88 37 (21,312) 8338 3279 3355 102 12 54 (31,104) 12169 3519 3691 105 2 (288) 113 102 98 96 12 (1,728) 676 609 641 105 22 (3,168) 1239 1117 1202 108 37 (5,328) 2084 1873 2178 116 3 54 (7,776) 3042 2331 2800 120 2 (115) 45 43 49 114 12 (691) 270 253 244 96 22 (1,267) 496 463 500 108 37 (2,131) 834 777 872 112 1.2 54 (3,110) 1217 1137 1324 116
a: Difference in influent and effluent concentration times the treated volume. b: Fraction between estimated OC adsorption to measured OC reduction.
In summary, the result of mass balance shows that measuring the residual adsorption capacity can derive a reasonable estimation of OC removal by adsorption, and this approach method can be applied to estimate the adsorption quantity of BAC. Consequently, the quantities of organic removal by adsorption or biodegradation by the BAC column can then be differentiated.
4-1-3 Effect of HL on adsor ption
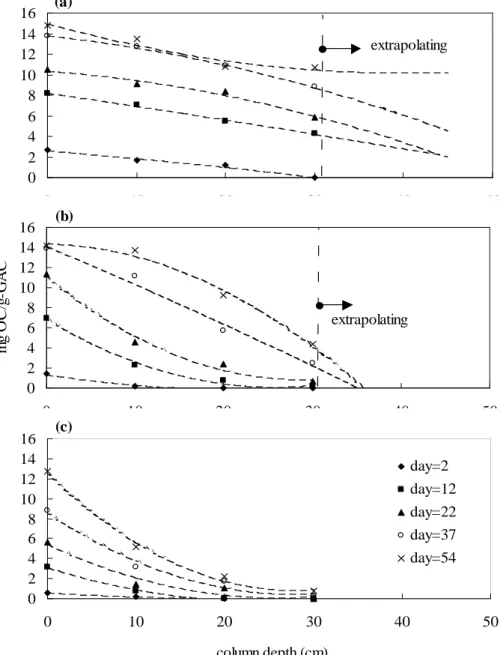
Figure 4-1-4. Organic carbon absorbed by GAC granular at hydraulic loading, (a) 12, (b) 3, and (c) 1.2 m/hr.
The breakthrough curves for four OBPs of the GAC column are shown in Figure 4-1-3. The major effect of HL is that operating at higher HL condition can not
(a) 0 2 4 6 8 10 12 14 16 0 10 20 30 40 50 (b) 0 2 4 6 8 10 12 14 16 0 10 20 30 40 50 m g O C /g -G A C (c) 0 2 4 6 8 10 12 14 16 0 10 20 30 40 50 column depth (cm) day=2 day=12 day=22 day=37 day=54 extrapolating extrapolating
effectively remove OBPs due to adsorption being not equilibrium; and this phenomenon implies that external mass transfer plays a more important role in adsorption. On the other hand, the effluent concentrations in HL=12-m/hr were higher than those in the low HL case before breakthrough, but at HL=3 m/hr the GAC column began breakthrough after 5,000 bed volume operation; in the meantime the effluent concentration was greater that that in HL=12-m/hr.
Again, the concentration of OC absorbed within the GAC column (Figure 4-1-4) can provide information about the effect of HL on adsorption. It should be noted that influent concentration level was less than 0.5 mg OC/L; the corresponding qe is 16 mg
OC/mg-granular. For high HL condition, Figure 4-1-4(a), the absorbed OC profiles are “smoother” than those in the other lower HL cases. In addition, there remained a little adsorption capacity after 12 days operation (about 7,000 bed volume), while the GAC column was at breakthrough. This evidence implies that at such HL values, the adsorption did not reach equilibrium.
4-1-4 Per for mance of the BAC column
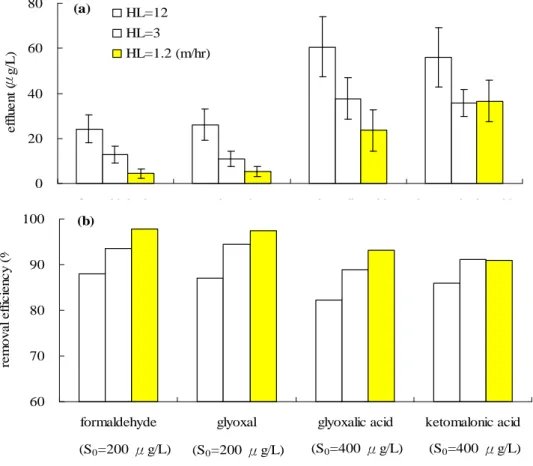
The statistical results of the effluent concentrations of the four OBPs in the BAC column are shown in Figure 4-1-5(a). Even at the high HL condition, it is noticeable that the effluents of the four OBPs of the BAC column were all kept at a certain level (24, 26, 71 and 56 ìg/L, respectively) less than the Smin values of the glass bead
column, no matter whether the GAC column was at breakthrough. The results suggest that BAC has an additional effect of removing organics. However, it should be mentioned that the effluent concentrations of the four OBPs were still quite high at the high HL condition, even though the removal efficiencies were quite well (> 90%). This phenomenon is probably due to adsorption not being at equilibrium at this HL. On the other hand, the removal efficiencies under various HL are shown in Figure
4-1-5(b). It should be mentioned that the improvement of removal efficiency by extending EBCT is more significant than with the glass bead; i.e., the removal efficiency for formaldehyde is upgraded from 88 to 98%. This improvement may be attributed to the equilibrium of adsorption through extending the contact time.
Figure 4-1-5. Average effluent concentrations (a) and removal efficiencies (b) of the BAC column.
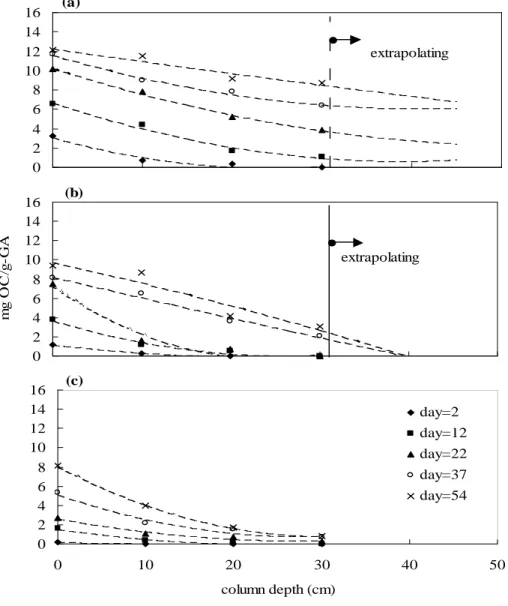
The same procedure of determining the adsorption capacities was executed to estimate the OC removal by adsorption within the BAC column, and the results are shown in Figure 4-1-6. The absorbed OC on the BAC column was less than that in sole adsorption case. Furthermore, the liquid-phase substrate concentration in BAC column could be lower than that in GAC column because of biological uptake; consequently, the equilibrium concentration in the solid-phase (qe) will be lower for
(a) 0 20 40 60 80
formaldehyde glyoxal glyoxalic acid ketomalonic acid
e ff lu e n t (μ g /L ) HL=12 HL=3 HL=1.2 (m/hr) (b) 60 70 80 90 100
formaldehyde glyoxal glyoxalic acid ketomalonic acid
re m o v a l e ff ic ie n c y ( % ) s (S0=200 μg/L) (S0=200 μg/L) (S0=400 μg/L) (S0=400 μg/L)
granular BAC in comparison with GAC. It has been reported that when using GAC as the media, the adsorbed substances, without being releasing to bulk liquid, can enhance the bacterial activity (Saito et al., 1996). In contrast, the adsorption capacity of the GAC regenerated by bacterial activity was low in comparison to that of new GAC, which implied that bacteria might not fully utilize the substances adsorbed on GAC (Nakano et al., 2000). Either way, biodegradation did reduce the organic loading of the granular.
Figure 4-1-6. Organic carbon absorbed by BAC granular at hydraulic loading, (a) 12, (b) 3, and (c) 1.2 m/hr. (a) 0 2 4 6 8 10 12 14 16 0 (b) 10 20 30 40 50 0 2 4 6 8 10 12 14 16 0 10 20 30 40 50 m g O C /g -G A C (c) 0 2 4 6 8 10 12 14 16 0 10 20 30 40 50 column depth (cm) day=2 day=12 day=22 day=37 day=54 extrapolating extrapolating
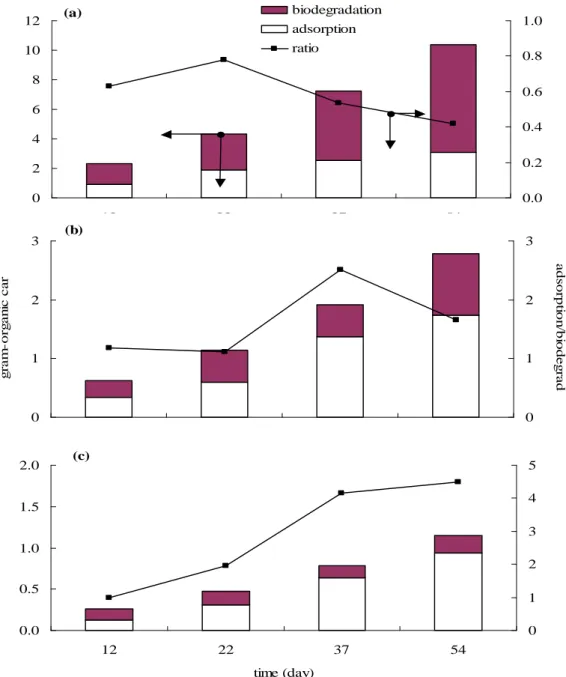
4-1-5 Effects of HL on adsorption/biodegradation of BAC
As the adsorption quantities have been determined, the amount of OC removal by biodegradation can be further determined. The adsorption and biodegradation and their ratio are shown in Figure 4-1-7. At high HL (Figure 4-1-7a), the amount of biodegradation exceeded than that of adsorption. The fraction of biodegradation increased with time, which revealed that biodegradation prevailed, although there remained a small amount of adsorption capacity.
On the contrary, adsorption was the predominant mechanism for removing organic carbon at HL 3 and 1.2 m/hr (Figure 4-1-7b and 4-1-7c). In addition, the adsorption/biodegradation ratio increased with time at 1.2 m/hr HL (Figure 4-1-7c). It seems that adsorption was the major way to remove organics, especially at low HL, and biodegradation was quite insignificant in comparison with adsorption. In general, the ratios of adsorption to biodegradation increase as HL decreases. Because the influent OC concentration was constant in this research, the result implies that adsorption will be dominant in a low an OC mass loading condition.
Finally, the cumulative amounts of biodegradation of BAC column derived from the empirical estimation based on the results of glass bead column and from the adsorption capacity approach are shown in Figure 4-1-8. It should be mentioned again that the effect of adsorption is absent in the empirical estimation. It is obvious that the results using empirical estimation are greater than those of adsorption capacity approach. This is because adsorption can remove the substrate from the bulk liquid, thereby reducing the substrate concentration for bacteria uptake. In addition, the differences increased with HL decreased, which indicated that at high HL condition, the biodegradation of BAC was similar to that of the glass bead column and also implied that adsorption played a much more important role in a low HL condition.
Figure 4-1-7. Organic carbon removal by adsorption and biodegradation of BAC column at hydraulic loading, (a) 12, (b) 3, and (c) 1.2 m/hr.
(a) 0 2 4 6 8 10 12 12 22 37 54 0.0 0.2 0.4 0.6 0.8 1.0 biodegradation adsorption ratio (b) 0 1 2 3 12 22 37 54 g ra m -o rg a n ic c a rb o n 0 1 2 3 a d s o rp tio n /b io d e g ra d a tio n (c) 0.0 0.5 1.0 1.5 2.0 12 22 37 54 time (day) 0 1 2 3 4 5
Figure 4-1-8. Comparison of cumulative biodegradation capacities determined by empirical estimation and adsorption capacity approach of BAC column. (a) 12, (b) 3, and (c) 1.2 m/hr. (a) 0 2 4 6 8 10 0 2 4 6 8 10 day=2 day=12 day=22 day=37 day=54 (b) 0.0 0.5 1.0 1.5 2.0 2.5 0.0 0.5 1.0 1.5 2.0 2.5 a d s o rp ti o n a p p ro a c h ( g m -O C ) (c) 0.0 0.2 0.4 0.6 0.8 1.0 0.0 0.2 0.4 0.6 0.8 1.0
4-2 Effect of Hydraulic Loading on the Biodegradation
Capacities of BAC Column for the Removal of OBPs
4-2-1 Per for mances of glass bead and BAC columns for removing OBPs
The formaldehyde concentration in effluent is shown in Figure 4-2-1. The effluent of BAC column was kept under a certain concentration without breakthrough (34 ìg/L, Figure 4-2-1b) due to biodegradation.
As mentioned in Section 4*1, the mechanism in glass bead column is considered as sole biodegradation, and the effluent of formaldehyde is shown in Figure 4-2-1(a). In this research, biodegradation was initiated from an unsteady to steady-state condition after approximately 15 days operation when the effluents were nearly identical. The values of Smin at various HLR are summarized in Table 4-2-1. There
is a trend that Smin decrease with HL decreasing, i.e., Smin changed from 46.4 to 26.7
ìg/L as the HL were from 12 to 1.2 m/hr for formaldehyde.
In addition, a simple first-order equation was used to simulate the biodegradation equilibrium kinetic of glass bead column:
(
S0 Smin)
e SminSe = − −kt+ [1]
where Se is the effluent substrate concentration (ìg/L), S0 is the influent substrate
concentration (ìg/L), k is the specific first-order reaction rate (day-1), and t is the time of operation (day). In this research S0 were constant, so that Se is the function of k,
Smin and time. The results of regression for the k values are shown in Table 4-2-1.
Like the trend of Smin, k decrease with HL decreasing, which implied that higher HL
could shorten the time required for reaching equilibrium. However, the differences are not very significant under HL less than 3 h/hr.
Table 4-2-1. Regression results if four OBPs removal rates of glass bead column under first-order kinetics.
Target compounds Hydraulic loading (m/hr) k (day-1) Smin (ìg/L) 12 0.41 47 6 0.36 39 3 0.28 34 2 0.25 31 Formaldehyde (CH2O) 1.2 0.25 27 12 0.32 47 6 0.29 43 3 0.22 35 2 0.19 39 Glyoxal (C2H2O2) 1.2 0.17 35 12 0.40 134 6 0.29 125 3 0.21 113 2 0.16 105 Glyoxalic acid (C2H2O3) 1.2 0.16 104 12 0.45 142 6 0.28 136 3 0.24 127 2 0.20 116 Ketomalonic acid (C3H4O6) 1.2 0.21 115
Figure 4-2-1. Effluent concentrations of (a) glass bead, (b) BAC columns for formaldehyde in various hydraulic loading rates.
Figure 4-2-2. Effluent concentrations of (a) glass bead, (b) BAC columns for glyoxal in various hydraulic loading rates.
(a) 0 50 100 150 200 0 10 20 30 40 50 60 12 6 3 2 1.2 (b) 0 10 20 30 40 50 0 10 20 30 40 50 60 time (day) e ff lu e n t (μ g /L ) HL, m/hr (a) 0 50 100 150 200 0 10 20 30 40 50 60 time (day) 12 6 3 2 1.2 (b) 0 10 20 30 40 50 0 10 20 30 40 50 60 time (day) e ff lu e n t (μ g /L) HL, m/hr
Figure 4-2-3. Effluent concentrations of (a) glass bead, (b) BAC columns for glyoxalic acid in various hydraulic loading rates.
Figure 4-2-4. Effluent concentrations of (a) glass bead, (b) BAC columns for ketomalonic acid in various hydraulic loading rates.
(a) 0 100 200 300 400 0 10 20 30 40 50 60 time (day) 12 6 3 2 1.2 (b) 0 20 40 60 80 100 0 10 20 30 40 50 60 time (day) e ff lu e n t (μ g /L ) HL, m/hr (a) 0 100 200 300 400 0 10 20 30 40 50 60 time (day) 12 6 3 2 1.2 (b) 0 20 40 60 80 100 0 10 20 30 40 50 60 time (day) e ff lu e n t (μ g /L ) HL, m/hr
As to the other OBPs, glyoxal was with a similar trend to that of formaldehyde, but the average Smin is greater (47.3 to 35.3 ìg/L) and the average k (0.32 to 0.17 day-1) is
less than that in the formaldehyde case, which revealed that biodegradation equilibrium of glyoxal is a little slower than that of formaldehyde. On the other hand, it is obviously that the equilibrium effluent concentrations of the two ketoacids were much higher (Figure 4-2-3 and 4-2-4). One of the reasons is the influent concentrations of the two ketoacids (400 ìg/L) were double to those in the aldehydes cases (200 ìg/L); as a result, Smin (133.8 to 103.6 and 142.2 to 115.1 ìg/L) were much
higher than those in the aldehydes cases.
The cumulative amounts of OC removal by GAC, glass bead and BAC columns are shown in Figure 4-2-5. As mentioned above, BAC column possessed the highest and constantly efficiency for removing the target compounds, whereas GAC column loosed its capacity after breakthrough (Figure 4-2-5a). In addition, the summary of OC removed by GAC and glass bead columns were greater than those removed by BAC, especially in low HL condition (Figure 4-2-5b and 4-2-5c). This phenomenon implied that adsorption and biodegradation influence each other in BAC, and cannot be described by simply a GAC or a biofilter column.
Figure 4-2-5. Cumulative organic carbon removal by GAC, glass bead and BAC columns at hydraulic loading, (a) 12, (b) 3, and (c) 1.2 m/hr.
(a) 0 4 8 12 0 5 10 15 20 25 30 35 40 45 influent GAC glass bead BAC glass bead+GAC (b) 0 1 2 3 4 0 5 10 15 20 25 30 35 40 45 o rg an ic c ar b o n re m o va l ( gm ) (c) 0.0 0.4 0.8 1.2 1.6 0 10 20 30 40 50 time (day)
4-2-2 Profiles of biomass density and BRP
The bacterial density profiles of the glass bead column under various HL are shown in Figure 4-2-6. In our previous research, a systematic approach will be introduced to quantify the capacities of adsorption and biodegradation of BAC. The basic assumption was that the amount of substrate biodegraded was proportional to bacterial activity, so that in the BAC column the amount of the organic carbon reduction by biodegradation can be quantified via the BRP approach (Figure 4-2-7).
The bacteria densities and BRP of the BAC column are shown in Figure 4-2-8 and 4-2-9. In general, the bacterial density at the top of the column was much larger than that in the middle. In addition, the difference between the bacteria density at the top and in the middle of the column increased as the HL decreased. Recently Liu and Tay (2002) indicated that hydrodynamic shear force has significant influence on the metabolic behavior of biofilms, especially increasing the magnitude of catabolic activity. However, in this research, biodegradation being dominant in high HL condition is probably due to the disequilibrium of adsorption. Meanwhile, in literature using natural water as the organic source, the amount of attached biomass decreased as filter depth increased, suggesting that most biodegradation occurred at the top in the filter, and biomass concentration was related to the concentration of the organic substrate (Wang et al., 1995).
Figure 4-2-6. The bacterial densities profiles of glass bead column on various loading rates, (a) 12, (b) 3, and (c) 1.2 m/hr.
Figure 4-2-7. The BRP profiles of the glass bead column on various loading rates, (a) 12, (b) 3, and (c) 1.2 m/hr. (a) -2 4 6 8 10 2 11 18 27 time (day) L=0 L=10 L=20 L=30 (b) -4 8 12 16 20 2 11 18 27 time (day) × 1 0 8 C F U /c m 3 m e d ia (c) -4 8 12 16 20 2 11 18 27 time (day) (a) 0 1 2 3 4 5 6 0 10 20 30 40 50 day=2 day=12 day=22 day=37 (b) 0 1 2 3 4 5 6 0 10 20 30 40 50 m g O2 /L -c m 3 m e d ia (c) 0 1 2 3 4 5 6 0 10 20 30 40 50 column depth (cm)
Figure 4-2-8. The bacterial densities profiles of BAC column on various loading rates, (a) 12, (b) 3, and (c) 1.2 m/hr.
Figure 4-2-9. The BRP profiles of the BAC column on various loading rates, (a) 12, (b) 3, and (c) 1.2 m/hr. (a ) -2 4 6 8 10 12 2 12 22 37 54 time (day) L=0 L=10 L=20 L=30 (b) -5 10 15 20 2 12 22 37 54 time (day) × 1 0 8 C F U /c m 3 m e d ia (c) -5 10 15 20 2 12 22 37 54 time (day) (a) 0 1 2 3 4 5 6 0 10 20 30 40 50 day=2 day=12 day=22 day=37 (b) 0 1 2 3 4 5 6 0 10 20 30 40 50 m g O2 /L -c m 3 m e d ia (c) 0 1 2 3 4 5 6 0 10 20 30 40 50 column depth (cm)
4-3 Modeling Adsorption and Biodegradation Capacities on
Biological Activated Carbon
4-3-1 System definition and basic assumptions
Figure 4-3-1. Conceptual basis of biological activated carbon coordinate system.
The physical concept of the biofilm on activated carbon is shown in Figure 4-3-1. The first major component is the activated carbon. The external surface of activated carbon acts as a supporting medium for the attached growth of bacteria. The activated carbon is highly porous, and its interior surface has high adsorption capacities for organic matters, in this research for the target compounds.
The second major component is the biofilm. A biofilm is a layer-like aggregation of microorganisms attached to a solid surface (Rittmann and McCarty, 1978). The
rs
Rs
rf
Lf
Bulk liquid Liquid-film
interface Biofilm
Activated carbon
Biofilm are idealized as being composed of a homogeneous matrix of bacteria and the extracellular polymers that bind the bacteria together and to the surface.
The third component is the operating system of the BAC. In this research a column system with interparticle axial-dispersion and advection is combined with the medium stated above to construct the whole one-dimensional partial differential equation system.
In order to write the mathematical expressions describing the adsorption and biodegradation mechanisms in an axial-dispersion column, some assumptions were made as:
1. The granules used in BAC are sphere.
2. Biodegradation reaction can be neglected in the pores of the granules, because the size of pores can not permit bacteria to penetrate.
3. The biofilm is homogeneous.
4. The bulk density of biofilm keeps constant.
5. Bacteria growing on granular surface can hardly utilize the substrate absorbed on the meso or micro pores of the granular.
6. Biofilm will be peeled due to the shear force of water, and the peeling rate is proportional to the thickness of biofilm.
7. Mass transfer phenomenon is dominated by Fick’s law.
8. Growth of biofilm can affect the flow in the column because the porosity of the column can be changed by the thickness of biofilm.
Overall, the conceptual diagram of the developed model is shown in Figure 4-3-2.
Figure 4-3-2. The conceptual diagram of the developed model. Determining Mechanisms (Intraparticle) *diffusion *biodegradation *adsorption Determining Mechanisms (Interparticle) *dispersion *advection Basic Assumptions
Governing equation (Intraparticle) * adsorption [3-1]
* biodegradation [3-7], [3-10]
Governing equation (Interparticle) * [3-12], [3-14] or [3-15]
Major Criteria:
Mass Conser vation
Boundary and Initial Conditions * B.C. [3-2]-[3-4], [3-8], [3-17]-[3-20] * I.C. [3-21]-[3-24]
Mathematical Systemization
4-3-2 Model development
4-3-2-1 Adsorption description
A homogenous solid diffusion model for activated carbon adsorption is used in this research. The dispersion of substrate in the pores is:
R r q r r r D t q s s s s s ≤ ≤ ∂ ∂ ∂ ∂ = ∂ ∂ s 2 2 0 r [3-1]
Where q is substrate concentration on solid phase, t is time, Ds is substrate diffusivity
on solid phase, rs is radius distance from the center of granular, and R is the radius of
granular.
The assumption of a homogeneous biofilm implies that the substrate concentration does not vary laterally on the carbon surface and that diffusion is in the radial direction in the biofilm only. Under the assumption of symmetry, the boundary conditions are:
1. There is no concentration gradient in the granular center
0 s 0, t t r 0 = ≥ = ∂ ∂ s r q [3-2]
2. The increase of substrate on solid phase is identical to the flux between biofilm and granular interface.
∫
= ≥ ∂ ∂ = ∂ ∂ = R s s p r f f f qr dr R t r S D R f 0 s 0 2 0 2 t t , r ρ [3-3]where Df is molecular diffusivity within biofilm, Sf is substrate concentration in the
biofilm, rf, is radius of biofilm from the granular surface, and ñp is apparent particle
3. The equilibrium relation of substrate between biofilm and granular can be described by Freundlich isotherm:
( )
w n q w K S q 1 = [3-4]( )
s r R w q r s q = = [3-5]( )
=0 = f f f r w S r S [3-6]Where qw and Sw are substrate concentration on granular and biofilm within the
interface, respectively; and Kq and n are Freundlich isotherm coefficient.
II. Diffusion and reaction within biofilm
The non-steady-state form of mass transfer and biodegradation reaction within biofilm, based on Fick’slaw and Monod equation, can be described as (Rittmann and McCarty, 1981): f f f s f f f f f L X S K kS r S D t S ≤ ≤ + − ∂ ∂ = ∂ ∂ f 2 2 r 0 [3-7]
Where k is maximum specific rate of substrate utilization, Ks is half-velocity
concentration, Xf is biofilm density, and Lf is biofilm thickness.
Equation [3-7] describes the condition of n0n-steady-state diffusion and reaction within the biofilm. Therefore, the substrate concentration varies only along rf. The
boundary condition at the interface between biofilm and granule is described as Equation [3-4] to [3-6]; the other one between biofilm and bulk liquid is based on that substrate flux from bulk liquid is identical to the substrate gradient within their
interface.
(
)
f f L r f f f s b f r S D S S k = ∂ ∂ = − [3-8]( )
f f L r f f s S r S = = [3-9]Where kf is liquid-film mass transfer coefficient, Sb is substrate concentration in the
bulk liquid, and Ss is substrate concentration in the interface.
III. Growth of biofilm
Substrate diffusing into biofilm will be utilized by bacteria for metabolism. In addition, interception bacteria from bulk liquid also can increase the amount of biofilm. On the other hand, the thickness of biofilm will be decreased by the shear of water, and the self decay of bacteria. As a result, biofilm thickness can be described as: f tot f susp f f f L b a X X X YJ t L − + = ∂ ∂ θ β [3-10]
(
b s)
f f k S S J = − [3-11]Where Y is true yield coefficient of biomass, Jf is the flux of substrate into biofilm,
Xsusp is biomass concentration for the suspended growth, â is the filtration efficiency, a
is the specific surface area of granular, è is the empty bed contact time, and btot is the
overall loss rate of bacteria due to both decay and fluid shear.
The deposition of bacteria on the filter media was derived from the filtration equation of Yao et al. (1971)
( )
(
)
− − = = c b i e d L N N αη ε β exp 23 1 [3-11]where Ne is the effluent particle concentration, Ni is the influent particle concentration,
å is the media porosity, ç is the collection efficiency, dc is the collector grain size.
The collision efficiency á is typically determined from experimental particle removal
data.
IV. Bacterial density in the bulk liquid
The factors affecting bacterial density in the bulk liquid include: mass transfer of dispersion and advection, growth and decay of bacteria, peeled bacteria from biofilm due to shear force, and the interception loss by the granular. As a result, the mass balance equation can be written as:
θε β ε σ ν susp susp f f s susp susp susp bact susp X bX L aX S K YkSX x X x X D t X − − + + + ∂ ∂ − ∂ ∂ ′ = ∂ ∂ 2 2 [3-12]
Where Dbact is the dispersion coefficient of bacteria in bulk liquid, x is axial distance
of column, í is the fluid velocity, ó is the biofilm shear loss coefficient, b is the
microbial decay coefficient, and å is the porosity of the column.
However, the dispersion term, and the affects of growth and decay are insignificant in a macro scope (Hozalski and Bouwer, 2001), so that equation [3-12] can be simplified as: θε β ε σ ν susp f f susp susp X L aX x X t X − + ∂ ∂ − = ∂ ∂ [3-13]
V. Governing equation in the column system
The mechanisms occurring on the BAC granular can be assorted to three categories, so the governing equations describing the concentration of substrate in bulk liquid are as below:
Case 1: adsorption only, without bio-reaction.
(
)
t q x S v x S D t S b s b f b ∂ ∂ − − ∂ ∂ − ∂ ∂ = ∂ ∂ ε ε 2 1 2 [3-14]Case 2: both adsorption and biodegradation.
(
)
(
)
(
b s)
f f b s b f b S S R L R k x S v x S D t S − + − − ∂ ∂ − ∂ ∂ = ∂ ∂ 3 2 2 2 3 1 ε ε [3-15]Case 3: without adsorption capacity such as anthracite sand.
The governing equation is same to equation [12]. It is noted that there is no substrate flux between the interface of biofilm and the granular, so the boundary condition should be revised as:
0 0 2 t t 0 ≥ = ∂ ∂ = f r f f f r S D R [3-16]
VI. Boundary and initial conditions for column system
The substrate concentration is identical to the influent at the column entrance:
0 0 0 = ≥ =S x , t Sb [3-17]
0 0 0 , = ≥ = X = x , t Xsusp suspx [3-18]
There is no concentration gradient for substrate at the outlet of the column:
c L x b x S = = ∂ ∂ 0 [3-19] c L x susp x X = = ∂ ∂ 0 [3-20]
The overall initial conditions are:
0 t , 0 = = q [3-21] 0 t , 0 = = L Lf [3-22] 0 t , 0 = = f S [3-23] 0 x 0 t , 0 = > = b S [3-24]
Chapter V CONCLUSIONS
The mechanisms occurring on BAC combine both adsorption and biodegradation. The effects of extending the contact time on biodegradation are a lower minimum effluent concentration and increased removal efficiencies; however, these effects are insignificant. On the other hand, lowering the HL can make the equilibrium more complete for adsorption, thereby improving the performance of BAC.
The result of mass balance, observed from the GAC column, indicates that the measured residual adsorption capacity can be used for estimation of organic removal by adsorption for GAC and for the BAC column. The absorbed organic carbon on BAC is less than that in sole adsorption case. Even at high loading rate the BAC column still maintained a certain amount of adsorption capacity, while the residual capacity of GAC was quite low. In general, the ratio of adsorption to biodegradation on the BAC column increases as HL decreases, and the result implies that adsorption will be dominant in a low organic mass loading condition.
In practice, BAC can prevent adsorption from sudden terminating and further reduce Smin by adsorption. However, increasing the HL of the BAC column will
simultaneously increase Smin for biodegradation and make adsorption not at
equilibrium. Avoiding too high HL, under which adsorption does not reach equilibrium (in this research it was 12 m/hr) is a possible way to optimize the design and operation of BAC.
REFERENCES
1. Abumaizar, R. J., E. H. Smith, and W. Kocher, “Analytical Model of Dual-Media Biofilter for Removal of Organic Air Pollutants”, Jour. of Environ. Engin, ASCE 123(6):606-613 (1997).
2. Aktas, E. S., Imre, S., and Ersoy, L. “Characterization and Lime Treatment of Olive Mill Wastewater”, Wat. Res. 35(9):2336-2340 (2001).
3. Ahmad, R., and A. Amirtharajah, “Detachment of Particles during Biofilter Backwashing”, Jour. of AWWA, 90(12):74-85 (1998).
4. Amy, G. L., Tan, L., and Davis, M. K., “The Effects of Ozonation and Activated Carbon Adsorption on Trihalomethane Speciation”, Wat. Res. 25(2):191-202
(1991).
5. APHA. Standard Method for the Examination of Water and Wastewater, 19th ed.,
Am. Pub. Health Assoc., Washington, DC (1995).
6. Benitez, F. J., Acero, J/L., Real, F. J., Rubio, F. J., and Leal, A. I. “The Role of Hydroxyl Radicals for the Decomposition of p-Hydroxy Phenylacetic Acid in Aqueous Solutions”, Wat. Res. 35(5):1338-1343 (2001).
7. Carlson, M. A., Heffernan, K. M., Ziesemer, C. C., and Snyder, E. G.., “Comparing two GAC for Adsorption and Biostabilization”, Jour. of AWWA, 86(3):91-102 (1994).
8. Carlson, K. H., and Amy, G. L., “BOM Removal During Biofiltration”, Jour. of AWWA, 90(12):42-52 (1998).
9. Carlson, G., and Silverstein, J, “Effect of Ozonation on Sorption of Natural Organic Matter by Biofilm”, Wat. Res., 31(10):2467-2478 (1997).
10. Chang. H. T., and Rittmann, B. E., “Mathematical Modeling of Biofilm on Activated Carbon”, Environ. Sci. Technol., 21(3):273-280 (1987).
11. Chang. H. T., and Rittmann, B. E., “Verification of the Model of Biofilm on Activated Carbon”, Environ. Sci. Technol., 21(3):280-288 (1987).
12. Cipparone, L. A., Diehl, A. C., and Speitel Jr., G. E., “Ozonation and BDOC Removal: Effect on Water Quality”, Jour. of AWWA, 89(2):84-97 (1997).
Organic Matter on the Biodegradation of a Micropollutant in a GAC Bed”, Jour. of AWWA, 82(8):69-75 (1990).
14. Ebie K., Li F., Azuma Y., Yuasa A., and Hagishita T., “Pore Distribution Effect of Activated Carbon in Adsorbing Organic Micropollutants from Natural Water”,
Wat. Res., 35(1):167-179 (2001).
15. Galapate R. P., Baes A. U., and Okada M., “Transformation of Dissolved Organic Matter during Ozonation: Effects on Trihalomethane Formation Potential”,Wat. Res., 35(9):2201-2206 (2001).
16. Glaze, W. H., and Wallace, J. L., “Control of Trihalomethane Precursors in Drinking Water: Granular Activated Carbon with and without Preozonation”,
Jour. of AWWA, 76(2):68-75 (1984).
17. Glaze, W. H., Koga, M., and Cancilla, D. “Ozonation Byproducts: 2 Improvement of an Aqueous-phase Derivatization Method for the Detection of Formaldehyde and Other Carbonyl Compounds Formed by the Ozonation of Drinking Water”, Environ. Sci. Technol., 23(7):838-847 (1989).
18. Goel, S., Hozalski, R. M., and Bouwer, E. J., “Biodegradation of NOM: Effect of NOM Source and Ozone Dose”, Jour. AWWA, 87(1):90~105 (1995).
19. Gracia, R., Aragues, J. L., and Ovelleiro, J. L., “Study of the Catalytic Ozonation of Humic Substances in Water and Their Ozonation Byproducts”, Ozone Sci. Engng. 18(3):195-208 (1996).
20. Griffini, O., Bao, M. L., Barbieri, K., Burrini, D., Santianni, D., and Pantani, F., “Formation and Removal of Biodegradable Ozonation by-Products during Ozonation-Biofiltration Treatment: Pilot-scale Evaluation”, Ozone Sci. Engng. 21(5):79-98 (1999).
21. Hozalski, R. M., Goel, S., and Bouwer, E. J., “TOC Removal in Biological Filters”, Jour. of AWWA, 87(12):40-54 (1995).
22. Hozalski, R. M., and Bouwer, E. J., “Non-Steady State Simulation of BOM Removal in Drinking Water Biofilters: Model Development”, Wat. Res., 35(1):198-210 (2001).
23. Hozalski, R. M., and Bouwer, E. J., “Non-Steady State Simulation of BOM Removal in Drinking Water Biofilters: Application and Full-Scale Validation”,
24. Jacangelo, J. G., Patania, N. L., Reagau, K. M., Aieta, E. M., Krasner, S. W., and McGuire, M. J., “Ozonation: Assessing Its Role in the Formation and Control of Disinfection By-products”, Jour. of AWWA, 81(8):74-84 (1989).
25. Kameya, T., Hada, T., and Urano, K., “Change of Adsorption Capacity and Pore Distribution of Biological Activated Carbon on Advanced water Treatment” Proceeding of Adsorption in Water Environment Treatment Processes, pp.153~160, Wakayama, Japan, 5-8 Nov., 1996.
26. Kirisits, M. J., Snoeyink, V. L., and Kruithof, J. C., “The Reduction of Bromate by Granular Activated Carbon”, Wat. Res., 34(17):4250-4260 (2000).
27. Kirisits, M. J., Snoeyink, V. L., Inan, H., Chee-Sanford, J. C., Raskin, L., and Brown, J. C., “Water Quality Factors Affecting Bromate Reduction in Biologically Activated Carbon”, Wat. Res., 35(4):891-900 (2001).
28. Laurent, P., Prevost, M., Cigana, J., Niquette, P., and Servais, P., “Biodegradable Organic Matter Removal in Biological Filters: Evaluation of the CHABROL Model”, Wat. Res., 33(6):1387-1398 (1999).
29. Le Bec, R., Sorrento, L. J., Labouyrie, L., and Merlet, N., “Development of Rapid Test for the Evaluation of Dynamic Adsorption and Biological Activity of Granular Activated Carbons”, Wat. Supply, 14(2):71-84 (1996).
30. LeChevallier, M. W., Becker, W. C., Schorr, P., and Lee, R. G., “Evaluating the Performance of Biological Active Rapid Filter”, Jour. of AWWA, 84(4):136-146
(1992).
31. Lehtola, M. J., Miettinen, I. T., Vartiainen, T., Myllykangas, T., and Martikainen, P. J., “Microbially Available Organic Carbon, Phosphorus, and Microbial Growth in Ozonated Water”,Wat. Res., 35(7):1635-1640 (2001).
32. Liu, Y. and Tay, J. H. (2002) The essential role of hydrodynamic shear force in the formation of biofilm and granular sludge. Water Res. 36 (7), 1653-1665.
33. McNevin, D., Barford, J., and Hage, J., “Adsorption and Biological Degradation of Ammonium and Sulfide on Peat”, Wat. Res., 33(6):1449-1459 (1999).
34. Melin, E. S., and H. Ø deggard, “The Effect of Biofilter Rate on the Removal of Organic Ozonation by-Product”, Wat. Res., 34(18) 4464-4476 (2000).
35. Miltner, R. J., Shukairy, H. M., and Summers, R. S., “Disinfection by-Product Formation and Control by Ozonation and Biotreatment”, Jour. of AWWA,
84(11):53-62 (1992).
36. Miltner, R. J., Summers, R. S., and Wang, J. Z., “Biofiltration Performance: Part 2, Effect of Backwashing”, Jour. of AWWA, 87(12):64-70 (1995).
37. Nakano, Y., Hua, L. Q., Nishijima, W., Shoto, E., and Okada, M., “Biodegradation of Trichloroethylene (TCE) Adsorbed on Granular Activated Carbon (GAC)”, Wat. Res., 34(17):4139-4142 (2000).
38. Namkung, E., and Rittmann, B. E., “Evaluation of Bisubstrate Secondary Utilization Kinetics by Biofilms”, Biotechnology and Bioengineering, 29(2):335-342 (1987).
39. Nguyen, H. D., Sato, C., Wu, J., and Douglass, R. W., “Modeling Biofiltration of Gas Streams Containing TEX Components”, Jour. of Environ. Engin., ASCE, 123(6):615-621 (1997).
40. Nishijima, W., Tojo, M., Okada, M., and Murakami, A., “Biodegradation of Organic Substances by Biological Activated Carbon – Simulation of Bacterial Activity on Granular Activated Carbon”, Wat. Sci. and Tech., 26(9-11):2031-2034 (1992).
41. Pelekani, C., and Snoeyink, V. L., “Competitive Adsorption in Natural Water: Role of Activated Carbon Pore Size”, Wat. Res., 33(5):1209-1219 (1999).
42. Pernitsky, D. J., Finch, G. R., and Huck, P. M., “Recovery from GAC Fines and Implications for Disinfection Efficacy”, Wat. Res., 31(3):385-390 (1997).
43. Ribas, F., Frias, J., Huguet, J. M., and Lucena, F., “Efficiency of Various Water Treatment Processes in the Removal of Biodegradable and Refractory Organic Matter”, Wat. Res., 31(3):639-649 (1997).
44. Rittmann, B. E., “Development and Experimental Evaluation of a Steady-State, Multispecies Biofilm Model”, Biotechnology and Bioengineering, 39(9):914-922
(1992).
45. Rittmann, B. E., and McCarty, P. L., “Model of Steady-State-Biofilm Kinetics”,
Biotechnology and Bioengineering, 22:2343-2357 (1980).
46. Rittmann, B. E., and McCarty, P. L., “Evaluation of Steady-State-Biofilm Kinetics”, Biotechnology and Bioengineering, 22:2359-2373 (1980).
Activated Carbon Process Examined by Using Stable Isotope”, Wat. Sci. and Tech., 34(5-6):429-435 (1996).
48. Sakoda, A., Wang, J., and Suzuki, M., “Microbial Activity in Biological Activated Carbon Bed by Pulse Responses”, Wat. Sci. and Tech., 34(5-6):213-222 (1996).
49. Schechter, D. S., and Singer, P. C., “Formation of Aldehydes During Ozonation.”
Ozone Sci. & Engrg., 17(1):53-69 (1995).
50. Scholz, M., and Martin, R. J., “Ecological Equilibrium on Biological Activated Carbon”, Wat. Res., 31(12):2959-2968 (1997).
51. Scholz, M., and Martin, R. J., “Control of Bio-regenerated Granular Activated Carbon by Spreadsheet Modeling”, Jour. of Chemical Tech. and Biotechnology, 71:253-261 (1998).
52. Schreiber, H., Schoenen, D., and Traunspurger, W., “Invertebrate Colonization of Granular Activated Carbon Filter”, Wat. Res., 31(4):743-748 (1997).
53. Servais, P., Billen, G., Ventresque, C., and Bablon, G. P., “Microbial Activity in GAC Filters in the Choisy-le-Roi Treatment Plant”, Jour. of AWWA, 83(2):62-68
(1991).
54. Servais, P., Cauchi, B., and Billen, G., “Experimental Study and Modeling Bacterial Activity in Biological Activated Carbon Filters”, Wat. Supply, 14(2):223-231 (1996).
55. Shukairy, H. M., and Summers, R. S., “The Impact of Preozonation and Biodegradation on Disinfection by-Product Formation”, Wat. Res., 26(9):1217-1227 (1992).
56. Singer, P. C., “Assessing Ozonation Research Needs in Water Treatment”, Jour. of AWWA, 82(10):78-88 (1990).
57. Speitel Jr., G. E., Turakhia, M. H., and Lu, C. J., “Initiation of Micropollutant Biodegradation in Virgin GAC Columns”, Jour. of AWWA, 81(4):168-176 (1989).
58. Speitel Jr., G. E., Symons, J. M., Diehl, A. C., Sorensen, H. W., and Cipparone, L. A., “Effect of Ozone Dosage and Subsequent Biodegradation on removal of DBP Precursors”, Jour. of AWWA, 85(5):86-95 (1993).
Biodegradation Charactreistics of Musty Odorous Compounds, 2-Methylisoborneol and Geosmin”, Proceeding of Adsorption in Water Environment Treatment Processes, pp.185~190,Wakayama, Japan, 5-8 Nov., 1996.
60. Takeuchi, Y., Mochidzuki, K., and Matsunobu, N., “Removal of Organic Substances from Water by ozone Treatment Followed by Biological Activated Carbon Treatment”, Proceeding of Adsorption in Water Environment Treatment Processes, pp.169~176, Wakayama, Japan, 5-8 Nov., 1996.
61. Urfer, D., Huck, P. M., Booth, S. D. J., and Coffey, B. M., “Biological Filtration for BOM and Particle Removal: A Critical Review”, Jour. of AWWA, 89(12):83-98 (1997).
62. Urfer, D. and Huck, P. M., “Measurement of Biomass Activity in Drinking Water Biofilters Using a Respirometric Method”, Wat. Res., 35(6):1469-1477 (2001).
63. Van der Kooij, D., Hijnen, W. A. M., and Visser A. J., “Determining the Concentration of Easily Assimilable Organic Carbon in Drinking Water”,Jour. of AWWA, 74():540-545 (1982).
64. Viraraghavan, T., and Kapoor, A., “Fungal Biosorption of Heavy Metals-Comparative Removal of Cadmium and Lead by Aspergillus Niger,
Activated Carbon and Ion Exchange Resin”, Proceeding of Adsorption in Water Environment Treatment Processes, pp.83~90, Wakayama, Japan, 5-8 Nov., 1996. 65. Wang, J. Z., Summers, R. S., and Miltner, R. J., “Biofiltration Performance: Part
1, Relationship to Biomass”, Jour. of AWWA, 87(12):55-63 (1995).
66. Weinberg H. S., and Glaze, W. H., “A Unified Approach to the Analysis of Polar Organic by-Products of Oxidation in Aqueous Matrices”, Wat. Res., 31(7):1555-1572 (1997).
67. Zhang, S., and Huck, P. M., “Removal of AOC in Biological Water Treatment Processes: A Kinetic Modeling Approach”, Wat. Res., 30(5):1195-1207 (1996).