doi:10.1016/S0301-5629(03)00992-X
●
Original Contribution
SEGMENTATION OF BREAST TUMOR IN THREE-DIMENSIONAL
ULTRASOUND IMAGES USING THREE-DIMENSIONAL DISCRETE
ACTIVE CONTOUR MODEL
R
UEY-F
ENGC
HANG,* W
EN-J
IEW
U,* W
OOK
YUNGM
OON,
†W
EI-M
INGC
HEN,* W
EIL
EE*
and D
AR-R
ENC
HEN‡*
*Department of Computer Science and Information Engineering, National Chung Cheng University, Chiayi, Taiwan;
†
Department of Diagnostic Radiology, Seoul National University Hospital, Seoul, South Korea; and‡
Department of General Surgery, China Medical College & Hospital, Taichung, Taiwan
(Received 5 September 2002; revised 23 January 2003; in final form 13 May 2003)
Abstract—In this paper, we apply the three-dimensional (3-D) active contour model to a 3-D ultrasonic data file for segmenting of the breast tumor. The 3-D ultrasonic file is composed of a series of two-dimensional (2-D) images. Most of traditional techniques of 2-D image segmentation will not use the information between adjacent images. To suit the property of the 3-D data, we introduce the concept of the 3-D stick, the 3-D morphologic process and the 3-D active contour model. The 3-D stick can get over the problem that the ultrasonic image is full of speckle noise and highlight the edge information in images. The 3-D morphologic process helps to determine the contour of the tumor and the resulting contour can be regarded as the initial contour of the active contour model. Finally, the 3-D active contour model will make the initial contour approach to the real contour of the tumor. However, there is emphasis on these 3-D techniques that they do not consist of a series of 2-D techniques. When they work, they will consider the horizontal, vertical and depth directions at the same time. The use of these 3-D techniques not only segments the 3-D shape but also obtains the volume of the tumor. The volume of the tumor calculated by the proposed method will be compared with the volume calculated by the VOCALTM software with the physician’s manually drawn shape and it shows that the performance of our method is satisfactory. (E-mail: [email protected]) © 2003 World Federation for Ultrasound in Medicine & Biology.
Key Words: Three-dimensional ultrasound image, Three-dimensional active contour model, Three-dimensional
stick, segmentation.
INTRODUCTION
Advances in the ultrasound (US) technique have resulted in much better quality of images. The cost-effectiveness and short acquisition time of ultrasound imaging, as compared with computed tomography (CT) and mag-netic resonance imaging (MRI), makes it attractive. However, these modalities have advantages over ultra-sound in terms of better anatomic special resolution of the images and computer-based postprocessing of the data. To improve the capabilities of ultrasound imaging as a diagnostic tool, it is necessary to develop advanced software for postprocessing of the data so that the result-ing output has little subjective variation.
Clinically, ultrasound is widely used for tumor de-tection. In most cases, the recognition of the tumor boundary in a two-dimensional (2-D) ultrasonic image through human eyes is easy. However, the computer-based automatic tumor region identification is a rather difficult problem due to the noise inherently in ultrasonic images. Although the artificial recognition method is good, manual handling several hundreds of images in a 3-D data set is a time-consuming process. It is impossible for a physician manually to draw the boundary of each image in the three-dimensional (3-D) data set. Hence, we need to develop a good computer-based segmentation method. The development of 3-D segmentation method is indeed important and necessary for medical applica-tions. For example, a precise 3-D segmentation approach can provide an accurate evaluation of the tumor volume. Ultrasonic image segmentation is to identify the boundary of a tissue in an image. Most of the research in
Address correspondence to: Dar-Ren Chen, Department of Gen-eral Surgery, China Medical College & Hospital, 2 Yer-Der Rd, Taichung, Taiwan. E-mail: [email protected]
Printed in the USA. All rights reserved 0301-5629/03/$–see front matter
image segmentation is focused on segmenting 2-D im-ages. For segmenting a 3-D data set, the general method is to apply a 2-D segmentation method to each 2-D image in the 3-D data set to get a set of 2-D contours. Then they are stacked together to form a 3-D represen-tation of the boundary of a tumor. Surface fitting (Besl and Jain 1988; Loupas et al. 1989) and interpolation (Haseyama et al. 1999; Lee et al. 2000) are often used to estimate the boundaries of the homogeneous regions. Rather than segmenting each 2-D image at a time, the entire volume of data are segmented simultaneously with 3-D data segmentation approaches. The resulting seg-mented data from this type of method have fewer errors because surface interpolation in the third dimension is joined together with the segmentation process, instead of being performed after segmentation.
The technique of 3-D ultrasonic data segmentation helps us to visualize the solid tumor shape and to calcu-late the volume of the tumor. Because the 3-D ultrasonic data usually contain hundreds of images, the manual delineation method for each image is time-consuming and unrealizable. Developing a computer-based auto-matic segmentation technique is indeed helpful for clin-ical applications.
Many 3-D segmentation methods have been pro-posed in last decade. Carr et al. (1998) propro-posed an improved volume intersection technique to reconstruct 3-D shape. Their method solves the problem of recon-structing concave surface. Xiao et al. (2002) developed a method for simultaneous estimation of video-intensity inhomogeities and segmentation of US image. Angelini et al. (2001) presented a spatiotemporal analysis method for feature extraction using a third-generation real-time 3-D ultrasound system. They combined 4D directional denoising and deformable model-based segmentation to extract LV endocardial borders. ter Haar Romeny et al. (1999) presented a method on human follicle volume measurement from 3-D ultrasound. They utilized a mul-tiscale analysis automatically to detect and quantify the number and shape of the patient’s follicles.
The ultrasound imaging has some characteristics including noise, speckle and tissue-related textures. For these reasons, the conventional edge-based image seg-mentation methods such as Canny edge detection (Canny 1986), Sobel operators (Gonzalez and Woods 1992b), and Bovik edge detector (Bovik 1988; Wong et al. 2001) are not suited to find tumor boundaries because they are not designed for detecting the discontinuity of image intensity. The region-based segmentation approaches, such as region growing (Pavlidis 1982) and split-and-merge (Pavlidis and Horowiz 1974), are sensitive to the noise and contrast of an image. These methods cannot work well on ultrasonic images. Stick is a boundary detection approach based on an image enhancement
technique (Richard and Czerwinski 1999). Large-scale linear features line up with sticks of adequately short length, while speckle does not if the sticks are long enough. We adopted stick operation to obtain the better boundary information in the initial contour-finding pro-cess. Moreover, a new 3-D stick method based on the concept of the original 2-D stick operation is developed to find the initial 3-D shape.
The active contour models, more widely known as snakes, proposed by Kass et al. (1988a), have been massively used as an edge-based segmentation method and can partially overcome the problems mentioned be-fore. The snake guarantees the closed contour is detected and is a controlled continuity spline under the image forces and external constraint forces. Starting from a closed initial contour, which is located near the boundary of the object, the snake model modifies its shape actively and then approximates the desired contour. During the deformation process, the force is calculated from internal forces and external forces. The internal forces, which are derived from the shape of the contour model itself, try to minimize local contour curvature. The external forces, which are derived from some image feature energy dis-tribution, try to make the model follow a ravine or a hill formed by the image feature. The snake model has been extensively used in medical imaging (Cohen and Cohen 1993; Leymarie and Levine 1993; Jain et al. 1996). The early vision model (Chen et al. 2000a) is an improvement of the original snake model and it relaxes the constraint that the initial contour must be located close to the actual boundary. In this paper, we propose a new 3-D active contour model based on the traditional 2-D snake to find the 3-D shape in a 3-D US data set.
MATERIALS AND METHODS
Reviews of 3-D Breast US, Stick and Snake
In this section, we first introduce the three-dimen-sional breast ultrasound, the equipment that generates the 3-D volume data, and the software that acquires the 3-D ultrasonic data. Then, we make a description of the conventional 2-D stick approach and the 2-D active contour model. The sticks are some short line segments with different orientations. The stick method is often used for edge detection in an image, due to the edge enhancement effect. The active contour model is widely used for contour segmentation in ultrasonic image and usually incorporates with some preprocessing methods to give good segmentation results.
3-D breast US
In this work, the 3-D sonography was performed using a Voluson 530D (Kretz Technik, Austria) scan-ner and a Voluson small part transducer S-VNW5 to
10. The transducer, which is a linear-array transducer with a frequency 5 to 10 MHz, a scan width of 40 mm (switchable in 3 mm steps) and the sweep angle of 20° to 30°, allows the performance of a 3-D volume scan, as shown in Fig. 1. The volume scan is automatically performed by a slow tilt movement of a sectorial mechanical transducer. The process of acquiring the 2-D ultrasonic images at regular angular intervals re-sults in a set of 2-D image planes arranged in a fanlike geometry, as shown in Fig. 2. The volume data were obtained through the reconstruction of these 2-D im-ages and were saved into a computer file in a magne-tooptical (MO) disk. The MO file could be read and analyzed in a personal computer. For example, the 3-D ultrasonic file could be read by the Kretztechnik pro-gram 3-D View 2000, which can be downloaded from the www.kretztechnik.com. We developed a program to obtain the 3-D ultrasonic data directly from the 3-D volume file. Before using our developed program, the
3-D volume file should be saved in Cartesian coordinates by the Voluson 530D or 3-D View 2000 program. In the 3-D volume file in Cartesian coordinates, the volume data set is a set of consecutive 2-D image planes. Three orthogonal planes, longitudinal, transverse and coronal planes of a volume data set could be obtained by using our developed program.
2-D stick
It has been shown that the ultrasonic image edge detection problem can be modeled as a line process instead of a step process (Czerwinski et al. 1998; Richard and Czerwinski 1999). Using line segments (also called sticks) in different angular orientations as a template and selecting the most suitable orientation at each point, it is possible to reduce speckle and improve edge information in ultrasonic images.
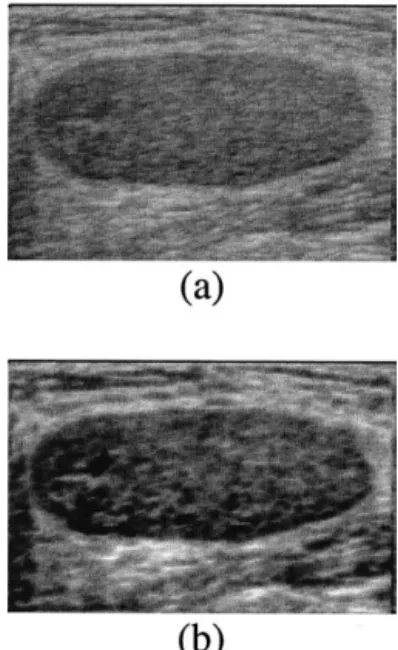
Considering a square N⫻N area in an image, there are 2N⫺ 2 short lines that pass through the central pixel, with each line including exactly N pixels. For each of these 2N⫺ 2 lines, the sum of pixel values along the line is calculated. The segment with the maximum sum is selected and the stick-image value at the center pixel is the maximum of the 2N⫺ 2 line sums. This process is repeated for all the pixels in the image. In the resulting image, the contrast at the edges is enhanced and the speckle is reduced. The result of an image after a stick filter is shown in Fig. 3.
2-D snake
The active contour model, also called snake for the nature of its evolution, is an established method for the
Fig. 1. Three-dimensional volume transducer.
Fig. 2. A set of 2-D image planes arranged in a fanlike geometry.
Fig. 3. The result of the stick filter. (a) The original image. (b) The stick image of (a).
contour extraction and image interpretation. The deter-mination of an object contour depends not only on the local image force at a particular point, but also on the properties of a contour’s shape. In a discrete dynamic contour model, introduced by Kass et al. (1988), the contour is represented as a set of vertices that move in response to internal forces and external forces. The in-ternal forces are derived from the properties of the shape of the contour. The external forces are derived from the image features. The internal forces minimize the local contour curvature, while the external forces make the model follow a path of low energy through the external energy distribution. The deformation process executes in discrete steps until a local minimum of the energy func-tion is reached.
During the deformation process, the forces acting on a vertex xiare internal, external and damping forces; the total force fi is a weighted combination of these
forces
fi⫽ wintfint,i⫹ wextfext,i⫹ wdampvi (1) where wint, wextand wdampare the weighting factors of internal force, external force and damping force, fint,i and fext,iare the internal force and external force acting on vertex xi, and vi is the velocity of vertex xi. The damping force is to prevent the model from oscillating between two states, which both represent an energy minimum.
We adopt this model as the basis of our 3-D snake model for several reasons. It was successfully applied to different kinds of medical images, including ultrasonic images and CT images. The approach of the deformation process is straightforward and can be traced out step-by-step. The parameters that need to be set are less than those required by other methods and it is easy to exhibit their effect on the process.
The proposed 3-D segmentation method
Presently, diagnostic analysis of ultrasonic images is carried out on 2-D cross-sections of the object-of-interest and it performs on separate 2-D images without consideration for the relationship between the images (Garra et al. 1993; Chen et al. 2000b). No information about the third dimension information is used and there is no way of observing the outward surface of the object. One way for a physician to visualize the complete object is by reconstructing the object based on a series of 2-D images. However, the subjectivity of a doctor may affect the interpretation and perplex the identification of the tumor. Hence, the use of 3-D segmentation techniques, based on the 2-D methods, can be used to get over these problems. The flow chart of the proposed method is shown in Fig. 4.
3-D Stick
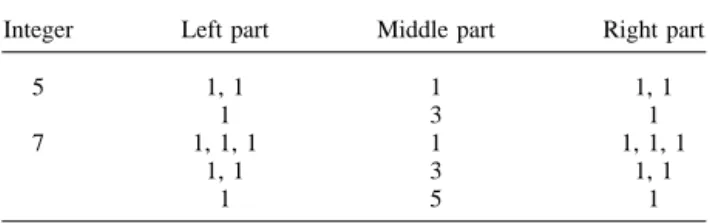
Sticks are usually with the form of 2-D. In this paper, the extension of the stick from 2-D to 3-D is for dealing with the 3-D ultrasonic data. Two kinds of stick length, five and seven, are used in the proposed 3-D stick for enhancing the edge information in the images. The categories of the stick are calculated based on the sym-metry. For example, the integers 5 and 7 can be ex-pressed by the sum of several integers which have the symmetric property, as shown in Table 1.
According to the Table 1, the stick with length five has two different categories of the stick, and the stick with length seven has three different categories of the stick. These categories are defined based on how many stick elements are included in a frame. For example, the first category of stick with length five in each frame includes one stick element. The second category of stick with length five is in the middle frame where the central stick element includes three stick elements and the pre-vious frame and the next one includes one stick element,
Fig. 4. The flow chart of the proposed method.
Table 1. The symmetric decomposition of an integer
Integer Left part Middle part Right part
5 1, 1 1 1, 1
1 3 1
7 1, 1, 1 1 1, 1, 1
1, 1 3 1, 1
1 5 1
In the right three columns, the number denotes how many stick elements are included in each frame.
respectively. By the way, we exclude the case that one frame includes all stick elements, because no information of neighbor frames is referenced. The categories of stick with length seven are defined in the same way. In Table 2, we show a number of forms of the stick in each category.
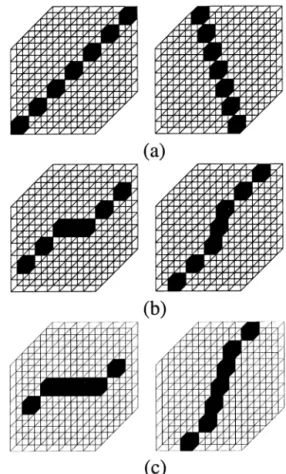
The set of a stick with length five has 19 forms. Fig. 5 represents two sample forms in each category of the stick with length five. The set of a stick with length seven has 31 forms. Fig. 6 represents two sample forms in each category of the stick with length seven.
Automatic thresholding
In the proposed method, the 3-D volume data file for a breast tumor is extracted to a series of images first and the histogram equalization (Gonzalez and Woods 1992a) is applied to each image for contrast enhancement. Then a new 3-D stick method is pro-posed to process all of the images at a time, to obtain the better shape information. Generally, the region of the tumor in the ultrasonic image is the darker part and the background is the brighter part. Thus, the simplest
way for separating the tumor region from the back-ground of the image is to use a threshold method to get the binary image, where the region of tumor is the black area and the background is the white area. The automatic threshold-determination method proposed by Ramesh et al. (1995) is adopted to achieve the goal. It is based on minimizing the sum-of-square errors SSE(t) between the gray values and the mean values in the two regions to find the threshold value.
SSE共t兲 ⫽
冘
i⫽0 t 共i ⫺ x1共t兲兲 2⫹冘
i⫽t⫹1 255 共i ⫺ x2共t兲兲 2 (2) where x1共t兲 ⫽冘
t⫽0 t ihi冘
i⫽0 t hi , x2共t兲 ⫽冘
i⫽t⫹1 255 ihi冘
i⫽t⫹1 255 hi ,and hi is the number of pixels with gray level i. Table 2. The content of the proposed 3-D stick
Length of
the stick Category of the stick
Number of forms of the stick 5 a (1-1-1-1-1) 7 b (1-3-1) 12 7 a (1-1-1-1-1-1-1) 7 b (1-1-3-1-1) 12 c (1-5-1) 12
In the center column, the number denotes how many stick elements are included in each frame.
Fig. 5. Two sample forms in (a) category a, and (b) category b of the stick with length five.
Fig. 6. Two sample forms in (a) category a, (b) category b and (c) category c of the stick with length seven.
3-D morphology
After obtaining the thresholded images, some small holes, i.e., white areas, may appear inside the tumor region. Moreover, there may be small islands, i.e., black areas, outside the tumor region of the thresholded image. The morphologic techniques, such as closing and open-ing, are often used for pre- or postprocessing of an image. Closing generally smoothes the contour of an image, fuses narrow breaks and long thin gulfs, and eliminates small holes. Opening also smoothes sections of contours but, on the contrary, it breaks narrow isth-muses and eliminates thin small islands and sharp peaks. Therefore, we extend the morphologic operations from 2-D to 3-D to remove these unwanted small regions in the binary images. Also, the morphologic techniques can be used to extract the boundary of the tumor in each image. In this paper, we use a 5⫻ 5 ⫻ 5 cube in the 3-D morphologic filtering and use a 5 ⫻ 5 square for mor-phologic edge detection.
After this step, these boundaries can be treated as the initial contours for the following 3-D snake process. The 3-D snake procedure will change the initial 3-D shape to the more accurate tumor shape. After obtaining the shape of the tumor, the tumor volume and surface area are easily obtained from the shape information. 3-D snake
The traditional snake model is often used in pro-cessing 2-D images. The proposed 3-D snake model modifies the internal forces and the external forces to the form of 3-D. Besides the curvatures of the horizontal and vertical directions, the internal forces also calculate the curvature of the depth direction. Meanwhile, we used a 27 neighborhood to calculate the external force. The relationship of the 27 pixels including the horizontal, vertical and depth directions will be consider at the same time.
The internal forces defined in the proposed model are related with the local contour curvature. The local curvature at the location of a vertex is the difference between the orientations of the two edge segments that connect at the location. The vector oi represents the edge segment leaving from vertex Xi. The unit vector oˆi de-scribes the orientation of the edge segment. The local curvature ciat Xiis defined by
ci⫽ oˆi⫺ oˆi⫺1. (3) The locally tangential unit vector tˆi at a vertex Xi is defined as the normalized sum of the unit vectors of two connecting edge segments
tˆi⫽
oˆi⫹ oˆi⫺1
储oˆi⫹ oˆi⫺1储. (4)
The unit vector rˆiin the local radial orientation is derived from ˆtiby a rotation over/2 radians
rˆi⫽
冋
0 1
⫺ 1 0
册
tˆi (5)The vectors ˆtiand rˆidescribe a local coordinate system at the position of vertex Xi. If the local curvature vector ci is represented in terms of the local t,r-coordinate system, ci is pointing the orientation of rˆi or in the contrary orientation. Thus, ciis a vector along the local r-axis and its length is the dot product (ci· rˆi). The length ciof the curvature vector can be positive as well as negative
ci⫽ 共ci· rˆi兲 rˆi. (6) According to above description, the internal force fint,i can be defined by Eqns. (7)–(9).
fint,i⫽ fint,irˆi (7) fint,i⫽ 共ci· rˆi兲 䊟 pi (8) pi⫽
再
. . . ,0,0,0,⫺ 1 2,1,⫺ 1 2,0,0,0, . . .冎
(9) where fint,i, the strength of the internal force, is the convolution of ci · rˆi and a discrete second difference operator pi. pi is a symmetric discrete operator with a zero frequency component equal to zero, and it consists of three nonzero coefficients where the value 1 applies to position i and the values to positions i⫺ 1 and i ⫹ 1.In the conventional snake model, the external force is usually calculated from the gradient of the original image. This will involve some incorrect information due to the speckle and the tissue-related textures and the result is unacceptable. For this reason, the external force is calculated from the texture information, instead of gradient, of the US image in our method. Furthermore, the Gaussian blurring is applied for better results. How-ever, the blurred texture feature will lose some tumor boundary information. Hence, the original image feature is also used to retain the boundary information.
Let T(x,y,z) denote the texture image after applying the texture analysis to the original image I(x,y,z). The texture analysis of a point P(x,y,z) is to calculate the average variance of the voxel, centered at point P(x,y,z), with the size of 3⫻ 3 ⫻ 3 pixels. The Gaussian blurring operator is applied to the texture image T(x,y,z), then the blurred texture image TGB(x,y,z) is obtained. The external energy distribution E is defined as the sum of ⫺I⬘ and
normal-izing⫺I and ⫺TGBinto [0,1]. The external force fextcan be calculated from E; that is,
E⫽ ⫺I⬘ ⫺ TGB⬘ (10)
fext⫽ ⫺ƒE. (11)
Let t denote the step at a particular time t. The deforma-tion process at each step with the incremental time⌬t can be expressed as follows: ai共t ⫹ ⌬t兲 ⫽ 1 mi fi共t ⫹ ⌬t兲 (12) vi共t ⫹ ⌬t兲 ⫽ vi共t兲 ⫹ ai共t兲 ⌬t (13) si共t ⫹ ⌬t兲 ⫽ si共t兲 ⫹ vi共t兲 ⌬t (14) where ai, vi and si denote the acceleration, velocity and position vectors of vertex xi, respectively, miis the mass of vertex xiand fi is the total force acting on vertex xi, which is defined in Eqn. (1). Generally, all the values of mi are assumed to be equal, and 1/mi regarded as a constant scaling factor.
During the deformation process, the distance be-tween two vertices will change constantly. This results in local variation and in global changes in the resolution of
the model. Both of these are undesirable, but small local variation in the resolution is inevitable because a defor-mation process can only be possible if the vertices have the liberty to move with reference to their neighbors. For this reason, periodically resampling the model along its path will keep this variation between some limits. The resampling step contains two criteria of the segment length between two vertices in the shape. If the segment length in the shape is larger than an upper bound, this segment is divided into two shorter ones of equal length and a new vertex is inserted in the middle of them. If the segment length in the shape is shorter than a lower bound, this segment is removed, replacing two vertices on the ends of this segment by one vertex in the middle
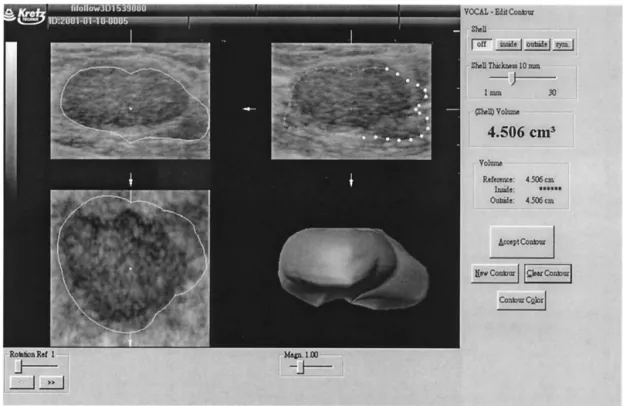
Fig. 7. Automatic segmentation of the tumor by VOCALTM
software.
Table 3. The 3-D ultrasonic files of the eight tumors used in our experiment
Tumor
Data size in pixel (column⫻ row ⫻ page) Data size (cm) (width⫻ length ⫻ depth) Benign/ Malignant 1 256⫻ 184 ⫻ 56 3.56⫻ 2.56 ⫻ 3.54 B 2 176⫻ 104 ⫻ 90 2.44⫻ 1.44 ⫻ 2.63 B 3 210⫻ 162 ⫻ 224 2.92⫻ 2.25 ⫻ 3.10 B 4 256⫻ 166 ⫻ 232 3.56⫻ 2.31 ⫻ 3.21 B 5 256⫻ 202 ⫻ 236 3.56⫻ 2.81 ⫻ 3.26 M 6 214⫻ 162 ⫻ 212 2.97⫻ 2.25 ⫻ 2.94 M 7 162⫻ 128 ⫻ 192 2.25⫻ 1.78 ⫻ 2.67 M 8 224⫻ 174 ⫻ 248 3.10⫻ 2.42 ⫻ 3.44 M
of the two replaced vertices. In our experiments, we set the lower bound and upper bound to 2 and 6, respec-tively.
Calculation of surface area and volume of tumor After the 3-D snake procedure, a final shape of the tumor can be obtained and the region-growing method can be used to fill up the region encircled by the final shape. By the resolution information of the 3-D ultra-sonic file, the number of voxels in the filled regions can
be used to calculate the volume of the tumor. Besides, the final 3-D shape can be decomposed to a series of 2-D contours in each image slice and the surface area of the tumor can be computed from the contour information.
RESULTS
The proposed method is implemented by using the C⫹⫹language under the Borland C⫹⫹Builder environ-ment. The program is running on an Intel PIII-866 ma-chine. The VOCALTM software contained in the 3-D VIEWTMis a tool for calculating the volume data as well as the geometric surface information in a well-defined border lesion. The segmentation and volume calculation of the tumor in this software can be done automatically or manually. In Fig. 7, the automatic segmentation by VOCALTM software is not good and its volume mea-surement is not accurate enough. The comparison of the volume between the proposed method and the VO-CALTMsoftware with the physician’s manual adjustment is demonstrated.
Eight 3-D ultrasonic files of the tumors in Table 3 are used in the experiment. One of the resulting images of each step in the proposed method is shown in Figs. 8 to 15. We also show the 3-D results of some tumors in Fig. 16, representing that our method is accurate. The volume of the tumor calculated by the VOCALTM
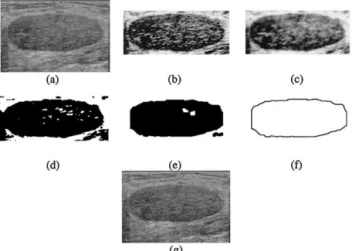
soft-Fig. 8. The resulting images of tumor 1. (a) The original image. (b) The equalized image of (a). (c) The stick image of (b). (d) The image after morphologic process of (c). (e) The image after automatic threshold of (d). (f) The contour of the tumor derived
from (e). (g) The result of the snake.
Fig. 9. The resulting images of tumor 2. (a) The original image. (b) The equalized image of (a). (c) The stick image of (b). (d) The image after morphologic process of (c). (e) The image after automatic threshold of (d). (f) The contour of the tumor derived
from (e). (g) The result of the snake.
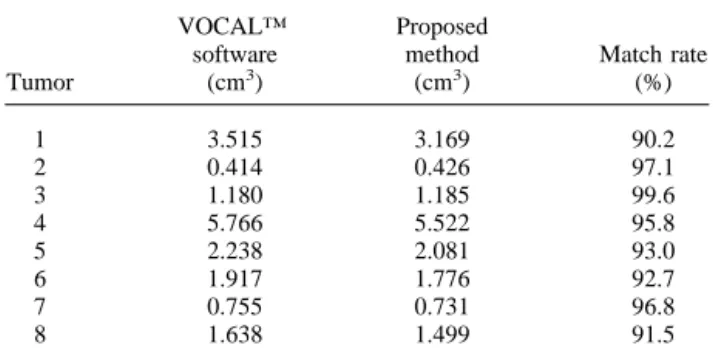
Table 4. The comparison of the tumor volume calculation between the VOCAL™ software and the proposed method
Tumor VOCAL™ software (cm3) Proposed method (cm3) Match rate (%) 1 3.515 3.169 90.2 2 0.414 0.426 97.1 3 1.180 1.185 99.6 4 5.766 5.522 95.8 5 2.238 2.081 93.0 6 1.917 1.776 92.7 7 0.755 0.731 96.8 8 1.638 1.499 91.5
Table 5. The execution time (in seconds) of each step in the proposed method in the experiment
Tumor Equalization 3-D
stick Automatic 3-D Boundary 3-D snake Total 1 17 13 2 101 117 297 547 2 1 1 1 2 1 21 27 3 1 3 1 14 4 70 93 4 16 11 2 114 98 233 474 5 7 6 1 49 6 175 244 6 10 4 1 31 4 109 159 7 4 1 1 8 1 28 43 8 11 3 1 28 4 98 145
ware and the proposed method are shown in Table 4. The match rate MR is defined by
MR⫽
冉
1⫺兩Vol1⫺ Vol2兩Vol1
冊
⫻ 100%where Vol1is the volume of the tumor calculated by the
VOCALTMsoftware and Vol2is the volume of the tumor
calculated by the proposed method. The average match rate is about 95% and this shows that the result of the proposed method is very close to that of the VOCALTM software with the physician’s manual operation. Table 5 lists the execution time of each step in the proposed method.
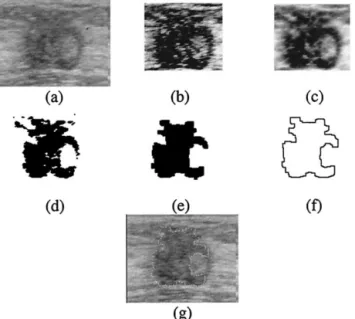
Fig. 10. The resulting images of tumor 3. (a) The original image. (b) The equalized image of (a). (c) The stick image of (b). (d) The image after morphologic process of (c). (e) The image after automatic threshold of (d). (f) The contour of the
tumor derived from (e). (g) The result of the snake.
Fig. 11. The resulting images of tumor 4. (a) The original image. (b) The equalized image of (a). (c) The stick image of (b). (d) The image after morphologic process of (c). (e) The image after automatic threshold of (d). (f) The contour of the
tumor derived from (e). (g) The result of the snake.
Fig. 12. The resulting images of tumor 5. (a) The original image. (b) The equalized image of (a). (c) The stick image of (b). (d) The image after morphologic process of (c). (e) The image after automatic threshold of (d). (f) The contour of the
tumor derived from (e). (g) The result of the snake.
Fig. 13. The resulting images of tumor 6. (a) The original image. (b) The equalized image of (a). (c) The stick image of (b). (d) The image after morphologic process of (c). (e) The image after automatic threshold of (d). (f) The contour of the
CONCLUSION
In this paper, the introduced 3-D ultrasound segmen-tation method not only provides the accurate segmenta-tion of the tumor shape, but also easily evaluates the volume of the tumor. The extension of the traditional 2-D segmentation approach and the use of the depth infor-mation between image slices make the segmentation result more precise. The 3-D techniques, including the 3-D stick, 3-D morphologic process and 3-D snake model, are first used and the outcome is similar to that of the VOCALTM software with the physician’s manual adjustment. The advantage of our approach is that the physician does not need to spend a lot of time manually drawing the initial contour in each ultrasonic image of the tumor. The obtained final 3-D shape of the tumor can
be separated into the contours in image slices and these contours can be treated as the 2-D segmentation result of each ultrasonic image of the tumor. In the future work, there are some other initial shape-finding approaches that can be used to get the initial shape, such as the 3-D watershed transformation (Kuhne et al. 1997). Further-more, the volume information of the tumor can be used to trace the variant state of the tumor in clinical appli-cations.
REFERENCES
Angelini ED, Laine AF, Takuma S, Holmes JW, Hooma S. LV volume quantification via spatiotemporal analysis of real-time 3-D echo-cardiography. IEEE Trans on Medical Imaging 2001;20(6):457– 469.
Besl PJ, Jain RC. Segmentation through variable-order surface fitting. IEEE Trans Pattern Anal Machine Intell 1988;10:167–192.
Fig. 14. The resulting images of tumor 7. (a) The original image. (b) The equalized image of (a). (c) The stick image of (b). (d) The image after morphologic process of (c). (e) The image after automatic threshold of (d). (f) The contour of the
tumor derived from (e). (g) The result of the snake.
Fig. 15. The resulting images of tumor 8. (a) The original image. (b) The equalized image of (a). (c) The stick image of (b). (d) The image after morphologic process of (c). (e) The image after automatic threshold of (d). (f) The contour of the
tumor derived from (e). (g) The result of the snake.
Bovik AC. On detecting edges in speckle imagery. IEEE Trans Signal Processing 1988;36:1618–1627.
Canny J. A computational approach to edge detection. IEEE Trans Pattern Anal Machine Intell 1986;8:679–698.
Carr JC, Fright RW, Gee AH, Prager RW, Daltio KJ. 3D Shape Reconstruction using Volume intersection techniques. In: Proceed-ings of the IEEE Intl. Conf. Comp. Vision. Bombay, India, 1998: 1095–1100.
Chen CM, Lu HH, Lin YC. An early vision-based snake model for ultrasound image segmentation. Ultrasound Med Biol 2000a;26: 273–285.
Chen DR, Chang RF, Huang YL. Breast cancer diagnosis using self-organizing map for sonography. Ultrasound Med Biol 2000b;26: 405–411.
Cohen LD, Cohen I. Finite-element methods for active contour models and balloons for 2-D and 3-D images. IEEE Trans Pattern Anal Machine Intell 1993;15:1131–1147.
Czerwinski RN, Jones DL, O’Brien WD Jr. Line and boundary detec-tion in speckle images. IEEE Trans Image Processing 1998;7:1700– 1714.
Garra BS, Krasner BH, Horii SC, et al. Improving the distinction between benign and malignant breast lesions: The value of sono-graphic texture analysis. Ultrason Imaging 1993;15:267–285. Gonzalez RC, Woods RE. Image enhancement. Digital image
process-ing. Reading, MA: Addison-Wesley, 1992a: 173–180.
Gonzalez RC, Woods RE. Image segmentation. Digital image process-ing. Reading, MA: Addison-Wesley, 1992b: 418 – 420.
Haseyama M, Kumagai M, Kitajima H. A genetic algorithm based image segmentation for image analysis. In: Proc. IEEE Int. Acous-tics, Speech, and Signal Processing. Phoenix, AZ: 1999:3445– 3448.
Jain AK, Zhong Y, Lzkshmanan S. Object matching using deformable templates. IEEE Trans Pattern Anal Machine Intell 1996;18:267– 278.
Kass M, Witkin A, Terzopoulos D. Snakes: Active Contour models. Int J Comput Vision 1988;1(4):321–331.
Kuhne G, Poliwoda C, Reinhart C, et al. Interactive segmentation and visualization of volume data sets. In: Proceedings IEEE Visualiza-tion. Phoenix, AZ: 1997:9 –12.
Lee VS, Lavelle MT, Rofsky NM, et al. Hepatic MR imaging with a dynamic contrast-enhanced isotropic volumetric interpolated breath-hold examination: Feasibility, reproducibility, and technical quality. Radiology 2000;215:365–372.
Leymarie F, Levine MD. Tracking deformable objects in the plane using an active contour model. IEEE Trans Pattern Anal Machine Intell 1993;15:617–634.
Loupas T, Pye SD, McDicken WN. Deconvolution in medical ultrason-ics: Practical considerations. Phys Med Biol 1989;34:1691–1700. Pavlidis T. Algorithms for graphics and image processing. Rockville,
MD: Computer Science Press, 1982.
Pavlidis T, Horowiz SL. Segmentation of plane curves. IEEE Trans Comput 1974;27:860–870.
Ramesh N, Yoo JH, Sethi IK. Thresholding Based on Histogram Approximation. IEEE Proceedings Vision, Image and Signal Pro-cessing 1995;142(5):271–279.
Richard N, Czerwinski RN. Detection of lines and boundaries in speckle images—application to medical ultrasound. IEEE Trans Med Imag 1999;18:126–136.
ter Harr Romeny BM, Titulaer B, Kalitzin S, et al. Computer assisted human follicle analysis for fertility prospects with 3D ultrasound. Springer-Verlag LNCS 1613:1999:56–69.
Wong K, Paulson EK, Nelson RC. Breath-hold three-dimensional CT of the liver with multi-detector row helical CT. Radiology 2001; 219:75–79.
Xiao G, Brady M, Noble JA, Zhang Y. Segmentation of ultrasound B-mode images with intensity inhomogeneity correction. IEEE Trans on Medical Imaging 2002;21(1):48–57.