i
國立交通大學
應用化學系
碩 士 論 文
連續波及飛秒脈衝雷射應用於微米至奈米大小球狀
物質的光學捕捉
Optical Trapping Dynamics of Micron- to Nanometer-Sized Spherical
Target Materials by Continuous Wave- and Femtosecond Pulse-Mode
Laser Beams
研究生:江威逸
指導教授:增原 宏 教授
ii
連續波及飛秒脈衝雷射應用於微米至奈米大小球狀物質的光學捕
捉
Optical Trapping Dynamics of Micron- to Nanometer-Sized Spherical
Target Materials by Continuous Wave- and Femtosecond Pulse-Mode
Laser Beams
研究生:江威逸 Student: Wei-Yi CHIANG
指導教授:增原 宏 教授 Advisor: Prof. Dr. Hiroshi MASUHARA
國立交通大學
應用化學系
碩士論文
A Thesis
Submitted to M. S. Program Department of Applied Chemistry
College of Science National Chiao Tung University in Partial Fulfillment of the Requirements
for the Degree of Master
in
Applied Chemistry July 2012
Hsinchu, Taiwan, Republic of China
iii
Published paper
Anwar Usman, Wei-Yi Chiang, Hiroshi Masuhara, Optical trapping and polarization-controlled scattering of dielectric spherical nanoparticles by femtosecond laser pulses, J. Photochem. Photobiol. A: Chemistry 234 (2012) 83-90.
Published proceeding
Anwar Usman, Wei-Yi Chiang, Hiroshi Masuhara, Laser Trapping-Induced Reconfiguration of Individual Smectic Liquid Crystal Micro-Droplet Showing Size-Dependent Dynamics, Proc. SPIE 8274 (2012) 82740L1-8.
Conference
1. “Orientation Modulation in Individually Trapped Liquid Crystal Droplets by Tightly Focused Laser Beam”,
Wei-Yi Chiang, Anwar Usman, Takayuki Uwada, Hiroshi Masuhara,
2011 Spring Symposium of Photochemistry Association in Taiwan, 15 - 16 February, 2011, Hsinchu, Taiwan
2. “Orientation Modulation in Individually Trapped Liquid Crystal Droplets by Tightly Focused Laser Beam”,
Wei-Yi Chiang, Anwar Usman, Takayuki Uwada, Hiroshi Masuhara,
The 3rd Workshop on Laser Bio/Nano Science, 4th March, 2011, Hsinchu, Taiwan 3. “Size-dependent phase modulation of individually trapped liquid crystal micro-droplets”,
Wei-Yi Chiang, Anwar Usman, Hiroshi Masuhara,
2011 年光化学討論会, 6-8 September, 2011, Miyasaki, Japan
4. “Size-dependent phase modulation of individually trapped liquid crystal micro-droplets”, Wei-Yi Chiang, Anwar Usman, Hiroshi Masuhara,
Japan-Taiwan joint workshop: Future Perspective on NanoBio Science Pioneered by Light, 4th Octorber, 2011, Hsinchu, Taiwan
5. “Femtosecond Laser Pulse-Induced Optical Trapping and Polarization-Controlled Off-Axis Scattering of Dielectric Spherical Nanoparticles”,
Wei-Yi Chiang, Anwar Usman, Hiroshi Masuhara,
2012 Spring Symposium of Photochemistry Association in Taiwan, 9-10 February, 2012, Kaohsiung, Taiwan
6. “Concentration Dependence of Polarization-Controlled Scattering of Polystyrene Nanoparticles by Femtosecond Laser Pulses”,
iv
応用物理学関係連合講演会, 15-18 March, 2012, Tokyo, Japan
7. “Axial Field-Controlled Direction of Scattered Dielectric Spherical Nanoparticles in Optical Trapping”,
Anwar Usman, Wei-Yi Chiang, Hiroshi Masuhara,
2012 Spring Symposium of Photochemistry Association in Taiwan, 9-10 February, 2012, Kaohsiung, Taiwan
8. “Dynamic Optical Force Exerting on Dielectric Nanoparticles by Femtosecond Laser Pulses, Leading to Polarization-Controlled Off-Axis Scattering”,
Anwar Usman, Wei-Yi Chiang, Hiroshi Masuhara,
応用物理学関係連合講演会, 15-18 March, 2012, Tokyo, Japan
9. “Femtosecond Laser-Induced Trapping and Off-Axis Ejection of Dielectric Spherical Nanoparticles”,
Anwar Usman, Wei-Yi Chiang, Hiroshi Masuhara,
The 1st Workshop on Laser Trapping with Laser BioNano Science, 4-6 April, 2012, Hsinchu, Taiwan
10. “Laser Trapping-Induced Reconfiguration of Individual Smectic Liquid Crystal Micro-Droplet Showing Size-Dependent Dynamics”,
Anwar Usman, Wei-Yi Chiang, Takayuki Uwada, Hiroshi Masuhara, SPIE photonic west, 22-28 January, 2012, San Francisco, USA
v
連續波及飛秒脈衝雷射應用於微米至奈米大小球狀物質的光學捕捉
研究生:江威逸 指導教授:增原宏 教授
國立交通大學 應用化學系碩士班
摘要
微奈米結構有機物或聚合物的光學捕捉提供光學調控分子排列以及聚焦雷射產生 動態變化的資訊。這篇論文含蓋了兩個方向,分別是藉由聚焦連續波雷射光學捕捉引發 微米大小液晶液珠內的分子排列以及飛秒雷射照射在 50 奈米大小的聚苯乙烯球所產生 的動態變化。 我們探討在聚焦連續波雷射照射下液晶液珠內的分子重排而重排發生自內部並遍 及整個液珠,且相轉變的門檻能量隨液珠大小而改變。我們認為當焦點體積內的光學重 組克服液珠的介面錨定效應便會產生重排。藉由探討電場對液晶液珠的作用能以及引入 液珠介面錨定效應的概念,我們成功建立了可解釋隨液珠大小而產生不同變化的模型。 飛秒脈衝雷射照射在 50 奈米大小聚苯乙烯球的動態變化呈現出極化方向控制的兩 個相反方向並交互變換的散射且與雷射極化方向相互垂直。由於光電場和極化介電球誘 導偶極矩之間的相互作用,我們重新討論作用在介電奈米球體上的勞倫茲力用以解釋新 現象的發生。我們考慮高數值孔徑物鏡產生的軸向及橫向電場導出軸向電場是散射力及 時間變化力橫向組成的原因並且控制雷利粒子散射的方向。透過這些發現,我們提供了 聚焦超快雷射脈衝雷利粒子動態光學捕捉很重要的資訊。vi
Optical Trapping Dynamics of Micron- to Nanometer-Sized Spherical Target
Materials by Continuous Wave- and Femtosecond Pulse-Mode Laser Beams
Student: Wei-Yi CHIANG Advisor: Prof. Dr. Hiroshi MASUHARA
M. S. Program, Department of Applied Chemistry
National Chiao Tung University
Abstract
Optical trapping of organic or polymeric micro- and nano-structures provides
information on how their molecular configuration is optically manipulated or how their
dynamical motions are controlled by the focused laser beam. This thesis covers both ideas of
optical trapping-induced molecular configuration in micro-sized individual
4’-n-pentyl-4-cyanobiphenyl liquid crystalline droplets by tightly focused continues wave
laser beam and dynamical motions of 50-nm-sized polystyrene beads by femtosecond pulsed
laser beam.
We explore the reconfiguration in liquid crystal droplet under the irradiation of
tightly focused cw laser beam. We show that reconfiguration took place throughout the inside
of droplet, and the threshold power of the phase transition depends on droplet size. We
propose that the droplet reconfiguration takes place when optical reorientation at the focal
volume overcomes the droplet-liquid interfacial anchoring effect. By considering interaction
energy of liquid crystal droplet by electric field and introducing liquid crystal droplet
vii dynamic change depending on size.
The dynamic motions of the 50 nm-sized polystyrene beads impinged by
femtosecond pulsed laser beams show the polarization-controlled scattering in two opposite
directions, in alternating manner, perpendicular to the laser polarization. To understand this
new phenomenon we reconsider Lorentz force acting on a dielectric spherical nanoparticle
due to interactions between light electric field and induced dipole moment of the polarizable
dielectric sphere. We take axial and lateral electric fields into account produced by high
numerical aperture objective lens. The axial electric field is responsible for lateral components
of the scattering and temporal forces, and hence, controls the scattering directions of the
Rayleigh particles. These findings provide important information about the dynamic optical
viii
Acknowledgment
Two years ago when I joined this laboratory I was worry with the new environment
and unfamiliar people. Specially, all of the professors in this laboratory come from other
countries, so I need to communicate in English, which is not familiar language for me, with
them. Fortunately, even though my poor English, all of the professors have nice patience to
listen and teach me.
Now, upon completing this thesis, I would like to express my gratitude to whom
that have helped me in this two years. Particularly, I am deeply indebted to my supervisors
Prof. Hiroshi Masuhara and Dr. Anwar Usman who supervise, advice, and encourage me to
perform my research works and to write this thesis.
I also want to express my appreciation to Prof. Atsushi Miura, Prof. Takayuki
Uwada, and Dr. Kenichi Yuyama who gave me helps, supports, and suggestions during my
research works.
Additionally, I am obliged to acknowledge to my reviewers Prof. Hiroshi Masuhara,
Prof. Atsushi Miura, Prof. Yen-Ju Cheng and Prof. Yoshiaki Teranishi for their kind evaluation
on my thesis and permission to get the Master degree.
In this occasion, I also want to thank my seniors, Ping-Yu Hee, Jing-Ru Tu,
Chung-Wei Huang and Tsung-Han Liu; classmates, Shun-Fa Wang, Ching-Hsu Tseng,
ix
encouraging, and help during these two years of laboratory life.
Besides, I want to thank the Department of Applied Chemistry of National Chiao
x
Contents
摘要 ... v
Abstract ... vi
Acknowledgment ... viii
List of Figures ... xii
CHAPTER 1 Introduction ... 1
References ... 7
CHAPTER 2 Polarization and Droplet Size Dependences of Laser Trapping-Induced Reconfiguration in Individual Radial Symmetric Liquid Crystal Micro-Droplets ... 8
1. Introduction ... 9
2. Experimental ... 12
2.1 Optical setup ... 12
2.2 Sample preparation ... 13
3 Results ... 15
3.1 Reconfiguration of the LC droplet... 15
3.2 Droplet size-dependence of threshold laser power ... 18
4. Discussion ... 20
4.1 Laser trapping-induced reconfiguration ... 20
4.2 A proposed model mechanism for droplet size dependence of threshold power... 23
5. Summary ... 29
6. References ... 30
CHAPTER 3 Optical Trapping and Polarization-Controlled Scattering of Dielectric Spherical Nanoparticles by Femtosecond Laser Pulses ... 32
1. Introduction ... 33
2. Experimental ... 36
2.1 Optical setup ... 36
2.2 Sample cell and detection system ... 37
3. Results ... 39
3.1 Polarization-controlled off-axis scattering of nanoparticles ... 39
3.2 Temporal evolutions of the bright spot at the focal spot ... 42
4. Discussion ... 44
4.1 Optical trapping and nanoparticle flows ... 44
4.2 Radiation and temporal forces acting on a dielectric spherical nanoparticle ... 47 4.3 Comparison between radiation forces on the nanoparticles in femtosecond laser
xi
pulses and in CW laser ... 52
5. Summary ... 57
6. References ... 58
xii
List of Figures
Figure 1.1 The optical forces acting on particle performed by momentum transfer of photons. 3 Figure 2.1 A schematic diagram of the experimental setup ... 13 Figure 2.2 Sequences of time evolution of POM images of an individual smectic 5CB droplet
optically trapped by a linearly polarized trapping beam at; (a) 130 mW (or 60 MW/cm2); (b) 850 mW (or 360 MW/cm2), and by a circularly polarized trapping beam at; (c) 130 mW (or 60 MW/cm2), (d) 460 mW (or 190 MW/cm2), and (e) 940 mW (or 390 MW/cm2) ... 17 Figure 2.3 Plot of threshold laser power density to induce the phase transition as a function of
droplet radius ... 19 Figure 2.4 (a) The total energy as a function of the radius of the droplet at different level of
laser power. (b) Plot of the predicted dependence of threshold laser power density to induce a negative local minimum, which is related to the reconfiguration, as a function of droplet radius relative to the beam waist, based on Eqn. (2.2) (see text for details). ... 28 Figure 3.1 Schematic diagram of the experimental set-up ... 37 Figure 3.2 A combination of two halves of two different image frames showing optical
trapping and scattered polystyrene nanoparticles by femtosecond-pulse modes and showing their optical trapping by cw Ti:sapphire laser beams (λ= 800 nm) ... 41 Figure 3.3 (a) Time-dependent line profile intensity under femtosecond-pulse (black line) and
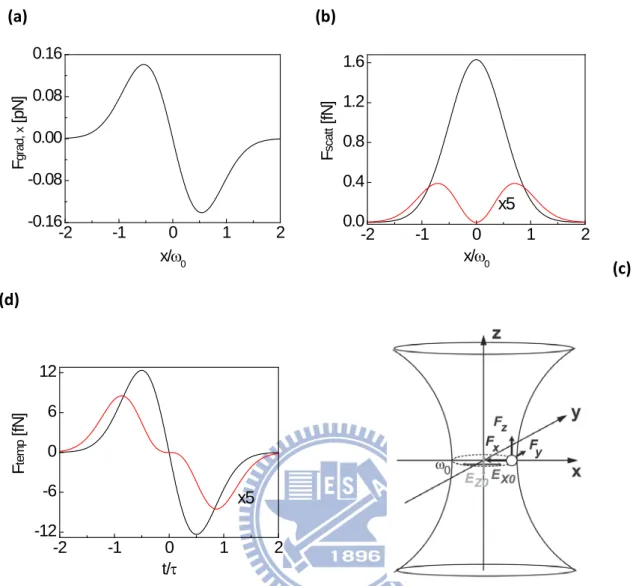
cw mode (gray line). (b) The typical time-dependent event when bright locus of scattered polymer beads from the focus spot is along the two alternating left and right directions within the observation window of 120 s. Experimental information for data shown in the figures (a) and (b) are related to those in Figure 3.2a... 43 Figure 3.4 Plots of calculated gradient, scattering, and temporal forces acting on a
polystyrene nanoparticle locating in the focal plane (z = 0) as a function of either the normalized lateral position of x ω⁄ vor normalized time t τ0 ⁄ (a) Lateral component of the gradient force, Fgrad, parallel to Ex, at the peak of a pulse duration (t τ = 0⁄ ) (b) Axial (black) and lateral (red) components of the scattering force, Fscatt, at the peak of a pulse duration (t τ = 0⁄ ) (c) Axial (black) and lateral (red) components of the temporal force, Ftemp. (d) A schematic illustration of the gradient, scattering, and temporal forces ... 56
1
CHAPTER 1
2
The interactions of light with matter result in many fascinating phenomena. Over a
long history of investigation of such interactions, the researches nowadays have arrived at
nanometer scale of target material, a dimension much smaller than the wavelength of utilized
light. One of the fascinating ideas in optics is the use of light to trap atoms and small particles
[1,2]. This so called optical tweezers or optical trapping technique has already proven to be an
essential tool in physics, biology, and chemistry [3,4]. Among the interesting applications of
this technique in fabrication and characterization at the nanoscale [5], in such a thriving field
of research over the past 40 years the laser trapping-induced crystallization of amino acids has
generated attentions as a model for three-dimensional molecular rearrangement by focused
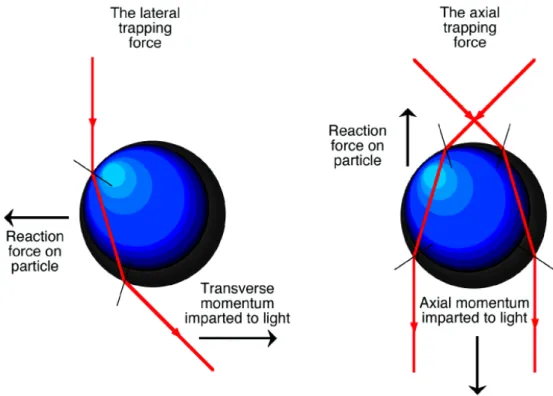
laser beam [6-10]. The basic concept of the optical trapping is the generation of gradient force,
as illustrated in Figure 1.1 that the incident light is refracted through the particle, leading to
the change of momentum of the photons. According to the conservation of momentum, a
3
Figure 1.1 The optical forces acting on particle performed by momentum transfer of photons.
This thesis attempts to understand molecular reconfiguration inside microparticles
trapped by focused laser beam as well as to explore the novel trapping phenomena of
nanoparticles by ultrafast laser pulses. For the earlier attempt, liquid crystal droplets with soft
and reconfigurable molecular organization properties were used as the target material
optically trapped by continuous wave-mode laser beam. Though the researches on the liquid
crystal droplets by focused beam have been started a few years ago, most researches
employed the laser power and optical condition below those necessary to induce a laser
trapping crystallization similarly to the amino acids [12-15]. Thus, in this work, the trapping
behavior was studied in a wide range of laser power tightly focused by a high numerical
4
the target material, and femtosecond pulse-mode laser beam was used as the trapping beam
substituting the traditional continuous wave laser. We note that in the beginning of ultrashort
pulsed laser trapping was started, the laser pulse trapping was believed to be as just effective
as cw laser trapping of microparticles in particular [16]. Indeed, when picosecond pulse-mode
laser beam was finally shown to be able to trap less-than-5-nm sized CdTe quantum dots in
2007, optical trapping experiments with laser pulses started to attract more and more attention
with many questions still to explore. More recently, research works on the ultrashort laser
pulse-induced trapping behavior of nanoparticles provide several excellent phenomena, for
instance, the control of crystalline properties and dimensions of nanodeposits of 25-nm-sized
CdS particles [17] and the split of trapping site of gold NPs into two equivalent positions
shifted from the focal center [18]. These findings highlight the advantages of pulse- over
cw-mode laser beam in trapping ability and control on Rayleigh particles.
However, such fundamentally different behaviors of the three-dimensional optical
trapping with the laser pulses to the cw laser also require theoretical elucidations, because the
new phenomena are beyond the concept of conventional optical trapping. Thus, for a
quantitative explanation we should rely upon the scattering theory of electromagnetic
radiation, reexamining gradient, scattering, and temporal pulse-radiation forces, which are
respectively related to spatial Lorentz force [19,20], momentum transfer from light to the
5
cross section value of the nanoparticles was obtained based on Mie theory [21].
In Chapter 2 we describe the polarization- and droplet size-dependence of laser
trapping-induced reconfiguration in individual radial symmetric liquid crystalline
micro-droplets suspended in water. We found that the optical trapping of the droplet is indeed
followed by a molecular reconfiguration, which takes place only when laser power density is
above a definite threshold level. The relevant qualitative theoretical approximation is
described based upon a likely mechanism of the molecular reconfiguration inside the droplet
that involves local optical reorientation at focal volume when the interaction energy of liquid
crystals with dielectric anisotropy aligned by the electric field of the focused laser beam
exceeds Frank distortional energy. With this proposed mechanism, we show that the predicted
dependence of the threshold power on the droplet size is in qualitative agreement with the
experimental observation.
Chapter 3 discusses femtosecond laser pulse trapping behavior of polystyrene
nanoparticles. The main focus of this chapter is laser pulse trapping behavior in comparison
with the cw mode. We found that the laser pulses can trap a larger number of nanoparticles. In
addition, the laser pulses induce nanoparticle flows out of the focal spot in two opposite
directions, in an alternating manner, controlled by the laser polarization. We evaluate both
gradient, scattering, and temporal forces by adopting Lorentz force of fundamental Gaussian
6
nanoparticles obtained based on Mie theory. We demonstrate that the lateral and axial electric
fields produced by the high numerical aperture objective lens are responsible for the present
novel phenomenon.
In Chapter 4 we conclude some important findings of the research works in this
thesis, and provide the future outlooks of this research works, which already start to open new
vistas for controlling the molecular reordering and reconfiguration of micro-droplets by the
cw laser trapping, controlling dynamical motion of nanoparticle assembly by ultrafast laser
pulses. The latter finding, in particular, is considered to be applicable for separation and
sorting of nanoparticles with either different polarizabilities or scattering cross sections. Thus,
7
References
[1] A. Ashkin, Phys. Rev. Lett. 24 (1970) 156..
[2] A. Ashkin, Proc. Natl. Acad. Sci. USA 94 (1997) 4853.
[3] K.C. Neuman, S.M. Block, Rev. Sci. Instrum. 75 (2004) 2787. [4] K. Dholakia, P. Reece, M. Gu., Chem. Soc. Rev. 37 (2008) 42. [5] E. Ozbay., Science 311 (2006), 189.
[6] T.Sugiyama, T. Adachi, H. Masuhara, Chem. Lett. 36 (2007) 1480. [7] Y. Tsuboi, T. Shoji, N. Kitamura, J. Phys. Chem. C 114 (2010) 5589. [8] T. Sugiyama, T. Adachi, H. Masuhara, Chem. Lett. 38 (2009) 482.
[9] T. Rungsimanon, K. Yuyama, T. Sugiyama, H. Masuhara, N. Tohnai, M. Miyata, J. Phys. Chem. Lett. 1 (2010) 599.
[10] T. Rungsimanon, K. Yuyama, T. Sugiyama, H. Masuhara, Cryst. Growth Des. 10 (2010) 4686.
[11] J.E. Molloy, M.J. Padgett, Contemp. Phys. 43 4 (2002) 241
[12] E. Brasselet, S. J. Joudkazis, Nonlinear Opt. Phys. Mater. 18 (2009) 167. [13] N. Murazawa, S. Joudkazis, H. Misawa, Eur. Phys. J. E 20 (2006) 435. [14] N. Murazawa, S. Joudkazis, S. Matsuo, H. Misawa, Small 1 (2005) 656. [15] N. Murazawa, S. Joudkazis, H. Misawa, Opt. Express 14 (2006) 2481.
[16] B. Agate, C.T.A. Brown, W. Sibbett, K. Dholakia, Opt. Express 12 (2004) 3011. [17] M. Sanz, R. de Nalda, J.F. Marco, J.G. Izquierdo, L. Banares, M. Castillejo, J. Phys.
Chem. C 114 (2010) 4864
[18] Y. Jiang, T. Narushima, H. Okamoto, Nat. Phys. 6 (2010) 1005 [19] P. Bartlett, S. Henderson, J. Phys.: Condens. Matter 14 (2002) 7757 [20] Y. Harada, T. Asakura, Opt. Commun. 124 (1996) 529
[21] C.F. Bohren, D.R. Huffman, Absorption and Scattering of Light by Small Particles, Wiley, New York, 1983.
8
CHAPTER 2
Polarization and Droplet Size Dependences of Laser
Trapping-Induced Reconfiguration in Individual Radial
9
1. Introduction
Optical trapping technique utilizing a tightly focused continuous-wave (cw) laser
beam allows one to manipulate micron- or a few tens of nm-sized objects with a high
precision [1,2]. Therefore, this technique becomes indispensable and has been widely
employed to control the deposition of dielectric particles [3,4], as well as to induce optical
manipulation on single cells [5], polymers [6,7], micelles [8], J-aggregates [9], and amino
acids [10,11]. In particular, the optical trapping of glycine, the simplest amino acid, dissolved
in water leads to nucleation and growth of its single crystal [10,12] with its polymorphs being
controllable by the laser power [13,14]. Such a three-dimensional molecular alignment
accurately driven by a focused light is of interest for both fundamental sciences and
applications. This finding also implies migration of molecules or clusters from the
surrounding area to the focal spot as well as cooperative molecular realignment, and such
effects have been demonstrated for gold nanoparticles and liquid crystal (LC) thin film by the
focused laser beam [15-17].
The laser trapping-induced optical realignments have also been revealed in
spherical LC droplets with various kinds of self-organized configurations depending on
droplet-liquid boundary conditions in the medium they were dispersed [18-24]. Typically, the
laser trapping beam can induce reconfiguration in radial nematic LC droplets, leading to
10
transfer [20,23].Similar phenomena were also observed for optically trapped bipolar nematic
[18,19] or cholesteric LC droplets [21,22]. In the latter case, in particular, the rotation is
accompanied by a distinct vertical motion of the droplet in the optical trap [21,22]. By
contrast, at the similar level of laser power, molecular reconfiguration inside smectic LC
droplets has never been observed, although the laser trapping beams can induce axial and
lateral repositioning leading to wobbing rotation of the trapped droplets when the laser beam
is circularly polarized [25]. Lamellar organization of LC molecules inside the droplets has
been considered to induce large elastic rigidity, preventing the light-induced molecular
reconfiguration inside the droplets [24,26]. Measuring rotation frequency of the optically
trapped droplet and polarization change of the laser beam passed through the micro-sphere
allow one to determine the viscosity of surrounding media precisely [27,28].
Recently, we have reported laser trapping behavior of radial symmetric
4'-pentyl-4-cyanobiphenyl (5CB) liquid crystalline micro-droplets dispersed in heavy water
(D2O) under highly focused near-infrared cw laser beam [29]. In our experiments, we found
that the optical trapping of the radial symmetric droplet is indeed followed by a molecular
reconfiguration, which takes place only when laser power density is above a definite threshold
level. Here, we report in some detail a qualitative understanding of the experimentally
observed reconfiguration by considering that the threshold and the dynamics of the
11
likely mechanism of the molecular reconfiguration inside the smectic LC droplet involves
local optical reorientation at focal volume when the interaction energy of LCs with dielectric
anisotropy aligned by the electric field of the focused laser beam exceeds Frank distortional
energy, followed by reconfiguration inside the confined droplet. With this mechanism, we
show that the predicted dependence of the threshold power on the droplet size is in qualitative
12
2. Experimental
2.1 Optical setup
The experimental setup is shown in Figure 2.1. A continuous wave (cw) 1064 nm
Nd:YVO4 laser beam (Spectra Physics; J20I-BL-106C) was focused into the sample cell, held
on the stage of an inverted microscope (Olympus IX71). The beam was focused by an
UPlanApo oil immersing objective lens (magnification 100 times and numerical aperture
(N.A.) 1.35). After passing through the power adjustment, the laser beam was expanded and
collimated to about 7 mm in diameter and the polarization state was controlled by a half-wave
plate. After the objective lens, the laser power was operated in the range of 0.1-1.0 W, and the beam waist for 1064 nm was calculated to be 0.39 μm. The liquid crystal droplet reoriented by
the highly focused laser beam was monitored conventionally by polarization optical
microscopy (POM), which is composed by two orthogonal polarizers. From the top of the
microscopy, visible probe light from a halogen lamp (λ=400-750 nm) was passed through a
pair of polarizers and condenser lens, N.A. is 0.55, sandwiching the sample. The coupled
charge-coupled device (CCD) camera (JAI; CV-A55IR E), running at 30 interlaced frames per
second, was used to detect the transmittance probe light. The scattering light from near
13
Figure 2.1 A schematic diagram of the experimental setup; BS = beam splitter, λ/2=half-wave plate, LPF = low pass filter with transmission edge at 900 nm. Inset: the cell containing an individually trapped smectic LC droplet by focused laser beam.
2.2 Sample preparation
The sample cell was prepared by two cover glasses (Matsunami; thickness
0.12-0.17 mm), and a chamber between the two cover glasses was formed by strips of
parafilms along the glass edges with height 15-25 μm. The chamber was filled by 5CB
14
and extraordinary refractive indices,
n
o andn
e, are 1.54 and 1.74, respectively) suspendedin D2O without any additional surfactants. Comparing with H2O, in this kind of condition, we
can avoid temperature elevation induced by 1064 nm laser beam that has been reported to be
2.6 ºC/W and 24 ºC/W in H2O [30,31]. Due to the interfacial tension, 5CB droplet always
15
3 Results
3.1 Reconfiguration of the LC droplet
The diameter of the micro-droplets was within submicron to several microns. Due
to their high refractive index, the droplets are highly polarizable and easily trapped by a steep
optical-field gradient. In Figure 2.2 (a-b) are shown POM images for a ~2.5-μm-sized smectic
droplet upon irradiation by linearly polarized laser beam with different laser power densities.
We found that at low laser powers the droplet is optically trapped, so that its center is located
at the focal area, its POM images show no time dependence, and the intrinsic lamellar
configuration inside the droplet apparently remains intact. When the laser power was
increased to few hundreds of MW/cm2, we observed that the POM images of the optically
trapped droplet are time-dependent. The images showed clearly that the radially symmetric
configuration of the smectic droplet disappears, followed by the appearances of ring patterns
of transmitted probe light passing through the trapped droplet. Typically, the ring patterns
consisting of a small ring near the center and one or two larger concentric rings showed up
clearly on time scales of seconds to a few tens of seconds depending on the laser power. Such
time evolution of POM images indicate unambiguously that the radial symmetric droplet is
reconfigured under the high power of laser trapping beam. In addition, we observed
16
transmission images, though it is not so clearly observed for droplets with diameter less than 2 μm.
Figure 2.2 (c-e) shows the POM images for a ~3.5-μm-sized droplet trapped by
circularly polarized laser beam with different laser power densities. Notably, for the small
droplet, the circularly polarized laser trapping beam did not induce wobbing rotation. This
suggests that optical trapping of the small droplet is on-center and it is consistent with the
earlier report, in which off-center optical trapping is observed for smectic droplets larger than 4 μm in diameter independent on the laser power [25]. When we increased the laser power,
the POM images show that the droplet was also trapped steadily at the early time of
irradiation, and such a stable optical trap was followed by a wobbing rotation of the droplet
around the trapping axis. The transition from the static to rotation states takes place in a few
tens of milliseconds. In this case, once the droplet started to undergo a wobbing rotation, the
rotation continues without stopping within our observation window of 90 s. Further increasing
the laser power led a wobbing rotation to undergo temporarily. When such rotation stopped,
the appearances of ring patterns similarly to those for a droplet trapped by the linearly
17
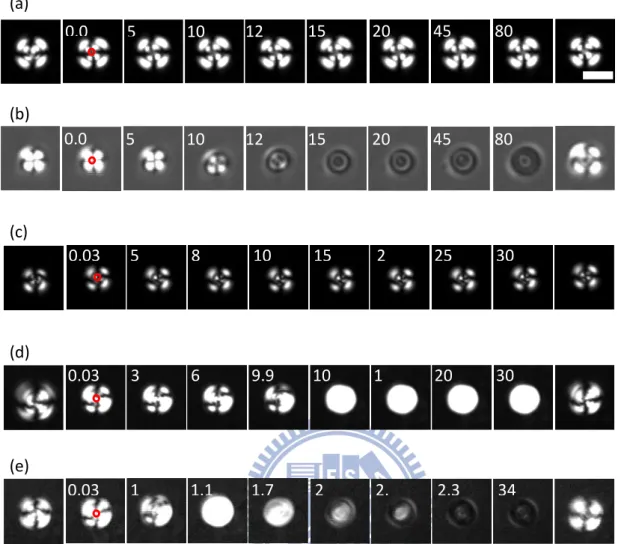
Figure 2.2 Sequences of time evolution of POM images of an individual smectic 5CB droplet optically trapped by a linearly polarized trapping beam at; (a) 130 mW (or 60 MW/cm2); (b) 850 mW (or 360 MW/cm2), and by a circularly polarized trapping beam at; (c) 130 mW (or 60 MW/cm2), (d) 460 mW (or 190 MW/cm2), and (e) 940 mW (or 390 MW/cm2). The trapping time in second is indicated in each snapshot; while the most left and most right snapshot in each sequence is the image just before laser trapping beam is switched on and just after the beam is switched off, respectively. The red circles denote the focal spot area. The scale bar of 3 μm is applied for all images.
In addition to such polarization-dependent dynamics of the reconfiguration,
increasing the laser power above the threshold led all the dynamics to be faster. When the
laser beam was switched off, the transient ring patterns vanish immediately on the time scale
of tens of milliseconds, restoring the initial radially symmetric pattern of a radial symmetric
0.0 5 10 12 15 20 45 0.0 5 10 12 15 20 45 80 80 (a) 0.03 3 6 9.9 10 1 20 30 0.03 1 1.1 1.7 2 2. 2.3 34 0.03 5 8 10 15 2 25 30 (b) (c) (d) (e)
18
droplet. Such an immediate restoration of the initial pattern, however, is independent on the
laser power, and it is evidence for the existence of droplet-liquid interfacial anchoring effect
as well as for the absences of optical memory, hysteresis, or storage effects.
3.2 Droplet size-dependence of threshold laser power
By varying the laser power to trap an individual LC droplet, we found that there is a
clear threshold power, above which the optical trapping is followed by molecular
reconfiguration throughout the inside of the droplet [29]. To evaluate the dependence of the
threshold power on the droplet size and polarization state, we have performed and repeated
the above process for different sizes of LC droplets for both linearly and circularly polarized
beams. We found that the threshold is higher for a larger droplet. As far as the optical
reconfiguration throughout the inside of the droplet as indicated by the formation of ring
patterns is considered, we found that the threshold for circularly polarized laser beam tends to
be slightly larger than that for linearly polarized beam. The droplet size and polarization
dependences of the threshold trapping laser power to induce reconfiguration are shown in
19
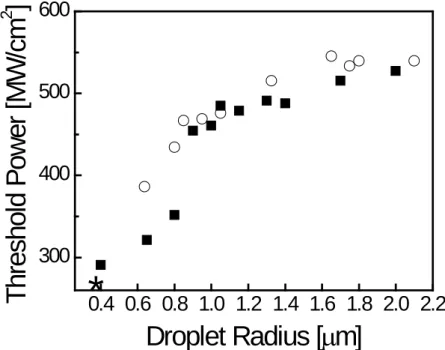
Figure 2.3 Plot of threshold laser power density to induce the phase transition as a function of droplet radius. The calculated beam waist is denoted by an asterisk. Data points denoted with filled rectangular and open circular are for linearly and circularly polarized beams, respectively.
0.4 0.6 0.8 1.0 1.2 1.4 1.6 1.8 2.0 2.2
300
400
500
600
T
hr
es
hol
d P
ow
er
[
M
W
/c
m
2]
Droplet Radius [µm]
*
20
4. Discussion
4.1 Laser trapping-induced reconfiguration
We should note that our observation on laser trapping properties of the radial
symmetric 5CB droplet at low laser powers are in accordance with those recently reported and
well documented in works by Murazawa et al. [25] and Brasselet et al. [24] Our important
experimental finding is that, actually, optically induced reconfiguration does exist in the
droplet under high laser powers with a sharp threshold, similarly to the cases of other LC
droplets with radial configurations [23,32,33].
To interpret the optically-induced reconfiguration in the radial nematic LC droplet,
we first consider optical reorientation of LCs, analogous to optical Fréederickscz transition
(OFT) in LC thin films. The optical reorientation should take place when the free-energy by
the light field exceeds Frank distortional energy. In a corresponding LC thin slab analog, in
which reorientation driven by optical nonlinearities has been accurately described, for
conventional light irradiations, the threshold of light density to induce molecular reorientation,
Ith, is given by [34,35] ) ( π I 2 2 2 2 2 th o e o e n n n d cKn − = (2.1)
21
extraordinary and ordinary refractive index, and K is the average Frank elastic constant. If
one considers that the diameter of the droplet is approximately equal with the thickness of the
LC thin slab analog, with K ≅10 pN, Eqn. (1) gives the threshold light density for a droplet
of 2.5-μm-diameter to be approximately 2 MW/cm2, corresponding to electric field strength of 2 V/μm. This calculated threshold power, however, is about two orders of magnitude lower
than the actual power to induce the reconfiguration throughout the inside of the droplet (the
threshold power density is ~360 MW/cm2). The striking difference between the calculation
and experimental value is due to that laser intensity of a focused beam is steeply distributed
around the diffraction limited size, not all inside the droplet volume. Nevertheless, with this
calculation, we proposed that the focused beam with laser powers slightly above OFT
threshold should not only generate gradient force, which confines stably the birefringent
droplet, but such a polarized laser beam propagating in the confined droplet can also induce
optical reorientation locally within the focal spot at the droplet center, although such local
reorientation is too small inside the droplet to be detected by the POM imaging.
As a self-organized structure, droplet-liquid interface energetic will also control the
molecular orientation inside the droplet through the interfacial anchoring effect. In this sense,
the interface can be considered to act as the anchoring layer. Under the optical trapping at
laser powers between the OFT and reconfiguration threshold, the reorientation propagates
22
thus, the droplet may adopt a kind of intermediate configuration. In this situation, the local
reorientations inside the droplet will induce non-symmetrical orientations, and such symmetry
breaking inside the droplet leads to spatially unequal torque. This is clearly indicated by
rotation of the droplet under circularly polarized beam. At higher powers, when optical
reorientation overcomes the anchoring effect, rotation of the droplet is coupled with its
reconfiguration. Thus, the rotation is induced as the result of local optical reorientations and it
can be considered as an early process or precursor of the reconfiguration, which most
probably is an equilibrium reorientation throughout the inside of the droplet. This means that,
when such an equilibrium configuration is formed, the local birefringence ultimately becomes
negligible, the torque is spatially balanced, and the rotation stops as observed with the
appearances of ring patterns.
The ring patterns of the optical transmission can be usually related to a far-field
intensity distribution of the transmitted light due to its spatial self-phase modulation and the
wave-front curvature, when the light passes through the nematic LC thin film [36,37]. In this
droplet case, the ring patterns may indicate that, in the equilibrium state, the LC molecules
inside the droplet is reoriented, but since both linearly and circularly polarized beams result in
the same POM images of the reconfigured droplet, we could draw a conclusion that their LC
orientations are not preferred along the laser polarization. This is an indication that
23
cooperative effects throughout the inside of the droplet. Though the LC molecular
configuration inside the droplet is still an open question, we qualitatively interpreted that one
of possible structures is a kind of twisted configuration [29]. However, as the initial pattern is
immediately restored when the laser beam is switched off, we could consider that the
molecular alignment at the interfacial layer which acts as an anchoring surface should always
remain intact.
Upon the reconfiguration, the local refractive index inside the droplet should jump
between the extraordinary and ordinary refractive indices. As a consequence, the optical
forces exerting on the droplet should be also modified, resulting in a relocation of the droplet
slightly from the initial trapping center. This could be attributable to the change in droplet
diameter in the POM image. In comparison, the similar effect has been observed in
photo-induced molecular reorganization inside optically trapped cholesteric LC droplets
[21,22].
4.2 A proposed model mechanism for droplet size dependence of threshold
power
Considering that the reconfiguration is initially induced and started by the optical
24
be the key factor in determining the threshold power. For droplets with radius comparable to
the beam waist,
a
≅
r
0, in which all LC molecular dipoles in the droplets interact with atightly focused laser beam and are directly reoriented by the light, the reconfiguration
undergoes at the lowest threshold power. For larger droplets with
a
>
r
0, the relevant scalefor the interactions is limited in the small volume of focal spot. Thus, the LC molecules at the
positions
r
>
r
0 inside the droplet are reoriented either by the propagation of opticalreorientation at the focal spot due to cooperative effects or by the small light field of
transverse Gaussian intensity, leading to a higher threshold power for a larger droplet. This
interpretation is clearly demonstrated by the tendency of the threshold power in the
experiment (Figure 2.3). However, this finding contradicts essentially to the prediction of the
OFT threshold by conventional light irradiations (Eqn. 2.1), by which the threshold is
inversely proportional to square of droplet diameter. To clarify this issue, here, we evaluate
the optical reorientation and reconfiguration by a tightly focused laser beam as follows.
Firstly, we consider the interaction energy of LCs aligned throughout the inside of
the droplet by the electric field of the focused beam can be expressed as
∫
−
∝
αQI(
,
)dV
)
,
U(
r
z
r
z
, where α is polarizability, I(r,z) is the light field intensity as afunction of the lateral (r) and axial (z) distances from the center of the focal spot, V is volume
of the droplet, and Q is dimensionless factor for the target materials in the geometrical optics
25
Gaussian beam around the focus area is approximately expressed as,
( )
r,z I0exp(
2kr2 (kr02 4z2))
I = − + , where
I
0 is the light power intensity at the center offocal spot is k wavenumber in the surrounding medium. Secondly, since the light-induced
reconfiguration always competes with LC droplet-liquid interfacial anchoring effect [39], just
like a system consisting of two-coexisting processes, namely, an optical controlled-lattice site
surrounded by the interface-controlled self-aligned geometric configuration, we evaluate
qualitatively the threshold of light-induced reconfiguration based on the mean-field theory
[40]. In this case, we take into account the surface free energy of the droplet-liquid interfacial
anchoring effect, which is defined as the multiplication of surface free energy per unit area (β)
and the phase boundary area [26]. Considering that the depth of focus of the near-infrared
laser beam is much smaller in the front of the droplet size, the total energy can be
approximately given by,
2 0 2 0 2 2 0 exp(-2 ) β αQI a dr r r r U a total ∝−
∫
+ (2.2)This equation indicates that the total energy is a function of the radius of the droplet
and laser power in terms of
a
and αQI0/β. We show in Figure 2.4(a) that the total energy shows a negative local minimum when αQI0/β is larger than 7.5, indicating clearly that whenthe laser powers is above such a threshold condition, the interaction energy of the LCs
26
interface, and thus, molecular reconfiguration can undergo throughout the inside of the
droplet [29]. To place the droplet-size dependence in context, with the criterion that the total
energy reaches a negative local minimum, in Figure 2.4(b) we show the
polarization-insensitive plot of αQI0/β as a function of
a
/ r
0, indicating two distinct regionsin the plane of parameters; where in the region above the graph, the optical trapping is
followed by molecular reconfiguration throughout the inside of the droplet. The slightly
higher threshold power for the circular polarized beam can be understood as a cause of
angular momentum transfer of the light inducing the rotation of the trapped droplet prior to
the reconfiguration. From the plot, it now became clear that a larger threshold power is
required for a larger droplet. The qualitative similarity between the tendency predicted by the
calculation and that in the experimental observation supports the relevance of the above
mentioned approximation.
Finally, for droplets with diameter much larger than the beam waist, in this case
>
a
1 μm, the predicted tendency shows a larger increase than that of the experimentalobservation. This fairly indicates that some parameters in Eqn. (2) may change drastically for
the droplets with
a
>>
r
0, resulting in such deviation from the experimental data. Thephysical reasons are yet unclear, though one may consider that Q is also a function of
droplet-size [38]. The other likely reason for the deviation is that optical reorientation of LCs
27
through dipolar interaction, which may reduce the threshold power. We recall that such
cooperative effects of smectic layers in the thin slab film results in a significant reduction of
the predicted critical electric field at which the OFT effect takes place [41]. Hence, further
28 (a)
(b)
Figure 2.4 (a) The total energy as a function of the radius of the droplet at different level of laser power. (b) Plot of the predicted dependence of threshold laser power density to induce a negative local minimum, which is related to the reconfiguration, as a function of droplet radius relative to the beam waist, based on Eqn. (2.2) (see text for details).
0.0
0.2
0.4
0.6
0.8
1.0
1.2
-0.05
0.00
0.05
0.10
T
ot
al
E
ner
gy
Relative Droplet Radius (a/r
0)
aQI
0/β=8
aQI
0/β=7
aQI
0/β=6
aQI
0/β=0
1
2
3
4
5
0
30
60
90
120
150
aQI
0/β
(
a.
u.
)
29
5. Summary
We have presented laser-induced reconfiguration of micrometer-sized radial
symmetric droplets of liquid crystal 5CB dispersed in D2O. The definite threshold laser power
to induce such reconfiguration depends on the droplet size and polarization state. The
tendency of the droplet size dependence can be qualitatively explained by considering that the
direct optical reorientation by laser beam is mostly distributed around the focal spot and that
the LC droplet is a self-organized structure with droplet-liquid interfacial layer controlling the
molecular orientation inside the droplet, rather than by conventional non-focused light
irradiations. Thus, the likely mechanism involves the optical reorientation (OFT effect) at the
focal volume and propagating out of the focal spot by cooperative effect. When the interaction
energy of the LCs realignment by the electric field overcomes the surface free energy of the
droplet-liquid interface, the radially symmetry of the radial symmetric structure is completely
broken, and ultimately leading to a reconfiguration throughout the inside of the confined
droplet. With this proposed mechanism, we show qualitatively that the calculated tendency of
30
6. References
[1] A. Ashkin, Phys. Rev. Lett. 24 (1970) 156.
[2] A. Ashkin, Proc. Natl. Acad. Sci. USA 94 (1997) 4853.
[3] A. Ashkin, J. M. Dziedzic, J. E. Bjorkholm, S. Chu, Opt. Lett. 11 (1986) 288.
[4] K. Sasaki, M. Koshioka, H. Misawa, N. Kitamura, H. Masuhara, Jpn. J. Appl. Phys. 30 (1991) L907.
[5] A. Ashkin, J. M. Dziedzic, T. Yamane, Nature 330 (1987) 769.
[6] P. Borowicz, J. Hotta, K. Sasaki, H. Masuhara, J. Phys. Chem. B 101 (1997) 5900. [7] J. Hofkens, J. Hotta, K. Sasaki, H. Masuhara, T. Taniguchi, T. Miyashita, J. Am. Chem.
Soc. 119 (1997) 2741.
[8] J. Hotta, K. Sasaki, H. Masuhara, J. Am. Chem. Soc. 118 (1996) 11968. [9] Y. Tanaka, H. Yoshikawa, H. Masuhara, J. Phys. Chem. B 110 (2006) 17906. [10] T. Sugiyama, T. Adachi, H. Masuhara, Chem. Lett. 36 (2007) 1480.
[11] Y. Tsuboi, T. Shoji, N. Kitamura, J. Phys. Chem. C 114 (2010) 5589. [12] T. Sugiyama, T. Adachi, H. Masuhara, Chem. Lett. 38 (2009) 482.
[13] T. Rungsimanon, K. Yuyama, T. Sugiyama, H. Masuhara, N. Tohnai, M. Miyata, J. Phys. Chem. Lett. 1 (2010) 599.
[14] T. Rungsimanon, K. Yuyama, T. Sugiyama, H. Masuhara, Cryst. Growth Des. 10 (2010) 4686.
[15] T. Uwada, T.Sugiyama, H. Masuhara, J. Photochem. Photobiol. A: Chemistry 221 (2011) 187.
[16] X. Sun, B. A. Garetz, M. F. Moreira, P. Palffy-Muhoray, Phys. Rev. E 79 (2009) 021701. [17] A. Usman, T. Uwada, H. Masuhara, J. Phys. Chem. C 115 (2011) 11906.
[18] S. Joudkazis, M. Shikata, T. Takahashi, S. Matsuo, H. Misawa, Appl. Phys. Lett. 74 (1999) 3627.
[19] S. Joudkazis, S. Matsuo, N. Murazawa, I. Hasegawa, H. Misawa, Appl. Phys. Lett. 82 (2003) 4657.
[20] T. A. Wood, H. F. Gleeson, M. R. Dickinson, A. J. Wright, Appl. Phys. Lett. 84 (2004) 4292.
[21] H. F. Gleeson, T. A. Wood, M. Dickinson, Phil. Trans. Royal Soc. A 364 (2006) 2789. [22] Y. Yang, P. D. Brimicombe, N. W. Roberts, M. R. Dickinson, M. Osipov, H. F. Gleeson,
Opt. Express 16 (2008) 6877.
[23] E. Brasselet, N. Murazawa, S. Joudkazis, H. Misawa, Phys. Rev. E 77 (2008) 041704. [24] E. Brasselet, S. J. Joudkazis, Nonlinear Opt. Phys. Mater. 18 (2009) 167.
[25] N. Murazawa, S. Joudkazis, H. Misawa, Eur. Phys. J. E 20 (2006) 435.
[26] P. G. de Gennes, J. Prost, The Physics of Liquid Crystals, 2nd ed.; Clarendon Press: Oxford, 1993.
31
[27] A. I. Bishop, T. A. Nieminen, N. R.; Heckenberg, Rubinsztein-Dunlop, H. Phys. Rev. Lett. 92 (2004) 198104.
[28] N. Murazawa, S. Joudkazis, V. Jarutis, Y. Tanamura, H. Misawa, Eur. Phys. Lett. 2006, 73, 800.
[29] A; Usman, W.-Y; Chiang, T; Uwada, H. Masuhara, Proc. SPIE 8274 (2012) 82740L1-8. [30] S. Joudkazis, N. Mukai, R. Wakaki, A. Yamaguchi, S. Matsuo, H. Misawa, Nature 408
(2000) 178.
[31]S. Ito, T. Sugiyama, N. Toitani, G. Katayama, H. Miyasaka, J. Phys. Chem. B, 111 (2007) 2365-2371.
[32] N. Murazawa, S. Joudkazis, S. Matsuo, H. Misawa, Small 1 (2005) 656. [33] N. Murazawa, S. Joudkazis, H. Misawa, Opt. Express 14 (2006) 2481.
[34] P. Palffy-Muhoray, The Nonlinear Optical Response of Liquid Crystals. In Liquid Crystals: Applications and Uses; Bahadur B., Ed., World Scientific, New Jersey, 1990. [35] I.-C. Khoo, S. T. Wu, Optics and Nonlinear Optics of Liquid Crystals; World Scientific:
Singapore, 1993.
[36] I.-C. Khoo, R. R. Michael, P. Y. Yan, IEEE J. Quantum Electron QE-23 (1987) 267. [37] E. Santamato, Y. R. Shen, Opt. Lett. 9 (1984) 564.
[38] A. Ashkin, Biophys. J. 61 (1992) 569.
[39] I. I. Smalyukh, S. Chernyshuk, B. I. Lev, A. B. Nych, U. Ognysta, V. G. Nazarenko, O. D. Lavrentovich, Phys. Rev. Lett. 93 (2004) 117801.
[40] S. A. Safran, Statistical Thermodynamics of Surfaces, Interfaces, and Membranes, Westview: Colorado, USA, 2003 (2003).
32
CHAPTER 3
Optical Trapping and Polarization-Controlled Scattering
of Dielectric Spherical Nanoparticles by Femtosecond
33
1. Introduction
One of the successful applications of mode-locked lasers is the ultrafast
time-resolved spectroscopies, which provide the absorption, vibrational, or emission spectra
of atoms or molecules on extremely short time scales after their excitation with ultrashort
laser pulses. The research group of Prof. M. Martin is one of pioneers who have utilized
transient absorption spectroscopy to decipher the dynamics and mechanisms of fundamental
photo-induced processes [1]. Their reports on the insights of driving forces and primary
occurring events in the photo-induced dynamics of various chromophores, photoactive
proteins, or biomimetics are important advances in our understanding of the photo-processes,
particularly the functionality of the biomaterials in relation with their electronic structures [2–
7].
Another important laser application is optical trapping (also called optical tweezers),
exploiting the optical gradient force, which can confine micrometer to a few tens nm-sized
objects in the focal spot [8,9]. In this phenomenon, a high numerical aperture lens is
necessarily required to focus tightly the continuous-wave (cw) laser beams into a
diffraction-limited spot size [10,11]. With its potential ability of non-destructive tool to
immobilize, reorient, and transfer the dielectric or metallic particles, this technique has been
widely applied in various fields of sciences with target materials ranging from small particles
34
become indispensable in single-molecule measurements [21,22].
Recently, the optical trapping technique is further developed by utilizing ultrashort
laser pulses. By the femtosecond laser pulses, optical trapping of micrometer-sized silica
spheres was found to be as just effective as cw optical tweezers, and trap stiffness was related
to average power of the laser pulses [23]. With the ultrashort laser pulses, however, several
phenomena have been revealed, including optical trapping of as small as a few nm-sized
CdTe quantum dots or the depositions of CdS nanoparticles with grain size down to 25 nm
[24,25]. For the trapping of gold nanoparticles by laser pulses, the trapping site splits up into
two equivalent positions around the focal center, demonstrating that high nonlinear optical
susceptibility of the target materials can modify the shapes of gradient force and trapping
potential [26]. More recently, the femtosecond laser pulses with the power less than 200 mW
has been successfully applied to confine an individual polystyrene bead with a diameter of a
few tens of microns (the particle sizes within the framework of geometrical optics regime),
but the microparticle was pushed away from the trapping site when the focal position was
shifted to its downstream surface due to secondary convergence of the laser pulses that
reduces water breakdown threshold [27].
In this article, we report on an experimental study exploring the trapping behavior
of the dielectric spherical nanoparticles (50-nm-diameter polystyrene beads), suspended in
35
lens. We show that as compared with the cw mode, the laser pulses can trap a larger number
of nanoparticles. In addition, the laser pulses induce nanoparticle flows out of the focal spot in
two opposite directions, in an alternating manner, controlled by the laser polarization. To
understand this phenomenon, we evaluate both radiation (gradient and scattering) and
temporal forces (the latter is also called pulse radiation force) by adopting Lorentz force of
fundamental Gaussian beam exerted on Rayleigh particles [10,28], and by applying scattering
cross section value of the nanoparticles obtained based on Mie theory [29]. We demonstrate
that the axial electric field produced by the high numerical aperture objective lens is
36
2. Experimental
2.1 Optical setup
To experimentally exemplify the trapping behavior of the nanoparticles by
femtosecond laser pulses, we developed an experimental setup based on an inverted
microscope (Olympus IX71), as shown in upper Figure 3.1. We used a 800-nm fundamental
mode of Ti:sapphire (Tsunami; Spectra Physics) laser beam, which can be operated in cw or
femtosecond-pulse mode, acting as the trapping beam. When it was operated in the pulse
mode, the pulse duration was compressed by a pair of prisms to be about 90 fs, and the
repetition rate was 80 MHz. The polarization direction of the laser beam was controlled by a
half-wave plate before the beam was collimated and expanded to ~5 mm in diameter by a pair
of positive lenses with focal length being 100 and 200 mm, respectively. The beam then was
focused through an objective lens (60×, NA = 0.90) at normal incidence into a sample cell,
which was placed on the sample stage of the microscope. The light power after the objective
lens was controlled in the range of 0.10–0.35 W. The beam waist, ω0, at the focal spot was
calculated to be 460 nm, equivalent to the calculated radius when the beam intensity of its
37
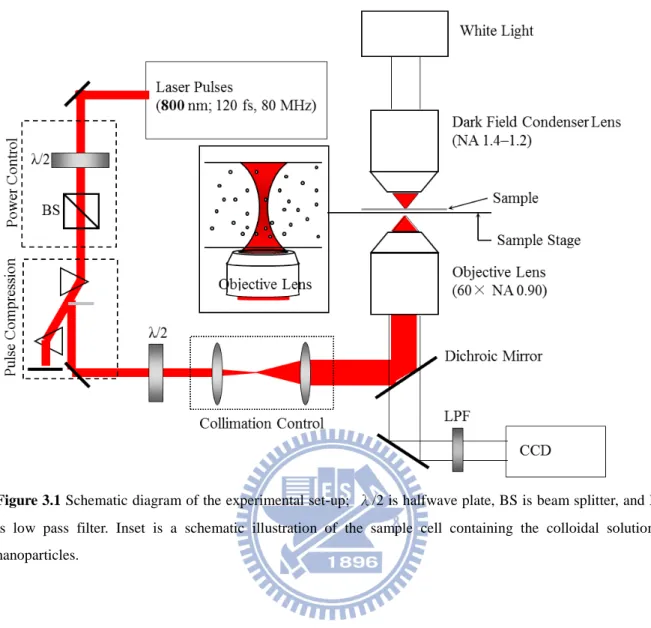
Figure 3.1 Schematic diagram of the experimental set-up; λ/2 is halfwave plate, BS is beam splitter, and LPF is low pass filter. Inset is a schematic illustration of the sample cell containing the colloidal solution of nanoparticles.
2.2 Sample cell and detection system
The sample cell consisted of a silicon chamber (1 mm thickness) sandwiched
between two cover-glass plates (Matsunami). The inner well of the chamber (10 mm in
diameter) was filled with colloidal solution containing spherical polystyrene beads
(PolyScience; radius = 25 nm, density = 1.06 g/cm3) suspended in distilled water (refractive
index = 1.33 at room temperature). Concentration of the polystyrene beads was 3.79 × 10¹⁴
38
calculated by Cauchy dispersion relation to be 1.59 [30].
The sample cell containing the dielectric spherical nanoparticles was illuminated by
white light (λ = 400–750 nm) from a halogen lamp passing through a cardioid immersion dark
field condenser lens (Olympus; U-DCW NA = 1.4–1.2). The elastic light scattering originated
from the laser trapping beam was completely cut by a shortwave-pass filter with transmission
at 380–720 nm (Semrock; Brightline 750/SP) in front of charge-coupled device (CCD)
camera (JAI; CV-A551R E). With such a setup only the scattering light from halogen lamp by
the nanoparticles was collected by the objective lens, and was detected by using the CCD
camera running at 30 interlaced frames per second. Thus, the detected light intensity can be
related mainly to the scattering light intensity, although there is possibly a very minor
contribution of three-photon excited fluorescence of the bare polystyrene beads due to
nonlinear optical effects if such the fluorescence wavelength is longer than 380 nm to pass the
shortwave-pass filter. The positions of the nanoparticles were associated with the image of the
scattering light detected by the CCD camera. The resolution of the image in the lateral
direction was 94 nm per pixel, and our observation layer was limited within the axial
39
3. Results
3.1 Polarization-controlled off-axis scattering of nanoparticles
With the laser trapping beam operated in the femtosecond pulse mode at the average
power of 350 mW, we observed a brighter scattering light at the focal spot compared with the
surrounding area. We should note that such bright scattering light was never observed in a
neat solvent. In addition to scattering light at the focal spot, bright locus of scattered polymer
beads, just like multiple shooting stars, from the focus spot to the surrounding area was also
observed. The bright locus was shaped like a partially opened folding fan along two opposite
directions, in an alternating manner, perpendicular to the polarization direction. Such the
event occurred randomly, and simultaneous bright locus along the two opposite directions like
a pair of two partially opened folding fans was never observed. Thus, we show the bright
locus along the two opposite directions by combining two halves of different video frames in
Figure 3.2(a)–(c). Since the scattering lights detected in the video image represent the
positions of the nanoparticles, we therefore extracted the profiles of scattering light intensity
passing through the focal center as shown in each panel. Such line profile parallel to the
polarization direction shows clearly a single sharp peak with an approximately 1.6 μm full
width at half maximum at the focal spot, whereas that perpendicular to the polarization
40
opposite directions in an alternating manner. The intensity of the bright locus is comparable to
each other. When the laser beam was operated in the cw mode at the same laser power, only a
tiny scattering light at the focal spot was observed under the similar experimental conditions,
but there were no any observable bright locus of scattered polymer beads from the beam
center to the surrounding area. An image frame under the cw-mode laser irradiation is shown
in Figure 3.2(d). The line profiles passing through the focal center parallel and perpendicular
to the polarization direction reveal that the scattering light at the laser focal spot of the cw
mode is very low.
By varying the laser power, the threshold of the femtosecond laser pulses to induce
observable scattering light at the focal point and bright locus along the two opposite directions
was observed at 264 mW for the highly concentrated nanoparticle solution. We also found
that the concentration of the nanoparticles was a crucial parameter to observe the bright locus.
Under the same optical conditions, the laser pulses at the average power of 350 mW, the
bright locus was not observed when the solution was diluted by a factor of 4, equivalent to the
concentration of 0.95×10¹⁴ particles/mL. The fourfold dilution led to severe reductions in the
trapping rate, size of trapped assembly, and number of scattered nanoparticles, giving no
41 (a) (b)
(b) (d)
Figure 3.2 A combination of two halves of two different image frames showing optical trapping and scattered polystyrene nanoparticles by femtosecond-pulse modes and showing their optical trapping by cw Ti:sapphire laser beams (λ= 800 nm). (a)-(c) A sharp scattering light at the focal spot and bright locus of scattered polymer beads from the focus spot to the surrounding area towards two opposite directions in an alternating manner perpendicular to the laser polarization direction of femtosecond laser pulses, indicating the optical trapping of polystyrene nanoparticles at the focal spot and nanoparticle flows along the two opposite directions. The laser power for each case is 350 mW after the objective lens. Arrow in each panel indicates polarization direction of the laser beam. The line profiles in each panel were taken from one cursor passing through the focal center to the opposite cursor, parallel and perpendicular to the polarization direction. The two line profiles (solid and dotted lines) perpendicular to the polarization direction are related to the two alternating directions of the scattering light. (d) An unstable and low scattering light intensity from the focal spot of cw laser beam at the same laser power. Arrow in the panel indicates polarization direction, and the line profiles were taken from parallel and perpendicular to the polarization direction.
42
3.2 Temporal evolutions of the bright spot at the focal spot
The temporal evolutions of scattering light intensity at the focal spot when the laser
beam was operated in femtosecond-pulse or cw mode are shown in Figure 3.3(a). In contrast
to high intensity of scattering light when the laser beam was operated in the pulse mode, low
intensity, unstable, and fluctuated scattering light intensity was observed under the cw mode.
In comparison, the scattering light intensity is about one order higher when the laser beam
was operated in the pulse mode than that under cw mode.
Further, in Figure 3.3(b) we show the plot of the temporal random distribution of
the event, where the bright locus was observed along one of the two alternating directions
perpendicular to the polarization of the femtosecond laser pulses, for the observation window
about 120 s. The bright locus emerged in one direction on the timescale of seconds before
they changed into the opposite direction, and they continued in the same way. The probability
and total duration of the bright locus along the two alternating directions almost balanced
43 (a)
(b)
Figure 3.3 (a) Time-dependent line profile intensity under femtosecond-pulse (black line) and cw mode (gray line). (b) The typical time-dependent event when bright locus of scattered polymer beads from the focus spot is along the two alternating left and right directions within the observation window of 120 s. Experimental information for data shown in the figures (a) and (b) are related to those in Figure 3.2a.
0 20 40 60 80 100 120 0 5 10 15 20 150 200 250 L ig h t S c a tt e ri n g I n te n s it y / a .u . Trapping Time/ s 0 40 80 120 T im e / s
Scattering Direction Probability 1 0
1
44
4. Discussion
4.1 Optical trapping and nanoparticle flows
Extracting the intensity of scattering light by line profile is one of useful practical
ways to identify the spatial position of nanoparticles in colloidal solution. Typically, a sharp
light intensity at the focal spot in the line profiles can be attributed to nanoparticles
accumulated by laser trapping, and the number of trapped nanoparticles is associated with the
light intensity [31]. Similarly, the existence of such single and sharp peak intensity from the
spherical polystyrene beads under the femtosecond laser pulses, as shown in Figure 3.2,
indicates the possible of a single trap site at the focal spot. Such a single trap site is commonly
observed in conventional optical trapping experiments [8] and [32], but it is in contrast to the
trap split of 60-nm sized gold nanoparticles by the femtosecond laser pulses on the same level
of average laser power [26]. It is noteworthy that since the third-order nonlinear optical
susceptibility is responsible and sensitive to split the trap site into two equivalent positions
shifted from the beam axis, the lower third-order susceptibility of polystyrene nanoparticles (0.8×10⁻⁸ esu) [33] as compared with that of gold nanoparticles (5×10⁻⁸ esu) [34] is the
reason for the polymer nanoparticles having no clear observable nonlinear optical effect on
the trap site.
Here, we interpret our experimental results as follows. When a nanoparticle enters
45
intensity of the highly focused ultrashort laser pulses is exerted on the nanoparticle, and the
force drags the nanoparticle towards the single trap site at the focal center. A stable trapping
can only be achieved when the gradient force overcomes scattering force, and the
characteristic stiffness of optical trap should be proportional to the laser intensity, as it has
been reported for the trapping laser in cw mode [21] and [35]. For the ultrashort optical pulses,
in particular, in addition to the gradient and scattering forces, we also have to consider
temporal force within the pulse duration, which is defined as instantaneous Lorentz force at
the time over the entire duration of the pulse envelope [36], [37] and [38]. In this case, the
gradient force of the laser pulses should overcomes the scattering and their temporal forces to
achieve a stable trapping. Considering the sizes of the nanoparticles and beam waist, multiple
nanoparticles can be trapped in the single potential minimum at the focal spot, and the
scattering light intensity is proportionally enhanced with the number of trapped nanoparticles
at the trap site. Thus, monitoring such the scattering light intensity, similarly to monitoring a
stepwise behavior of fluorescence intensity increase in optical trapping of 100- or
200-nm-sized dye-doped polystyrene nanoparticles by cw laser beam [39], would provide the
information on the number of nanoparticles entering the trap site. However, the video frames
in our experiment are saturated within the first integrating time, hindering a precise
observation on the exact number of the optically trapped nanoparticles. Nevertheless, based