國 立 交 通 大 學
資訊管理研究所
博 士 論 文
一個在
VANETs
中取得即時交通資訊的傳輸架構
A Novel Transmission Architecture for Real-Time Traffic
Information Acquisition in VANETs
研 究 生:張 栩 嘉
指導教授:羅 濟 群 教授
一個在 VANETs 中取得即時交通資訊的傳輸架構
A Novel Transmission Architecture for Real-Time Traffic
Information Acquisition in VANETs
研 究 生:張 栩 嘉
Student: Hsu-Chia Chang
指導教授:羅 濟 群
Advisor: Chi-Chun Lo
國 立 交 通 大 學
資訊管理研究所
博士論文
A Dissertation
Submitted to Institute of Information Management College of Management
National Chiao Tung University in Partial Fulfillment of the Requirements
for the Degree of Doctor of Philosophy
in
Information Management July 2012
Hsinchu, Taiwan, the Republic of China
I
一個在 VANETs 中取得即時交通資訊的傳輸架構
研究生:張栩嘉
指導教授:羅濟群 老師
國立交通大學資訊管理研究所
摘要
近年來智慧型運輸系統(Intelligent Transportation System, ITS)的發展已越來 越普遍。車載隨意網路(Vehicular Ad-hoc Networks, VANETs)逐漸成為 ITS 應用的 優選。VANETs 的通訊模式可分為:車輛與車輛間通訊(Vehicle-to-Vehicle,V2V) 和 車輛與路邊裝置間通訊 (Vehicle-to-Infrastructure, V2I)。V2V 網路具有車輛移動 迅速,網路拓樸快速改變,車間通訊範圍限制之特性,使得在動態的 VANET 環 境下要能相互傳送即時的交通資訊將倚賴車輛間彼此的通訊連線。本研究提出一 個在 VANETs 中能充分有效地傳送即時交通資訊的傳輸架構,此傳輸架構由三種 模式構成。第一個模式操作在 V2V 通訊環境下,車間的通訊距離在傳輸範圍內 時,將叢集為一群具共識的群集以利緊急事故訊息能快速有效地散播,改善廣播 風暴問題;第二個模式則使用 V2I 通訊的路邊裝置(Roadside Units, RSUs),蒐集行 動網路手機通訊中的訊號強度進行即時交通車速之估計,並置於雲端供用路人查 詢; 第三個模式是一個混合模式,V2V+V2I,它解決 V2V 車輛間資料傳送的範 圍限制,協同 V2I 模式建構傳輸即時交通資訊的連線。透過模擬與現有的廣播方 法比較,實驗結果顯示本研究提出的 V2V 模式和混合模式將可降低訊息傳送數 量與延遲時間,從而提升即時交通資訊的傳送效率和可靠度。此即時交通資訊的 傳輸架構將有助於 ITS 在車載通訊上取得與傳送即時交通資訊之運用。 關鍵字:車載隨意網路、資料散播、叢集化、行動網路、雲端運算
II
A Novel Transmission Architecture for Real-Time Traffic
Information Acquisition in VANETs
Student: Hsu-Chia Chang
Advisor: Dr. Chi-Chun Lo
Institute of Information Management
Nation Chiao Tung University
Abstract
In recent years, the development of intelligent transportation system (ITS) has become more and more popular. The vehicular ad-hoc networks (VANETs) are emerging as the preferred network design for ITS. The VANETs are based on short-range wireless communication between vehicles, which can be classified into two communication modes, vehicle-to-vehicle (V2V) and vehicle-to-infrastructure (V2I). V2V refers to the direct or multi-hop communications among vehicles. V2I refers to the communication with the infrastructure of roadside units (RSUs). V2V embrace high mobility of vehicles, rapid changing topology due to uneven distribution of vehicles and inter-vehicle transmission range. Therefore, in a dynamic VANET environment, the vehicle transmission’s reliability will affect the real-time traffic information dissemination in a consensual and effective way. In this thesis, we propose a transmission architecture in which real-time traffic information can be disseminated both adequately and effectively. There are three modes of operation in the proposed architecture. The first mode is operated under V2V where the vehicles are within the transmission range and proposed a consensus-based cluster protocol to disseminate real-time safety alert message to cluster members. The second mode is operated under V2I; the design of RSUs is responsible for obtaining cellular-network-based data to estimate speed information on cloud. The third mode, which is a hybrid approach, V2V+V2I, is operated via the coordination between V2I and V2V in disconnected condition, particularly. In accordance with the simulation results, we notice that, the performances of the proposed V2V mode and hybrid mode can downgrade the number of message dissemination and improve the broadcast storm problem. Therefore, the novel transmission architecture would be useful for acquiring and transmitting real-time traffic information between vehicular communications for ITS.
Keywords: Vehicular Ad-hoc Networks (VANETs), Data Dissemination, Clustering, Cellular network, Cloud Computing.
III
誌謝
本論文得以完成,我衷心地要感謝許多人給予我的鼓勵、支持和機會! 首先感謝我的指導教授-羅濟群老師於博士班的學習過程中悉心的指導並支 持我的研究主題,給予我充足的資源和明確的方向。期間得以窺見師者風範,習 得宏觀的思維、嚴謹的研究態度和樂觀正向的生活哲學,實則為更大的收穫。同 時感謝口試委員劉敦仁教授,楊建民教授,周世傑教授和陳昱仁教授於口試期間 費心指導,提供寶貴的建議,讓本篇論文內容得以更臻完善。 感謝最疼愛我與我最愛的家人,謝謝父母全力的支持,讓我無後顧之憂地完 成學業;謝謝仁豪貼心的相伴和鼓勵,總是為我分憂和設想,為我們的生活增添 歡樂和活力。 感謝 Netlab 的各位夥伴們。感謝俊傑學長、邦曄學長和婉佳學姊對後進的 照顧;感謝泊寰學長、斯寅學長和志華學弟研究協助和合作;感謝博士班同窗: 意鈞、輝哥和劉蓉的相互扶持;感謝歷屆的學弟妹:強哥、小牛、Andy、媛如等 於研究過程的支援;以及感謝其他未提及的實驗室成員。感謝淑惠在所務上的幫 忙和照顧;感謝交大土地公保佑我在新竹一切平安。 謹獻上最真誠的謝意,並與您們一同分享這個喜悅。 謝謝大家!IV
Table of Contents
摘要... I Abstract ... II 誌謝... III Table of Contents ... IV Figure Index ... VI Table Index ... VII Pesudo Code Index ... VIIIChapter 1 Introduction ... 1
1.1 Research Background and Motivation ... 1
1.2 Proposal Outline ... 3
Chapter 2 Literature Review ... 4
2.1 Vehicular Ad Hoc Networks (VANETs) ... 4
2.1.1 Broadcasting Algorithms ... 4
2.2 Distributed Computing Algorithms ... 10
2.3 Real-Time Traffic Information Based on Cellular Network ... 11
2.4 Massive Data Processing Based on Cloud Computing ... 12
2.4.1 MapReduce ... 13
2.4.2 Column-Based Data Model (CDM) ... 15
2.4.3 Modified Column-Based Data Model ... 15
Chapter 3 V2V Communications Model ... 18
3.1 Design Issues ... 18
3.2 Notations ... 18
3.3 Cluster Formation ... 19
3.3.1 The Finite State Machine... 20
3.3.2 Consensus-Based Cluster-Head Election Algorithm ... 23
Chapter 4 V2I Communications Model ... 38
4.1 Fingerprint Positioning Algorithm ... 39
4.2 Speed Estimation ... 40
4.3 Accelerative Processing in Cloud Computing ... 40
V
5.1 Design Issues ... 43
5.2 Hybrid Communications Model:V2V and V2I ... 44
5.3 Hybrid Message Dissemination Model ... 45
Chapter 6 Simulation Results and Analyses ... 49
6.1 Simulation Assumptions ... 50
6.2 Simulation Environment ... 50
6.3 Performance Metrics ... 52
6.4 Simulation Cases Design ... 52
6.5 Results and Analyses ... 53
6.6 The Performance of Cellular-based Traffic Data Estimation ... 56
Chapter 7 Conclusions and Future Work ... 58
VI
Figure Index
Figure 1: P-persistence broadcast [9] ...5
Figure 2: Slotted p-persistence broadcast [9] ...6
Figure 3: TLO broadcast [11] ...7
Figure 4: Group formation with geographic boundary [18] ...8
Figure 5: FSM example I [19] ...9
Figure 6: FSM example II [20] ...9
Figure 7: Original Bully Algorithm ...10
Figure 8: Mapreduce Execution overview [35] ...14
Figure 9: The storage format of CDM ...15
Figure 10: The storage format of the modified CDM ...16
Figure 11: The proposed FSM ...21
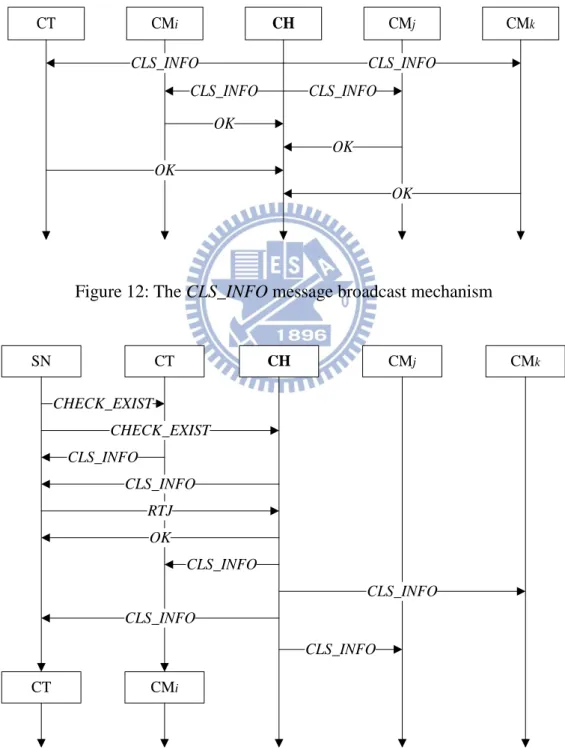
Figure 12: The CLS_INFO message broadcast mechanism ...22
Figure 13: The message delivery of SN joins a new cluster ...22
Figure 14: Detecting the CH is disconnect with the cluster ...25
Figure 15: The CHECK_EXIST message ...26
Figure 16: The OK message ...26
Figure 17: The GRANT message ...26
Figure 18: The message delivery of the cluster-head election algorithm ...27
Figure 19: The PROPOSAL message ...28
Figure 20: The ACCEPT message ...28
Figure 21: The COORDINATOR message ...28
Figure 22: The message delivery of the new leader announcing ...31
Figure 23:(a) A safety alert message is warming out and; (b) The alert message has transmitted to the CH. ...33
Figure 24:(a)The CH sends the message to the CT in cluster n; (b)The inter-cluster communication via CT ...34
Figure 25: The message dissemination process in V2V communications mode ...35
Figure 26: The traffic information system based on cellular network [42]...38
Figure 27: An overview of mapper and reducer function ...42
Figure 28: The hybrid communications model ...44
Figure 29: The message dissemination in hybrid mode ...45
Figure 30: Environment setting file for ns-3 simulator ...51
Figure 31: Total number of message dissemination ...53
Figure 32: Message collision ...54
Figure 33: The latency in message dissemination ...55
VII
Table Index
Table 1: Symbols ... 18 Table 2: Message Types ... 19 Table 3: Simulation parameters and their values ... 51 Table 4: The experiment results of location determination with different algorithms . 57
VIII
Pesudo Code Index
Pseudo Code 1: The cluster-head election process ... 29
Pseudo Code 2: The new CH announcing process ... 32
Pseudo Code 3: The message dissemination in V2V communications mode ... 35
1
Chapter 1 Introduction
1.1 Research Background and Motivation
Intelligent Transportation System (ITS) has been developed to monitor traffic information, to reduce car accident, and to improve their comfort degree [1]. Vehicular ad-hoc networks (VANETs) are emerging as the preferred network environment with the objectives of improving the road safety and traffic efficiency for ITS. VANETs are networks in which each node is a vehicle. Such systems aim to provide communications between individual vehicles and between vehicles and nearby fixed equipment, or roadside units. Vehicles can communicate with nearby vehicles known as a V2V communication and also with road side infrastructure known as V2I [2]. Features of VANET are high mobility of vehicles, vehicles move on predefined roads, no power constrains, and rapid topology changes. The goal of VANETs, and more broadly vehicular networks, is to improve traffic safety by providing timely information to drivers and concerned authorities. The VANETs technologies are based on short-range wireless communication between vehicles. The allocation of 75 MHz in the 5.9 GHz band that is licensed for dedicated short range communications (DSRC), which aimed at enhancing bandwidth and reducing latency for V2V and V2I communication[3]. Also, the authors analyzed the pros and cons of V2Vand V2I [4]. A hybrid approach is necessary to enhance the development of ITS.
In VANETs, broadcast is typically used to disseminate traffic-related information within a certain area. The roadside unit that broadcasts traffic information should periodically rebroadcast the message to keep it alive for as long as needed. As a result, a broadcast storm may arise if the traffic density on the road and the frequency at which the RSU broadcasts the message are high. The direct impact of a
2
broadcast storm in this case is waste of processing time and bandwidth, and increased medium access delay. However, a more serious impact of the broadcast storm is safety-related service disruption. For example, other urgent safety messages might get lost or delayed during a broadcast storm.
Data dissemination approach in VANETs are refers multi-hop communications among vehicles or store-carry-forward message in order to preserve the network connectivity [5],[6]. In push based data dissemination, the data can be efficiently delivered from moving vehicles or fixed base station (RSU) to another vehicles. Pull based data dissemination is the type where any vehicle is enabled to query information about specific location or target. This is one form of request and response model. The V2V dissemination is flooding. The flooding approach is good for delay sensitive application and also suitable for sparse networks during low traffic conditions. In this paper, focus on well-connected network, we consider the broadcast storm problem on major highways. The aspiration of our research is to propagate adequate and real-time traffic information to users in VANETs. The objectives of the proposed transmission architecture are as follow:
1. Disseminate real-time traffic information for safety alert with connected transmission range in V2V;
2. Consider the V2I schema, by integrating heterogeneous wireless technologies, obtaining cellular-network-based data [7] to estimated traffic speed for effective V2I communications;
3. Improve broadcast storm problem with well connected transmission in hybrid communications, V2V+V2I.
3
1.2 Proposal Outline
The remainder of this thesis proposal is structured as fellows. Chapter 2 contains the literature reviews which include the descriptions of VANETs, consensus-based election algorithms, cloud computing and its related technologies. Chapter 3 will depict the first mode of the proposed V2V communications model, which is operated with a design of consensus-based cluster algorithm to propagate messages. Chapter 4 will describe the second mode of the proposed V2I communications model, which adopts fingerprint position algorithm from the RSUs to estimate traffic speed based on cellular network data. Chapter 5 will present the third proposed hybrid communications model, V2V+V2I. The simulation results and analyses obtained in the message dissemination tests will be shown in Chapter 6. Finally, the conclusion and future works are presented in Chapter 7.
4
Chapter 2 Literature Review
VANETs are emerging as the preferred environment of propagating the road safety and real-time traffic data for ITS. In this chapter, several literatures related to VANETs communication technology, distributed algorithms, estimating traffic information from cellular network, and data processing based on cloud computing will be reviewed and discussed briefly.
2.1 Vehicular Ad Hoc Networks (VANETs)
VANET is a set of vehicles that communicate via short-range wireless technologies such as IEEE 802.11 and DSRC. Each vehicle participating in the VANET periodically produces reports regarding the traffic condition it is experiencing.
2.1.1 Broadcasting Algorithms
Several vehicular broadcasting algorithms in VANETs are in the following [8],[9],[10],[11],[12]:
(1) Simple broadcast
This is the simplest protocol used in V2V message dissemination for VANET. When there is an accident, safety alert message will be sent to all vehicles approaching towards accident site. When a vehicle receives a broadcast message for the first time, it retransmits the message. The vehicle then ignores all subsequent broadcast messages (with same ID) it receives, from other vehicles rebroadcasting the same message. There are two main problems in this simple broadcast method. First, there are a lot of redundant rebroadcast messages because of flooding. Thus, when a message reaches n hosts for the first time, n replications will be sent. Second, there is a high probability that a message will be received by many hosts located in a close
5
proximity. Every host will severely contend with one another for access to the medium, known as the "broadcast storming".
(2) P-persistence
This method tries to reduce broadcast storm problem by using a stochastic selection method to decide the vehicle that will rebroadcast the alert message. When a vehicle receives a broadcast message for the first time, the vehicle will rebroadcast the alert message with a random probability p (Figure 1). This method will help to reduce the number of rebroadcasting vehicles and thereby broadcast storming problem. However, all nodes that receive broadcast message decide not to rebroadcast which will cause the loss of alert messages.
Figure 1: P-persistence broadcast [9] (3) Slotted p-persistence
This is an improvement over p-persistence protocol. Upon receiving a packet, a node checks the packet ID and rebroadcasts with a pre-determined probability p at the assigned time slotTsij, if it receives the packet for the first time and has not received any duplicates before its assigned wait time slot expires. Otherwise, it discards the packet. As shown in Figure 2, each node in this scheme also buffers the message for a certain period of time T ([Ns - 1] × WAIT TIMEE + δ ms), and retransmits with probability 1 to prevent message “die out”. The performance of the slotted p-persistence depends on the value chosen for the re-forwarding probability p.
6
Figure 2: Slotted p-persistence broadcast [9] (4) TLO [11]
When there is an accident, the victimized vehicle broadcast an alert message. Vehicles that receive the alert message do not rebroadcast it immediately. They will use TLO (The last one) algorithm to find the last vehicle i.e. the one furthest from the place of accident. That particular vehicle will rebroadcast the message while the other vehicles will wait for a threshold time interval to take a decision about rebroadcast. Only the node, which is designated by TLO as the furthest node (and all nodes are aware of it), will rebroadcast the alert message. When the threshold waiting time interval expires, and other nodes do not receive the same alert message again (which is supposed to come from the furthest node), there is a problem in rebroadcasting. TLO runs again to find the next candidate as last node, which then broadcast the alert message. This is repeated until a successful rebroadcast is done. As shown in Figure 3, vehicle A receives an accident event and sends alert messages to the following vehicles which are in alert message range. They will start TLO algorithm to choose the furthest vehicle which would rebroadcast it. In this case the vehicle B, E and G (in order) are chosen to rebroadcast alert messages to the following nodes.
7
Figure 3: TLO broadcast [11] (5) APAL [12]
Adaptive Probability Alert Protocol (APAL) does not need location information of the vehicle. The probability of alert message broadcast is adaptively set such that broadcast problem is minimized. There are 4 steps in APAL to let the received node to retransmit the message adaptively.
Step 1: If a node receives an alert message for the first time, it will wait for a random time interval Δt1 which is decided with uniform random probability from a
fixed interval which is set depending on traffic density.
Step 2: Every time an interval for a vehicle expires, in case the vehicle receives duplicate alert message during this Δt1 time interval, i.e., one or more of its neighbors
have already rebroadcasted it, the vehicle will refrain from broadcasting it again. Step 3: When the interval expires and the node does not receive any duplicate message, the vehicle will rebroadcast it with a high probability Pi.
Step 4: Set a life time number and maximum number of message duplicated number for message handler. The adaptive probability and interval is adopted to actuate rebroadcast message. It could achieve best quality of performance compared to all other existing VANET protocols for safety alert message dissemination. With adaptive broadcast mechanism, the message dissemination flow still has redundant problem.
8
2.1.2 Clustering/Group
In VANETs, [13]-[17] proposed clusters/groups to provide basis constructions for V2V communications reliability. Several research point out aggregating clusters/groups to increase the anonymity of V2I communications. The clusters/groups communications are automatically determined by vehicle's positions with overlapping groups. Figure 4 displays the group design philosophy [18]. The group leader is located in the center and the geographic group is predetermined with group boundary. However, the formation is not tally with the features of VANETs.
Figure 4: Group formation with geographic boundary [18]
A finite state machine (FSM) is employed to describe how the clusters are operated by state transitions. In [19], the authors present their clustering protocol in Figure 5. There are four states to explain each vehicle enables the proposed clustering protocol and each cluster is organized with three roles: cluster-head, quasi-cluster-head and cluster member.
Inter-cluster control (ICC), Inter-Cluster Data (ICD), cluster range control (CRC), and cluster range data (CRD) are the DSRC channels for the vehicle
9
communications. In addition, each vehicle is equipped with two set of transceivers, T1 and T2.
Figure 5:FSM example I [19]
Figure 6 shows the proposed FSM in[20], each cluster is organized with three roles: cluster-head(CH), cluster-tail(CT) and cluster members(CM); there are five conditions for state transitions: initial state, CH contention, CT designation, join contention and losing contact with CH.
10
2.2 Distributed Computing Algorithms
In a distributed system, leader election is a very important issue. A leader is responsible of making sure the synchronization, consistency, sequencing and load balance between peers. Many algorithms have been presented for electing leader in distributed systems on networks, such as AUDITOR [21], Bully [22] and Ring [23].
In AUDITOR, each node contains an “auditor” and there is an ordered ranking of auditors. The highest-ranking auditor selects “audit coordinator” which is responsible for detection of failures. The drawback of AUDITOR algorithm is that when multiple nodes are crashed, it may take many sequential executions of the promotion protocol before a candidate is successful in reaching coordinator rank.
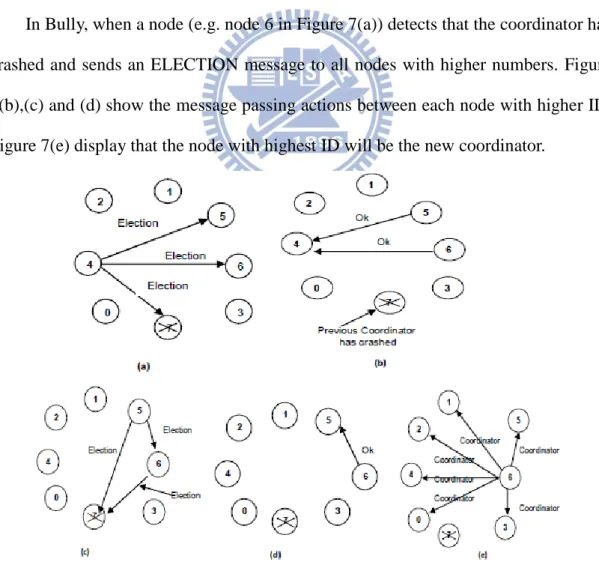
In Bully, when a node (e.g. node 6 in Figure 7(a)) detects that the coordinator has crashed and sends an ELECTION message to all nodes with higher numbers. Figure 7(b),(c) and (d) show the message passing actions between each node with higher ID. Figure 7(e) display that the node with highest ID will be the new coordinator.
11
The advantage of Bully algorithm is its simplicity, but the main drawback is the high number of message passing. The Big O of Bully algorithm is O(n2) that
increases heavy traffic on the network. Many researches proposed modified Bully algorithms to reduce the number of message passing without discussing the priority definition and consensus in their election process [24],[25],[26].
Paxos[27],[28] is a consensus algorithm for implementing a fault-tolerant distributed system. It is one of the most efficient practical algorithms for achieving consensus in a message-passing algorithm with failure detection mechanisms that allow nodes to exchange messages and maintain information consistency. Paxos describes the actions of the processes by their roles in the protocol: client, acceptor, proposer, learner, and leader. In[29], the leader election algorithm is designed by modifying Bully and Paxos to reach consensus and reduce the number of message passing.
2.3 Real-Time Traffic Information Based on Cellular Network
Real-time traffic information, such as average vehicle speed, travel time, traffic flow, traffic accidents, and other information, can then be referenced by road users and the ministry of transportation to improve the level of service for roadway. At present, the approaches of collecting real-time traffic information can be categorized into three groups:
(1) Stationary Vehicle Detector (VD).
(2) Global Position System (GPS)-based probe cars reporting. (3) Cellular Floating Vehicle Data (CFVD).
Traffic information has traditionally been gathered by public agencies (Departments of Transportation) via stationary VDs installed in the roadways to detect
12
the average vehicle speed and traffic flow. However, it is quite costly to install and maintain such devices. In addition, the VDs are easily inflicted by temperature fluctuation, moist, and other factors. So they need to be maintained on a seasonal or annually basis.
Alternatively, traffic information can be collected from travelling vehicles equipped with GPS receivers and wireless communication capability as probes on the road network. The GPS-equipped probe cars transmit their positions and speeds to a traffic information center periodically. However, the penetration rate of GPS-based probe cars needs to be high enough to infer more accurate real-time traffic information. In addition, there is extra transmission cost incurred when probe cars send back data through the air periodically. Therefore, the emerging technology, CFVD, which collects and detects the real-time traffic information by tracking the location of Mobile Stations (MSs) through cellular network signaling (e.g. handover (HO) and Call Arrival (CA)) becomes more and more popular for ITS. For example, ITIS Holdings applied the patented CFVD technology for measuring and forecasting real-time traffic information based on anonymously sampling the positions of MSs [30]. As the number of people owning cell phone has increased, it would feasible to use MS as a probe for obtaining traffic information.
2.4 Massive Data Processing Based on Cloud Computing
Cloud computing supports virtualization, on-demand services, scalable flexibility, hardware and software scalability, automatic adaptation, pay-per-use, and service level agreements, among other features[31],[32]. Cloud computing, which is comprised of Software as a Service (SaaS), Platform as a Service (PaaS) and Infrastructure as a Service (IaaS)[33]. Many computer scientists are predicting that Internet models will move toward a mix of cloud and client-based approaches to meet
13
the growing demand for data-intensive applications [34]. The MapReduce model is an example for data-intensive computing.
2.4.1 MapReduce
MapReduce [35],[36] is an emerging programming model for large-scale data-parallel applications such as web indexing and data mining. The Map functions and Reduce functions are both defined with key/value pairs. The Map functions are distributed across multiple machines by partitioning the input data into a set of M splits automatically. The Reduce invocations are distributed by partitioning the intermediate key space into R pieces using a partitioning function (e.g., hash (key) mod R). Figure 8 shows the overall flow of a MapReduce operation [35].
(1) The MapReduce library in user program shards the input files into M pieces and starts up many copies of the program on a cluster of machines.
(2) The master assigns each worker one a map task or a reduce task. There are M map tasks and R reduce tasks to assign.
(3) The Map function takes an input pair and produces a set of intermediate key/value pairs.
(4) The buffered pairs are written to local disk periodically. In addition, the master is responsible for forwarding the locations of buffered pairs on the local disk to the reduce workers.
(5) The reduce worker read the buffered data from the local disks of the map workers by remote procedure calls. When a reduce worker has read all intermediate data and sorted by the intermediate keys so that all occurrences of the same key are grouped together.
14
(6) The reduce worker iterates over the sorted intermediate data and for each unique intermediate key encountered. The key and the corresponding set of intermediate values are passed to the user's Reduce function.
Figure 8: Mapreduce Execution overview [35]
When all map tasks and reduce tasks have been completed, the master wakes up the user program. The output of the MapReduce execution is available in the R output files.
For massive data processing, Google File System (GFS) [37], is a scalable distributed file system for large distributed data-intensive applications. Hadoop is an open-source software project which implements a distributed data processing scheduling and execution environment and framework for MapReduce jobs. Hadoop includes a distributed file system called Hadoop Distributed File System (HDFS)[38] which is analogous to GFS in the Google MapReduce implementation.
15
2.4.2 Column-Based Data Model (CDM)
Column-Based Data Model (CDM) is a data query model operating on petabytes-level data and can response in seconds. The ideas behind CDM are columnar data layout so query tasks can be executed in place to reduce the execution time. CDM is often used to analyze the outputs of Mapreduce pipelines and prototype larger computations [39]. To maintain the sequences of the data, CDM keeps each NULL in its nested data format. Figure 9 displays the storage format of CDM, it will waste a lot of spaces to record NULLs potentially. To solve this problem, we propose a modified CDM to mitigate it and provide a numeric analysis.
l1 l2 l3 lm-1 lm 1 2 3 m-1 m 80 1 1 r null r2 1 100 3 1 r null rm1 1 60 1 m r 70 1 2 r 90 2 2 r null r3 2 75 1 2 m r null rm 2 null r31 null r32 85 3 3 r 95 1 3 m r null rm 3 n null rn 3 null rm n 1 90 m n r null rn 1 100 2 n r m ID L l1 l2 l3 lm-1 lm 80 1 1 r null r12 100 3 1 r null rm1 1 60 1 m r 70 1 2 r 90 2 2 r null r23 75 1 2 m r null rm 2 null r1 3 null r2 3 85 3 3 r 95 1 3 m r null r3m null rn 3 null rm n 1 90 m n r null rn 1 100 2 n r
column 1 column 2 column 3 ‧‧‧ column n
n m ‧‧‧ ‧‧‧ ‧‧‧ ‧‧‧ ‧‧‧ ‧‧‧ ‧‧‧ ‧‧‧ ‧‧‧ ‧‧‧ ‧‧‧ ‧‧‧ ‧‧‧
Figure 9: The storage format of CDM
2.4.3 Modified Column-Based Data Model
The modified CDM [40], gives consideration to the storage capacity and search efficiency problems. The storage format of modified CDM is adding ID entity and divided into each column file without the null value as shown in Figure 10.
16 l1 l2 l3 lm-1 lm 1 2 3 m-1 m 80 1 1 r null r2 1 100 3 1 r null rm1 1 60 1 m r 70 1 2 r 90 2 2 r null r3 2 75 1 2 m r null rm 2 null r1 3 null r32 85 3 3 r 95 1 3 m r null r3m n null rn 3 null rm n 1 90 m n r null rn 1 100 2 n r m ID L l1 l2 l3 lm-1 lm 80 1 1 r 100 3 1 r 60 1 m r n ‧‧‧ ‧‧‧ ‧‧‧ ‧‧‧ ‧‧‧ ‧‧‧ ‧‧‧ ‧‧‧ ‧‧‧ 1 3 m ‧‧‧ ID RSS L s1 2 m ‧‧‧ ID RSS sn 100 2 n r ‧‧‧ 90 m n r ‧‧‧ column 1 column n
Figure 10:The storage format of the modified CDM
The complexity analysis of CDM and modified CDM are discussed as follows.
Space Complexity: The space complexity of CDM is O(nm). The modified CDM only stores the non-null value and the ID entity so the space in j-th column file takes2sjshown as Eq. (2.1). The space complexity of the modified CDM is
n j sj
O
1
2 which is very small and less than the space complexity of CDM in sparse
matrices.
0,otherwise 1, where , 1 null c c c s i j i j m i i j j (2.1) Time Complexity: Searching a non-null value in the j-th column file, the computation time of CDM and modified CDM are expressed as O(m)andO(sj),
wheresj m. For reassembling the row values in the other column files, CDM can get these values by using the index of the column file, but the modified CDM can use binary search to get these values with the computation time O(g) shown as Eq. (2.2).
17
Therefore, the time complexities of CDM and modified CDM areO(m1)and
) (s g
O j , respectively. The time complexity O(sj g) is less thanO(m1)in sparse matrices.
b n b s g 2 1 log max arg (2.2) In this paper, we will adopt cloud computing technology to improve the performance of massive data processing. The execution of the modified CDM with MapReduce program is to solve the space-wasting and time-wasting problems of massive data processing.18
Chapter 3 V2V Communications Model
There are three modes of operation in our traffic information transmission architecture. In this Chapter, we will present the first mode: V2V communications model. The design issues are released in Section 3.1. The symbols and messages are defined in Section 3.2. The consensus-based cluster-head election algorithm will be illustrated in Section 3.3. Finally, the V2V message dissemination model will be presented in Section 3.4.
3.1 Design Issues
Vehicular clusters/groups provide basis for V2V communications in VANETs. For construction a reliable and practical V2V communication, it is vital to transmit and maintain information with consistency. Several research point out that clustering is an efficient technique to reduce the data congestion and keep message effective in dynamical environments. Therefore, we will depict a V2V transmission model based on clusters in a V2V communications environment.
3.2 Notations
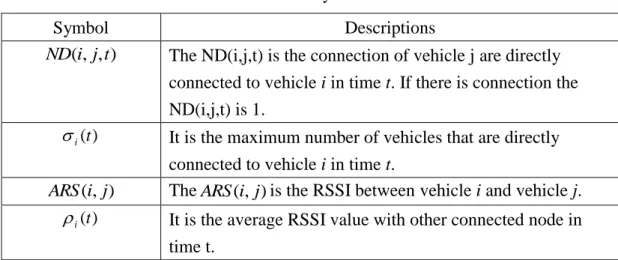
Table 1 shows the symbols for message dissemination model. Table 1: Symbols Symbol Descriptions ) , , (i j t
ND The ND(i,j,t) is the connection of vehicle j are directly connected to vehicle i in time t. If there is connection the ND(i,j,t) is 1.
) (t
i
It is the maximum number of vehicles that are directly connected to vehicle i in time t.
) , ( ji
ARS TheARS( ji, )is the RSSI between vehicle i and vehicle j.
) (t
i
It is the average RSSI value with other connected node in time t.
19
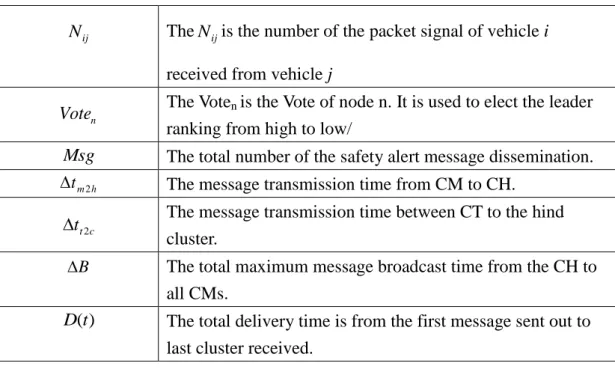
ij
N TheNijis the number of the packet signal of vehicle i received from vehicle j
n
Vote The Voten is the Vote of node n. It is used to elect the leader
ranking from high to low/
Msg The total number of the safety alert message dissemination.
h m
t 2
The message transmission time from CM to CH.
c t
t2
The message transmission time between CT to the hind
cluster.
B
The total maximum message broadcast time from the CH to all CMs.
( )
D t The total delivery time is from the first message sent out to last cluster received.
Table 2 shows the message for cluster-head election algorithm. Table 2: Message Types
Message Descriptions
RTJ Request to join an existing cluster
CLS_INFO Cluster information. the CT node is also defined in here
CEHCK_EXIST CM will send the message to check the existence of CH
ELECTION The QCM think the CH is exited, QCM will send out ELECTION to start leader election
OK The node who receive ELECTION will reply OK with Vote
GRANT The message will send to the node with highest Vote
PROPOSAL The new CH will use this message to notify CMs the new CH candidate is elected.
ACCEPT The CM receive PROPOSAL will reply ACCEPT to it.
COORDINATOR When new CH candidate receive more than half, it will send out COORDINATOR to CMs
ELECTION_STOP When CM find the CH is still exist, it will send
ELECTION_STOP to cancel the leader election process
3.3 Cluster Formation
The process of choosing a cluster-head from the cluster of all members is known as a cluster-head election. We proposed a consensus-based cluster-head election
20
algorithm to elect a leader as cluster-head to maintain and disseminate real-time traffic information to other member vehicles and clusters, which will be introduced in Section 3.3.2
3.3.1 The Finite State Machine
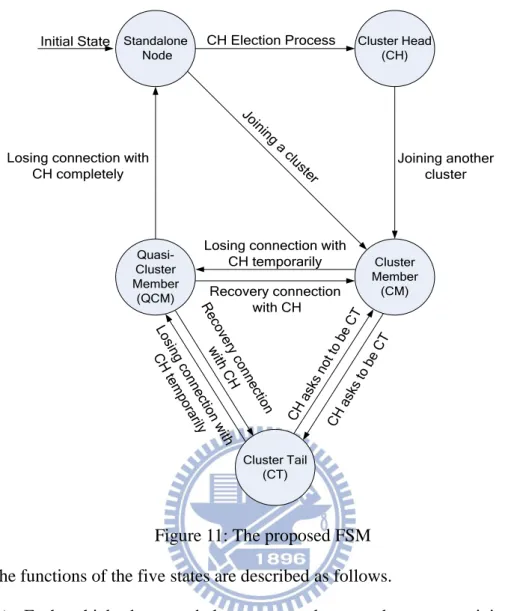
In V2V communication, the proposed finite-state machine (FSM) expresses the vehicle states and describes the operating process of our proposed scheme as shown in Figure 11. Each vehicle operates under one and only one of the following five states at any given time:
(1)Standalone Node (SN), (2)Cluster-Head (CH), (3)Cluster-Member (CM), (4)Cluster-Tail (CT), and
21 Initial State Cluster Member (CM) Standalone
Node Cluster Head(CH)
CH Election Process Joining another cluster Join ing a clus ter
Losing connection with CH temporarily Recovery connection
with CH Losing connection with
CH completely Quasi-Cluster Member (QCM) Cluster Tail (CT) CH ask s to be CT CH a sks not t o be CT Lo sin g c on ne ctio n w ith C H tem pora rily R ec ov ery co nn ec tion w ith C H
Figure 11: The proposed FSM The functions of the five states are described as follows.
(1) Each vehicle does not belong to any cluster and prepare to join a cluster called Standalone Node (SN). The SN will send CEHCK_EXIST message to find if there has an existing cluster with Cluster Head (CH). The CH and the CMs which received the CHECK_EXIST message will reply CLS_INFO message to the SN.
(2) When a SN received the respondent CLS_INFO message, SN will send RTJ (Request to Join) message to join the cluster. The RTJ message includes a value called
Vote . The Vote is defined in Section 3.1.2 for cluster-head election. While the SN
joins the cluster successfully, it would enter the CM state.
(3) If SN does not receive CLS_INFO message, the SN will send out
ELECTION message to start a cluster-head election process. The SN who is elected to
22
messages, including the CLS_INFO message dissemination in time t periodically and the Cluster Tail (CT) assignment of the cluster. Every CM receives the CLS_INFO message will reply an OK message (Figure 12) that included the updated Vote and self-traffic information to the CH. The message delivery of our proposed join process is shown as Figure 13. CMi CH CMj CMk CT CLS_INFO CLS_INFO CLS_INFO CLS_INFO OK OK OK OK
Figure 12: The CLS_INFO message broadcast mechanism
CT CH CMj CMk SN CLS_INFO OK CHECK_EXIST CHECK_EXIST CLS_INFO CLS_INFO RTJ CLS_INFO CLS_INFO CMi CT CLS_INFO
23
(4) The CT who is in the rear-end of the cluster and responsible for transferring messages inter-cluster. When the CT receives the broadcast messages from other neighboring clusters, it will send out its keeping messages to them.
(5) When a CM or CT misses the CLS_INFO messages over 3 time periods, it will enter the QCM state and send out a CHECK_EXIST message to its cluster. There will be waiting for 3 time periods and resending in very period to check the state of the CH. When the CH receives the CHECK_EXIST message, it will reply the
CLS_INFO message to the sender to recover its CM state. If the QCM waits over 3
time periods, it will start a new cluster-head election process to reconstruct the CH role.
3.3.2 Consensus-Based Cluster-Head Election Algorithm
Cluster-head election is an influential problem for clustering in VANETs. A cluster-head plays an important role in coordinating and maintaining the cluster. Therefore, we proposed a consensus-based cluster-head election algorithm which is based on Bully [22] and Paxos [27],[28] algorithms. The proposed algorithm guarantees to reach consensus, fault-tolerant and reduce the number of message passing in the cluster-head election process. The proposed consensus-based cluster-head election algorithm has the following three steps:
1. Calculating the cluster-head election criteria; 2. Cluster-head election algorithm
3. New cluster-head announcing
3.3.2.1 Cluster-Head Election Criteria
In the Bully algorithm, the identity number (ID), will be the weight of each node in the election process which is generated by the system. For this reason, we generate a new ID method by node degree and signal strength as the cluster-head election
24
criteria. We propose node degree and signal strength to compute a specific ID that will be used as Vote in the cluster-head election process. The highest voted node will be
elected as the CH.
Node Degree (ND): The overall node degree is the maximum number of vehicles that are directly connected to vehicle i in time t. It expresses asi(t)
and defined as Eq. (3.1).
j i(t) ND i, j,t (3.1)Where j is a potential neighboring vehicle. TheND(i,j,t)is equal to 1 if a connection between i and j exists at time t, and is equal to 0 otherwise.
We use node degree as a benefit criterion in order to make the CH with most connectivity in the cluster. V2V refers to the direct or multi-hop communications among vehicles. So every vehicle has more connected node degree would have less packet loss and better radio coverage. Therefore, the CH will be with the highest node degree to have less maintained cost when it is elected.
Average RSSI: The Receive Signal Strength Indicator (RSSI)[41] is the value of the received packet signal. The CH with higher average RSSI will have less chance to lose the connection with other CMs. It expresses as i(t)and
defined as Eq.(3.2)
ij j n i N j i ARS t
, ) ( (3.2) Where j is the neighboring vehicle that sends package to vehicle i. TheARS( ji, )is the RSSI between vehicle i and vehicle j. TheNijis the number of the packet signal of vehicle i received from vehicle j.
Every SN received ELECTION message would reply the Vote in OK message to the finder, who is the first detector finding the CH is disconnected. The Vote of
25
vehicle n is calculated as Eq.(3.3):
) (
1(n) t
Voten i (3.3) The Vote ranking also represents the priority in the cluster. With the highest n Vote in the cluster-head election process, the SN/QCM/CM will be elected as the
CH.
3.3.2.2 Cluster-Head Election Algorithm
The proposed consensus-based cluster-head election algorithm is depicted as follows. When a QCM detects the CH has left its cluster or joined to other cluster, it will send out the ELECTION messages to the higher priority CMs and start the cluster-head election process as shown in Figure 14. The scenario shows that the CM3 is the finder who detects the CH has left the cluster and sends out ELECTION messages to superiors (CM4-CM6) immediately. When every superior CM receives the ELECTION message will also send CHECK_EXIST message to make sure the existence of the CH (Figure 15).
26
Figure 15: The CHECK_EXIST message
After waiting a period time without any response from the CH, all of received
ELECTION message CMs will reply OK message to the QCM (Figure 16). As
receiving the OK messages from the superior CMs, the QCM is responsible for sending the GRANT message to the superior CM whose priority number is the highest at present (Figure 17). The message delivery process of the cluster-head election algorithm is shown in Figure 18.
Figure 16: The OK message
27 CT CH CM3 CM4 CHECK_EXIST CLS_INFO CLS_INFO CLS_INFO CHECK_EXIST CHECK_EXIST CM5 CHECK_EXIST CHECK_EXIST QCM CM6 CLS_INFO CLS_INFO CHECK_EXIST OK OK OK GRANT New CH ELECTION ELECTION ELECTION
Figure 18: The message delivery of the cluster-head election algorithm Figure 19 shows the granted CH (CM6) broadcasts the PROPOSAL message to remaining CMs in the cluster. Every CM receives the PROPOSAL message has to reply ACCEPT message to recognize the new CH (Figure 20) When more than half remaining CMs reply the ACCEPT messages to the new CH, it will broadcast the
28
Figure 19: The PROPOSAL message
Figure 20: The ACCEPT message
29
The pseudo code of the cluster-head election process is presented as Pseudo Code 1.
Pseudo Code 1: The cluster-head election process
There are two possible cases may occur during the cluster-head election process. The detail descriptions are as follow.
(1) The CH is still alive when one SN/QCM starts cluster-head election process When a CM changes its state to the QCM state, or a QCM changes its state to the SN state, it sends the ELECTION message to the SNs/CMs with higher priority number. In VANETs, the package lost or radio coverage might affect the connection between the CH and CMs. When a CM/QCM receives the ELECTION message, it will send CHECK_EXIST message to the CH. If the CH is connecting, the OK message will be sent to the sender. When the node receives OK message from CH, it will send an ELECTION_STOP message to the QCM which starts group reelection protocol. Once the node gets an ELECTION_STOP message, it will recover from the CM state.
If the CH is indeed left, all the nodes received the ELETCION messages will reply OK messages to the finder node. The CM replied OK message will change to be
A node finds that cluster-head is crashed Start the cluster-head election process New CH_ is null
For each node in the network/system Send out ELECTION
Wait for nodes reply For each reply in the group {
Get the highest priority and set node to be New_CH; }
Send the GRANT to the New_CH
30
SN and send out ELECTION message to the QCM. The QCM will wait for 3 average times to grant the highest priority one to start the CH announcing protocol. Because the node received the ELECTION message will send out a CHECK_EXIST message and wait for an average time. The QCM wait for 3 average times is more reliable way to send the GRANT message. The SN had replied the OK message to the QCM and will wait for a GRANT message. When it receives the GRANT message, it will start a consensus CH announcing protocol. In VANETs, the consensus will be achieved and reduce many maintain cost in this unreliable environment.
(2) More than one CM detects the CH has left
When more than one CM changes its state to QCMs, they will send the
ELECTION message to the node with higher priority. If a QCM sends out ELECTION
message and receive the ELECTION message from other nodes at the same time. The higher priority QCM will send ELECTION_STOP message to ask the lower priority one to stop cluster-head election process. The node received the ELECTION_STOP message will stop the cluster-head election protocol immediately.
31
3.3.2.3 CH Announcing Process
When a SN received the GRANT message will be the nwe CH. The CH is going to be the proposer. The proposer will send its new proposal and announce that he is going to be the CH in this cluster. All the rest SNs will be an acceptor and wait for the
PROPOSAL message. The acceptors agree the proposal and reply to proposer. When
more than half nodes in the group reply to proposer, the proposer will make announce to all the nodes to be the CH. After the announce sending, the cluster-head election protocol is done. The message delivery of the new leader announcing is shown in Figure 22. CM4 CM3 CM5 New CH CT PROPOSAL PROPOSAL PROPOSAL ACCEPT ACCEPT ACCEPT ACCEPT COORDINATOR COORDINATOR COORDINATOR CLS_INFO CLS_INFO CLS_INFO CLS_INFO PROPOSAL COORDINATOR
Figure 22: The message delivery of the new leader announcing
When more than one node send out the PROPOSAL messages at the same process time, each acceptor will accept the PROPOSAL message with higher priority
32
number than itself. For example, one acceptor receives a PROPOSAL message with priority 6. It will reply an ACCEPT message to the proposer. In the meantime, it receives another PROPOSAL message with priority 5. The acceptor will reply a message to sender with priority 5 and say: " There is a SN to be the CH. His priority is higher than you, please stop sending the message." Moreover, the acceptor receives the other PROPOSAL message with higher priority 8, it will accept the PROPOSAL message and send a message with priority 7 to sender to stop the CH announcing.
The Pesudo Code 2 shows the new CH announcing process:
Pseudo Code 2: The new CH announcing process Receive PROPOSAL:
If( Current_Proposal is null)
Reply APPROVE message and set Current_Proposal as sender; Else
{
If(Current_Proposal is higher than sender)
Reply DENY message to sender with the Current_Proposal; Else
{
Reply APPROVE message to sender; Reply DENY message to Current_Proposal; Set Current_Proposal to be sender;
} } Receive ACCEPT: Increase TOTOAL_ACCEPT_NUMBER; If(TOTOAL_ACCEPT_NUMBER > (TOTAL_MEMBER_NUMBER/2)) {
For each node in the network/system; Send the COORINDATOR message; }
Else
33
3.4 V2V Message Dissemination
There are two main working roles, the CH and the CT, in our proposed V2V message dissemination model. The CH is responsible for broadcasting messages to CMs and choosing a CT at the tail of the cluster. The information of which the node is chosen to be CT is included in CLS_INFO message. When the CT receives a message from the CH, it is responsible transferring messages to the back cluster if it receives a broadcasting message from the front cluster. The real-time traffic information, which includes traffic speed, traffic flow, traffic density, traffic accidents/incidents, and other information, can be referenced by road users. In this V2V communications mode, the real-time traffic data is focus on the traffic accident information dissemination. When a car accident event had occurred, an alert message can be warning out from that accident car and transfer to the CH as shown in Figure 23a)(b).
Figure 23:(a) A safety alert message is warming out and; (b) The alert message has transmitted to the CH.
The CH will broadcast the safety alter message to CMs to help the on-coming vehicles avoid the congestion. The proposed safety alert message dissemination model is to propagate adequate and effective message inter-cluster. In our proposed
34
message dissemination model, the CH and CT are responsible for the message dissemination inter the cluster. For inter-cluster communication, the Figure 24a)(b) show that the CT transfers message to the neighboring cluster. In our design, the CT is predefined by the CH and noticed by broadcasting in CLS_INFO message. The proposed safety alert message dissemination process in V2V mode improves the efficiency of inter-cluster communication.
Figure 24:(a)The CH sends the message to the CT in cluster n; (b)The inter-cluster communication via CT
Figure 25 and Pesudo Code 3 display the message dissemination process and pseudo code in V2V communications mode respectively.
35 CM31 CT3 CM33 CM32 CH3 CH2 CH1 RSU2 RSU1 CT1 CT2 CM23 CM22 CM21 CM13 CM12 CM11 ACCIDENT ACCIDENT ACCIDENT ACCIDENT ACCIDENT ACCIDENT ACCIDENT ACCIDENT ACCIDENT ACCIDENT ACCIDENT QUERY_INFO ACCIDENT ACCIDENT ACCIDENT ACCIDENT
Figure 25: The message dissemination process in V2V communications mode
Pseudo Code 3: The message dissemination in V2V communications mode Receive Message: Switch(Role) { Case CH: Send Message to CM; Break; Case CT: If(Message.own == CH) Receive message; Else
Transfer received message to the hind cluster; Break; Case CM: If(Message.own ==CH) Receive message; Else Transfer to CH; Break; Default: Break; }
36
We will use mathematic analysis to calculate the number of message dissemination and the message deliver time in this proposed mode. There areJ
clusters to transmit and receive message in the same driving direction. In addition, each vehicle is within the transmission rage of its forwarder. When an accident occurred in the first cluster, Msg is expressed as the total number of this safety alert message dissemination from accident spot to the J cluster. The CTs take th (J 1) times to transfer message to its hind cluster.
In a well-connected environment, we assume that every CT could disseminate message to the CH of its hind cluster. The total number of the safety message dissemination in well-connected environment could be expressed as the following:
M s g1J(J1)2J
In a discrete environment, CT will broadcast the message to the hind cluster. There is a probability of the next cluster member received the message from front cluster, Pn. The number of the cluster member could be express asMn. The CM who
receives message from CT could be expressed as Pn*Mn. The total number of the safety message dissemination in the environment could be expressed as the following:
1 -j 0 1 -j 0 ) M n * P n ( 2 ) M n * P n ( ) 1 ( 1 J J J M s gThe message transmission time from CM to CH is written astm2h. The total
maximum message broadcast time from the CH to all CMs is defined as B. The message transmission time between CT to the hind cluster is written as tt2c. The
delivery time D(t) would be included: the first message sends out from the accident vehicle to the CH, the CH broadcasts to all CMs, (J 1)times of CT sends to the hind cluster. In a well-connected environment, the D(t) is as below.
B J t J B t t D( ) m2h ( 1)( t2c)( 1)
37 B J t J t t D( ) m2h ( 1)(t2c)( )
When in a discrete environment, the message deliver time is as below:
) )( 1 ( ) )( 1 ( ) (t tm2h B J tt2c J B tm2h D ) )( 1 ( ) ( ) ( ) (t J tm2h J B J tt2c D
38
Chapter 4 V2I Communications Model
V2I communications model is designed to enable the transmission of traffic information over a wireless network which enables roadside units (RSUs) to perform calculations and issue drivers advisories to mitigate traffic congestion or avoid crashes through specific safety applications. In this section, we consider the approach of collecting real-time traffic information by tracking the locations of each MS through the cellular networks. The architecture is presented in Figure 26[42]. The BSC of GSM/GPRS and the RNC of UMTS will receive measurement reports from active cell phones during the calls. In Section 4.1, we will analyze the measurement reports and adopt the fingerprint positioning algorithm (FPA) to calculate the average speed of the moving cell phones in a specific road segment. Section 4.2 will illustrate the speed estimation. Moreover, for the massive data processing issue from using FPA, we adopt the MapReduce and modified CDM to solve the space-wasting and time-wasting problems which are due to the sparse matrices generated by FPA in Section 4.3.
39
4.1 Fingerprint Positioning Algorithm
In [40],[42],[43],[44] the kNN-based fingerprint position algorithm (FPA) for traffic speed estimation is proposed. For traffic information estimation, we collect the received signal strengths (RSS) of measurement reports from each MS when the MS is in active mode (e.g., handover (HO) and call arrival (CA)). The RSS are then analyzed by FPA to determine the location of MS, and the MS speed is estimated from more than two locations.
We are given a set of beacons B = {b1, b2,..., bn} in a field, which are capable of
transmitting radio signals from n base stations (BSs), and a set of training locations L = {l1, l2,..., lm}. At each training location li, we measure the signal strengths from
beacons for a period of time and create a characteristic vector ri
r1i,r2i,...,rni
in a location database, where r is derived from the RSS of bji j, j = 1,…, n. When anobject moves into the field, it also measures its RSS vector x{x1,x2,...,xn} and
compares the value against the database to determine its location.
The Euclidean distance between signal vectors is used to determine a location l(x) from each scrambled vector x. For each and each training location li’s characteristic
vectorri
r1i,r2i,...,rni
, the distance is calculated by Eq. (4.1).
n j i j j i x r l x d 1 2 , (4.1)The training location with the minimum Euclidean distance will be chosen as the nearest locationw by using Eq. (4.2). 1
)
,
(
min
arg
1 i L ll
x
d
w
i
(4.2) Finally, we will choose the k nearest locations w{w1,w2,...,wn}via thedistance-weighted k-nearest-neighbor rule [45]. The predicted location l(x) is calculated by Eq. (4.3).
40
k a k a k k a a k a k w x d w x d w x d w x d w w x d w x d w x d w x d x l 1 1 1 1 , , , , , , , , (4.3)4.2 Speed Estimation
A novel speed estimation method for the determination of speed information of a MS by means of a RSS characterized in that the calculation is performed by a cellular network executing the steps as follows.
(1) Determining a first locationl(x1)of the MS. (2) Determining a second locationl(x2)of the MS.
(3) Determining the time difference[t1,t2]between the determination of first locationl(x1)and second locationl(x2).
(4) Determining the speedu1,2of the MS based on the time difference [t1,t2] and the geographic dictation D(l(x1),l(x2)) of the first locationl(x1)and the second location l(x2) using Eq. (4.4).
1 2
2 1 2 , 1 , )) ( ), ( ( t t x l x l D u (4.4)4.3 Accelerative Processing in Cloud Computing
The FPA position approach generates a big table with locations as the rows and the RSS vectors from neighboring BSs as the columns. The training set can be expressed as a mn matrix, is a large number of complex signals from cellular networks. As the number of the training locations and BSs has increased, it will take much cost to process the massive data. As mentioned previously, the modified CDM gives consideration to the storage capacity and search efficiency. For this reason, we implement the MapReduce model and adopt modified CDM to mitigate the
41
space-demanding and time-consuming problems. The complexity comparisons between CDM and modified CDM are as follows.
(1) Space Complexity: There are a large number (m) of training locations with their RSS vectors which are detected from the n different BSs. CDM approach stores all RSS vectors of each BS, and the space complexity isO(mn). However, the modified CDM only stores the non-null RSS vectors and location’s ID so it takes
j
s
2 space in j-th column file shown as Eq.(2.1). The space complexity of the modified CDM is
n j sj O 1 2 .(2) Time Complexity: With the computation timeO(g)shown as Eq. (2.2), the time complexities of CDM and the modified CDM are O(m1)andO(sj g), respectively. Therefore, the time complexity of modified CDM is less than CDM in sparse matrices.
Next, we build up a training table which record every location li (including the
identification and geographic coordinates) and its collection of signal strengths
i
n i i
i r r r
r 1, 2,..., . For a location with a signal set x{x1,x2,...,xn}to be determined,
the Euclidean distance d
x,li is processed in Hadoop. As shown in Figure 27, theexecutions of mapper and reducer functions include the following:
(1) For design and build up mapper and reducer functions, we set the location li
as the key, the signal set ri
r1i,r2i,...,rni
and the testing signal setx{x1,x2,...,xn}as the values.
(2) The training datasets will be partitioned into smaller ones for mappers to process independently. The Mapper calculates the Euclidean distance between ri and x
and generates the intermediate <key, value> pairs <li,d
x,li > by Eq. (4.1). The42
(3) The Reducer sorts the intermediate <key, value> pairs and selects the smallest k pairs to determine the location l(x) using Eq. (4.3). When there are more than two locations of the same MS, the speed estimation is then computed by Eq. (4.4). Datasets Location l1 Location l2 Location l3 ‧‧‧ Location lm < key , value > <l1, > <l1,{x1, x2,...,xn}> <key , value > <lm, > <lm,{x1, x2,...,xn}> ‧‧‧ <l1, d(x, l1)> <l2, d(x, l2)> <l3, d(x, l3)> ‧‧‧ <lm, d(x, lm)>
Input Mapper Reducer
m n m m r r r1 ,2,..., 1 1 2 1 1,r ,...,rn r
Figure 27: An overview of mapper and reducer function
Therefore, the proposed V2V communication mode takes responsible for estimating safety related information (e.g., traffic speed and traffic flow) from cellular
![Figure 1: P-persistence broadcast [9] (3) Slotted p-persistence](https://thumb-ap.123doks.com/thumbv2/9libinfo/8014860.160603/15.892.144.761.522.708/figure-p-persistence-broadcast-slotted-p-persistence.webp)
![Figure 2: Slotted p-persistence broadcast [9] (4) TLO [11]](https://thumb-ap.123doks.com/thumbv2/9libinfo/8014860.160603/16.892.143.761.108.317/figure-slotted-p-persistence-broadcast-tlo.webp)
![Figure 3: TLO broadcast [11] (5) APAL [12]](https://thumb-ap.123doks.com/thumbv2/9libinfo/8014860.160603/17.892.216.676.112.344/figure-tlo-broadcast-apal.webp)
![Figure 4: Group formation with geographic boundary [18]](https://thumb-ap.123doks.com/thumbv2/9libinfo/8014860.160603/18.892.222.670.466.826/figure-group-formation-geographic-boundary.webp)
![Figure 6: FSM example II [20]](https://thumb-ap.123doks.com/thumbv2/9libinfo/8014860.160603/19.892.208.697.661.1072/figure-fsm-example-ii.webp)