Running title: Arm Non-use Post-stroke
Quantifying Arm Non-use in Individuals Post-stroke
Cheol E. Han, PhD 1,2 *Sujin Kim, MS, PT 3 * Shuya-Ya Chen, PT, PhD 3,4
Yi-Hsuan Lai, MS, PT 3 Jeong Y. Lee, PhD 1 Jihye Lee, MS, PT 3 Rieko Osu, PhD 5 Carolee J. Winstein, PhD, PT 3 Nicolas Schweighofer, PhD 3
1. Computer Science, University of Southern California, Los Angeles, California 90089-9006, USA
2. Department of Brain and Cognitive Sciences, Seoul National University, Seoul, Republic of Korea
3. Biokinesiology & Physical Therapy, University of Southern California, Los Angeles, California, USA
4. Department of Physical Therapy, China Medical University, Taichung, Taiwan 5. ATR Computational Neuroscience Laboratories, Kyoto , Japan
Corresponding Author:
Nicolas Schweighofer, PhD, Biokinesiology and Physical Therapy, University of Southern California, 1540 E. Alcazar St., CHP 147-C, Los Angeles, CA 90089-9006, USA. E-mail: [email protected] , Phone: (323) 442 -1838
* These authors contributed equally to this work.
Abstract
Background: Arm non-use, the difference between what the individual can do when
constrained to use the paretic arm and what the individual does when given a free choice to
use either arm, has not yet been quantified in individuals post-stroke, possibly because
current instruments are not adequate to measure non-use repeatedly.
Objectives: 1) to quantify non-use post-stroke and 2) to develop and test a simple,
objective, reliable, and valid tool to estimate arm use and non-use post-stroke.
Methods: We first estimate non-use with the Quality of Movement (QOM) subscale of
the Actual Amount of Use Test (AAUT) by subtracting the AAUT QOM score in the
spontaneous use condition from the AAUT QOM score in a subsequent constrained use
condition. Next, we present a novel objective and simple instrument to quantify arm use and
non-use, the Bilateral Arm Reaching Test (BART). In the spontaneous use condition,
participants are free to use whichever arm to reach visual targets projected on a table. In the
constrained use condition, participants reach targets using their more affected arm.
Results: All our participants (N = 24) with chronic stroke and with mild to moderate
impairment exhibit at least some degree of non-use with the AAUT QOM. Non-use with
Conclusions: BART can be used in the clinic to repeatedly quantify the effects of
neuro-rehabilitation on arm use and non-use, and in the laboratory for advancing our theoretical
knowledge about the recovery of arm use after stroke.
Keywords
INTRODUCTION
Most individuals with upper extremity disability resulting from a stroke face difficulties
with effective use of the paretic arm and hand in daily activities, resulting in significantly
reduced quality of life.1-3 Such “non-use” has been defined as the difference between what the
individual can do when constrained to use the paretic arm and what the individual does when
given a free choice to use either arm.4 Non-use in individuals with hemiparetic stroke (or with
other predominantly unilateral motor neurological disorders) can arise from number of
factors such as pain, limited range of motion, as well as higher effort and attention required
for successful use of the impaired hand.5 Non-use has furthermore been hypothesized to have
a learned component.6-9 According to this “learned non-use” hypothesis, non-use would
develop either after unsuccessful repeated attempts to use the affected arm and hand, or after
negative consequences resulting from paretic limb use (such as spilling hot coffee or
dropping a retrieved object).
Despite the high clinical significance of non-use, little work has been conducted to
directly quantify non-use in individuals post-stroke. A seminal study by Sterr et al.8, estimated
non-use in a relatively heterogeneous group of brain injured adolescents with two tests: the
Quality of Movement subscale of the Motor Activity Log test (MAL QOM)10 and the
was estimated for each test by the difference between the actual test score and the score
obtained when the subjects actually perform the tests with the affected hand.
Although the Sterr et al. study demonstrated the feasibility of measuring non-use in
hemi-paretic individuals with the MAL QOM and the AAUT AOU, neither instrument
fulfills the five criteria for an ideal measurement tool in neurological rehabilitation12:
simplicity, objectiveness, test-retest reliability, external validity, and sensitivity. First, neither
MAL nor AAUT are simple to administer, and both require adequate training of the tester by
experienced therapists. Second, because the MAL relies on participants to ratings of the
amount of use and quality of movement of their more affected arm for functional daily
activities outside the laboratory setting, it is not objective. Third, to preserve validity, the
modified AAUT should not be administered repeatedly, and as such, it may lack good
test-retest reliability. Fourth, the AAUT AOU has large variability and is relatively insensitive to
treatment effect because of the low resolution of its scoring system.13 In order to advance
both theoretical and practical knowledge about the recovery of arm use after stroke, there is
therefore a considerable need to develop tools that capture purposeful arm use and non-use
with objective activity monitoring.13
The goal of this study is threefold. First, we investigate the existence of non-use in
participants with chronic stroke, as measured from the AAUT QOM. Second, we propose a
Reaching Test (BART) to quantify paretic arm use and non-use objectively and repeatedly.
Third, we investigate whether measurement of arm non-use with BART in participants with
chronic stroke is reliable in test-retest, and whether it exhibits external validity when
compared to non-use as assessed from AAUT QOM.
METHODS
Participants
Twenty-four participants with chronic stroke (18 males, 6 females) were enrolled in this
study. The inclusion criteria were: (1) Mini-Mental State Examination score > 25/30; (2) at
least 6 months post-stroke; (3) no pain in the paretic arm and hand; (4) right-hand dominant
pre-stroke; (5) the ability to reach the farthest target displayed at 30 cm anterior to the
midline trunk (the target is the farthest target in front of the body midline presented by
BART); and (6) no visual neglect, as evaluated with Albert’s test. Pre-stroke hand dominance
was self-reported. In addition, ten non-disabled (4 males, 6 females) right-handed (according
to Edinburgh Handedness Inventory)14 age-matched participants were recruited (age of
participants post-stroke: 62.25 ± 2.64 (SE: Standard error), age of non-disabled participants:
58.10 ± 3.76 (SE)).
To test BART test-retest reliability, 19 participants with stroke performed three test
from the reliability group) performed at least two sessions four days apart, with the validity
assessed at the second session. The study was approved by the Institutional Review Board of
the University of Southern California, and all participants read and signed a written informed
consent form prior to study enrollment.
Baseline Measures
The upper extremity score of the Fugl-Meyer test (FM-UE)15 was administered to all
participants post-stroke by four different testers, all physical therapists with more than two
year of clinical experience.
The AAUT was administered to the 15 participants post-stroke enrolled in the validity
study. The AAUT was administered in both a spontaneous use condition (sAAUT) and a
constrained use condition (cAAUT), as in 8. The sAAUT was administered before cAAUT.
We analyzed only the first 14 items of the original 17-item AAUT, because these 14 items
relate to arm use. We used the AAUT QOM instead of the AAUT AOU to test the external
validity of BART for two reasons. First, the cAAUT AOU scores in Sterr et al., were close to
maximum for most participants. Second, recent work, investigating the minimal detectable
change for the AAUT and MAL, showed greater variability and insensitivity to treatment
by three experimenters and rated by one evaluator, a physical therapist with more than two
year of clinical experience.
The AAUT QOM scores in the spontaneous use condition, sAAUT, and in the
constrained use condition, cAAUT, were calculated and expressed as average scores, from
zero to 5. Non-use was computed by nuAAUT = cAAUT – sAAUT. Note, in this paper, we use
capital letters, as in sAAUT or sBART, to label the instruments or the conditions; we use
italicized capitals, such as sAAUT or sBART, to label the corresponding numerical scores.
The Bilateral Arm Reaching Test
Apparatus : Target distance and location play a crucial role in arm choice for pointing
movements16,17. BART therefore displays one of 100 targets a time, along 6 distances between
10 cm to 30 cm and 16 (every 10° between 10° and 170°) from the home position on a 2D
hemi-workspace. Targets, white disks of 2 cm in diameter, are illuminated on the table from
the overhead projector with a preset target presentation schedule. Two Mini-Bird model 500
(5mm) magnetic sensors (Ascension Technology Corporation) are positioned on the tip of the
index finger of each hand measure finger motion and arm choice (sampling 100 Hz).
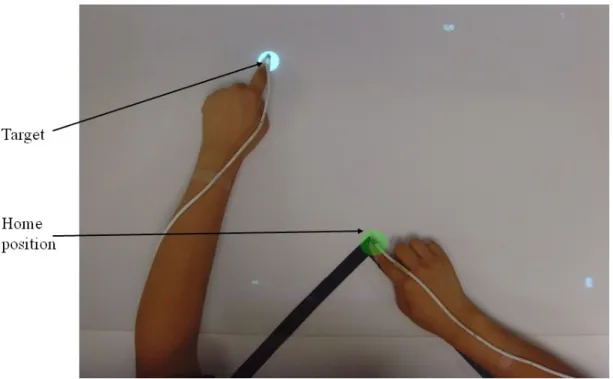
Testing procedure : Participants were seated comfortably with their trunk stabilized with
a restraining belt to limit upper body movement18 . Participants were instructed to place both
by the peak of a black triangle taped (Figure 1). After a target was presented, participants
were instructed to reach the target as quickly and as accurately as possible, to remain in
contact with the target until it disappeared, and to return to the home position. Dragging the
arm along the table surface was instructed to be inappropriate and was discouraged whenever
observed by the experimenter.
A successful trial was defined when participants reached the target within 1.2 seconds.
The 1.2 seconds time constraint was chosen after the beta version of BART was developed to
increase the task demand and more closely simulate daily life reaching tasks. In both free and
constrained use conditions, targets appeared twice at each position in a pseudorandom order,
resulting in 200 trials in each condition. Audible sounds were played after each trial: pleasant
sounds followed successful trials and unpleasant sounds unsuccessful trials.
In the spontaneous use condition, participants were instructed to reach to each
successively displayed target with either hand as quickly and as accurately as possible. The
other index finger stayed within the home position while the chosen hand was moving
(Figure 1). Participants were reminded that there was no right or wrong answer in their choice
of arm, but were instructed to maximize the number of successful trials. Participants in the
non-disabled group were instructed to use their right arm (dominant arm).
In the constrained use condition, participants post-stroke were instructed to reach each
in the white circle until it disappeared, and returned to the home position.
Dependent Measures
Spontaneous use BART (sBART) : To compute arm use in participants post-stroke, we
quantified the successful trials made by the affected arm. For age-matched controls, we
quantified the successful trials made by the dominant arm. For each target, we computed the
probability of successful reach with the paretic arm
) rm| target affectedA
handChoice (success,
Pfree . A second order logistic regression
model interpolated and smoothed these probabilities to obtain a probabilistic use map over
the 2D workspace. The logistic regression model has an extended input feature space,
[x2,y2,xy,x,y,1], where x and y are the coordinates of 2D workspace. The choice was
established based on our data showing that the indifference line (i.e., line of 50% choice
probability) can be very curved in participants post-stroke (e.g., Figure 2d); a simple first
order logistic regression model cannot account for such curvature.
sBART is then computed by integrating the volume beneath the probability surface given
by the logistic regression model of use. For the integration, we used a 1000 by 1000 grid for
the workspace.
BART Non-Use ( nuBART ): We compute nuBART by comparing performance in the
in the spontaneous use condition (what the participant actually does). It is not possible
however to directly perform the subtraction of sBART from the integrated performance over
the whole hemi-workspace in the constrained use condition, because the workspace covered
in the constrained use condition can be equal to the whole workspace (at least in participants
post-stroke with mild impairments); in which case the integrated performance would be equal
to 1. In contrast, because all participants use their non-paretic arm in the spontaneous choice
condition, sBART is never equal to 1- see results. In non-disabled participants, sBART is
around 0.6. The average arm use of the non-disabled participants in the spontaneous use
condition was therefore applied as a mask to constrain the workspace to the actual use area in
the constrained use condition.
Specifically, to compute performance, we first define the probability of reaching each
target successfully with the affected arm (see Figure 2 for steps of the computation):
m| target) affectedAr e (handChoic target) P (success| P target m affectedAr handChoice success P healthy free const perf _ ) | , ( (1)
where Pconst(success| target) is computed from a second order logistic regression model (as
above) with the successful trial data in the constrained use condition (Figure 2a), and
m| target) affectedAr
e (handChoic
Pfree_healthy is computed from a logistic regression model
2b). Pperf(success,handChoiceaffectedArm|target) is thus a probability of successful
reach in the constrained condition, masked by the spontaneous choice data in non-disabled
age-matched controls (Figure 2c).
cBART is then computed by integrating the volume beneath the probability surface given
by Pperf(success,handChoiceaffectedArm|target).
nuBART is then computed by subtracting sBART from cBART , and taking possible
negative values to 0, in line with the definition of non-use. Thus:
cBART sBART
nuBART (2)
where the function x returns x if x>0 and 0 otherwise. For sole illustrative purpose in this
paper (i.e. Figure 2e), we computed non-use probability maps by subtracting, for each target,
the probability of successful reach with the affected arm in the spontaneous condition
) rm| target affectedA
handChoice (success,
Pfree from the probability of successful reach
with the affected arm in the constraint condition
) |
,
(success handChoice affectedArm target
Pperf (taking 0 if the difference is negative).
Statistical Analyses
The number of trials per session (200) was determined from the non-disabled
400; we observed that sBART converged after around 150 trials for all participants (data not
shown). We chose to increase the number of trials to 200 because participants post-stroke
may exhibit larger within-participant choice variability than non-disabled participants.
For each variable, sBART, cBART, and nuBART, we performed test-retest reliability, and
external validity computations. Reliability was assessed with intraclass correlation
coefficients (ICCs) for three sessions and with the Pearson’s or Spearman’s correlation
coefficients (after testing for normality) for session-to-session measurements. External
validity was tested with the Pearson’s or Spearman correlation coefficients (after testing for
normality). External validity for the amount of use sBART was tested by the correlation with
sAAUT. External validity for performance cBART was tested by the correlations with cAAUT.
Non-use external validity was tested by correlation between nuBART and nuAAUT. In
addition, we tested for possible correlations between nuBART and months since stroke and
age, and tested the effect of the side of paresis.
For all analyses, the level of statistical significance was set at P < 0.05. Normality of the
data was tested with the Shapiro-Wilk test. When the data were not normal, non-parametric
statistics were used (as indicated in results). Data analyses were performed using the SPSS
13.0 and MATLAB 7.5 statistics toolbox for Windows. All average results are reported as
RESULTS
Demographic and stroke characteristic data
Table 1 summarizes the demographic data for the 24 participants post-stroke. There was
no difference in age between groups (62.25 ± 2.64 post-stroke, 58.10 ± 3.76 controls P = .
390). In the stroke group, there was no difference between affected sides (P = .186). Time
from stroke onset was 79.46 ± 12.19 months (range 11 to 275 months). The FM-UE was
49.21 ± 2.18 (range 22 to 63).
Measuring use, performance, and non-use with the AAUT test
For those 15 post-stroke participants enrolled for the validity study, the sAAUT QOM
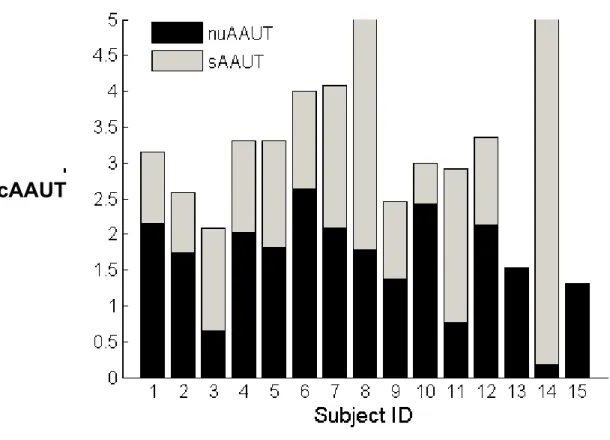
was 1.50 ± 0.32, and cAAUT QOM was 3.17 ± 0.28. The non-use, as computed by nuAAUT =
cAAUT - sAAUT (QOM subscale), was normally distributed (Shapiro-Wilk test P = .209),
and significantly greater than zero (1.67 ± 0.18 P < .0001, one sample t-test). Thus, all
participants did exhibit some degree of non-use overall, although the range of non-use
observed was large (range: 0.18 - 2.64, max range: 0.0 - 5.0; Figure 3).
The cAAUT correlated with FM-UE (r = 0.758, P = .001). There was no correlation
between nuAAUT and FM-UE (r = -0.136, P = .629). In addition, nuAAUT did not correlate
paresis (P > .1, Mann–Whitney U test). There was a trend for a positive correlation between
nuAAUT and age (r = 0.473 and P = .075, Pearson).
The sAAUT AOU was 0.45 ± 0.66. Similar to the findings by Sterr et al., the cAAUT
AOU was not an adequate measure of performance, as it was near the maximum (0.97 ±
0.19) and reached the ceiling in 12 participants. This provides additional support for our
choice of the cAAUT QOM to measure performance here - see also 13.
Measuring use, performance, and non-use with BART
Non-Disabled Control Participants: All non-disabled participants successfully used their
right hand to reach for the targets on the right hand side 100 % of the time (Figure 2b). The
indifference line (line for which the probabilities to use both arms are equal), was slightly
shifted leftward of the midline. Consequently, mean sBART was greater than 0.5, with sBART
= 0.60 ± 0.10. Thus, the handedness bias is on average 10% of the workspace in non-disabled
right-handed participants.
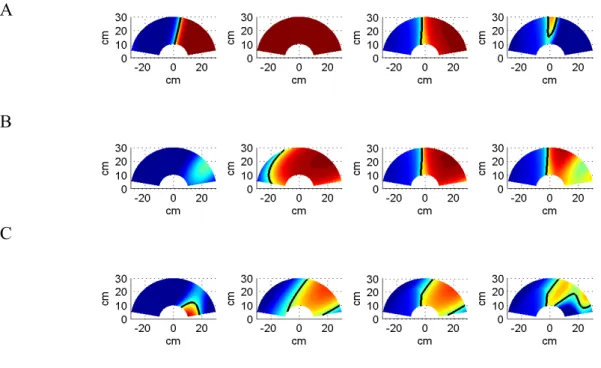
Participants Post-Stroke: Figure 4 shows examples of use and non-use probability maps
with BART in one session over the 2D reaching workspace for three right-handed concordant
participants with stroke: (A) a participant with little use; (B) a participant with large
non-use, albeit mild impairment; and (C) a participant with moderate non-use and impairment. In
form an island instead of a straight boundary on the 2D map (see for example, Figure 2d and
4c).
BART Test-retest Reliability
For the 19 participants post-stroke who participated in the reliability study, mean sBART
was 0.25 ± 0.04 for the first session, 0.28 ± 0.05 for the second session and 0.29 ± 0.04 for
the third session. sBART, cBART, and nuBARThad good test-retest reliability across the three
sessions: sBART intraclass correlation coefficient (ICC) was 0.840, (P < .0001), cBART ICC
was 0.807, (P < .0001), and nuBART ICC was 0.786, (P < .0001; note however that these
ICC results should be considered with care because the sBART and nuBART data were not
distributed normally). The correlations of mean sBART, cBART, and nuBART between
session 1 and 2 were good (sBART: r = 0.668, P = .002, Spearman correlation; cBART: r =
0.803, P < .0001, Pearson correlation; nuBART: r = 0.711, P = .001, Spearman correlation),
but became excellent between session 2 and 3 (sBART: r = 0.854, P < 0.0001, Spearman
correlation; cBART: r = 0.883, P < .0001, Pearson correlation; nuBART: r = 0.950, P < .0001,
Spearman correlation). This demonstrates excellent reliability of BART between session 2
and 3, but lower reliability between session 1 and 2. As a result, we considered the first
session as a familiarization session. In the validity study, we therefore only analyzed the data
Unlike non-disabled participants who could always reach to all the targets within 1.2
sec, reach success in the sBART condition was lower for participants with stroke, although
success rates improved somewhat over the sessions (first session success rate = 87.26 ±
2.64%, second session 91.97 ± 1.96% and third session, 91.02 ± 2.19%. repeated ANOVA, P
< .037). Success rates were greater in session 2 than in session 1 (paired t-test P = .012), but
not between session 2 and 3 (paired t-test P > 0.5).
External Validity of BART use sBART, performance cBART, and non-use nuBART
Here, we validate sBART, cBART, and nuBART with equivalent AAUT QOM measures
for 15 participants who participated in the validity study, using BART measurements from
the second session. Correlation between sBART and sAAUT QOM was good (r = 0.679, P = .
005, Spearman). Correlation cBART and cAAUT QOM just reached significance (cAAUT
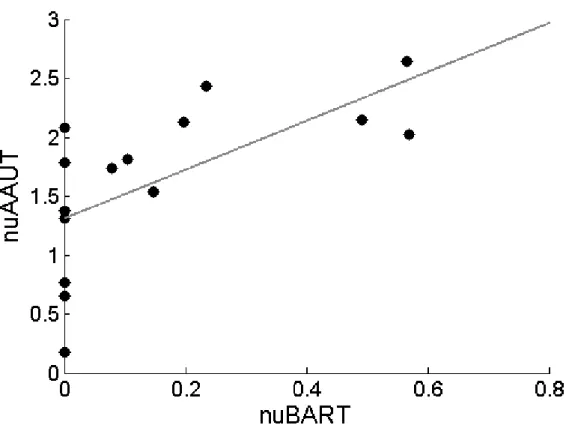
QOM r = 0.515, P = .05, Spearman). Finally, correlation between nuBART and nuAAUT was
good (r = 0.683, P = .005, Spearman). Figure 5 shows nuAAUT as a function of nuBART.
Note that nuBART was zero for six participants and very close to zero (0.008) for another
participant. Thus, the nuAAUT appears to have greater resolution than nuBART to detect
small amount of non-use.
Here, we used data from all 24 participants at the second session. There were no
significant correlations between nuBART with months since stroke (P > .5), age (P > .5), and
affected side (P > 0.5, Mann-Whitney U).
DISCUSSION
The present study makes three important and novel contributions. First, we have, to our
knowledge, for the first time directly quantified paretic arm non-use in individuals with
chronic stroke. For this purpose, we subtracted average use obtained in the spontaneous use
condition of the AAUT QOM from average performance obtained in the constrained use
condition of the AAUT QOM. Second, we have developed a novel laboratory-based
measurement tool, the Bilateral Arm Reaching Test (BART), to measure arm non-use
objectively. BART is simple to administrate, requires minimal instructions to the participant
and personnel training, and is objective. Finally, although we have developed and studied
BART especially for individuals post-stroke, we believe that BART can reliably quantify arm
use and performance in participants with other (lateralized) neurological conditions such as
Parkinson’s disease, Cerebral Palsy, focal dystonia, or even non-neurological conditions such
as scapular pain. Third, we showed that non-use measured with BART has excellent
We found no correlation between either measure of non-use, nuAAUT and nuBART,
with time since stroke, age, and side paresis. This later result is somewhat surprising, because
a previous study19 showed that whereas left hemiplegic individuals used their right arm four
times more frequently than their left arm, right hemiplegic individuals used their left arm two
times more frequently than their right arm.
As a measure of arm use, BART has several advantages compared to the existing
instruments such as the MAL and AAUT. First, it provides an objective and quantitative
measure of voluntary paretic arm use in daily life post stroke. In contrast, MAL scoring is
based on participants’ recall and is subjective. Second, BART exhibits excellent reliability for
repeated measures, making it ideal for examining the effectiveness of rehabilitation on
non-use. In contrast, the AAUT, is best used only once, or at most only infrequently at it was in
the EXCITE trial20, because the spontaneous use condition must be covert. Third, BART is
simple and timesaving. Unlike the MAL, which takes at least an hour to administer, a single
BART session takes less than 15 minutes.
At least three studies are directly related to the present study. As discussed above8, Sterr
et al. quantified non-use with the AAUT in individuals with a variety of impairments.
Johnson et al.21 evaluated non-use in five participants post-stroke by measuring errors during
a steering task in affected, unaffected, and bimanual arms conditions. Finally, Brown
BART device with 5 actual reaching tasks involving proximal and/or distal hand
movements22.
There are nonetheless several limitations of the present study. First, the amount of
non-use quantified with the AAUT may be due at least in part to a learning effect in AAUT since
the constrained use condition is given soon after the spontaneous use condition. We indeed
found a small improvement on the tasks that the participants could perform (score > 0) in the
second cAAUT condition (mean score 3.61 ± 0.11) compared to the first sAAUT condition
(3.26 ± 0.13 on these tasks; Paired t-test: P < 0.0001). Thus, a small learning effect cannot be
excluded. Because this value (0.35 in average) is small compared to the average nuAAUT =
1.67 in our participants post-stroke, we believe that our AAUT results demonstrate actual
non-use. Second, because of the difficulty in recruiting a large group of participants
post-stroke who were left-hand dominant before the post-stroke, we developed BART only for
participants who were right hand dominant before stroke. Third, we did not control for
compensatory arm movements such as excessive shoulder elevation and abduction during
reaching23. Preventing such movements may further limit use. Finally, the time allowed to
complete the reaching movements was set to a single value of 1.2 sec. With this time limit,
six participants out of 15 in the validity group and 10 out of 24 overall chose not to use the
paretic arm at all in the second session with BART. In our beta version of BART, we noticed
work, we will need to parameterize BART such that it can detect non-use across a large
proportion of patients with variable initial characteristics.
Besides its usefulness as a measurement tool to capture use and non-use of the paretic
limb after stroke, BART may be useful to elaborate our understanding of motor control and
decision making underlying reaching choice, and notably the factors that affect changes in
these choices, including changes in performance due to motor therapy. We have previously
proposed and have begun to test an “optimal therapy threshold” hypothesis,24-26 according to
which a minimum amount of therapy is needed to reach a minimum arm use level such that
use and performance continue to improve following therapy. BART can be helpful in
determining such a threshold with repeated measurements of use and non-use before, during,
ACKNOWLEDGEMENTS
We thank Dr. Young Geun Choi for help with computer programming, Dr. James
Gordon for his inputs during development of the task, and Neerav Parikh for help with data
collection. This work was in part supported by NIH grants P20 RR020700-01 and R03
HD050591-02 and R01 HD065438-01A2. CEH is in part supported by the WCU program
through the National Research Foundation of Korea funded by the Ministry of Education,
Science and Technology (R32-10142). RO is in part supported by the Funding Program for
REFERENCES
1. Mayo NE, Wood-Dauphinee S, Cote R, et al. Activity, participation, and quality of life 6 months poststroke. Arch Phys Med Rehabil. 2002:83;1035-1042.
2. Dobkin BH. Clinical practice. Rehabilitation after stroke. N Engl J Med. 2005:352;1677-1684.
3. Duncan P, Studenski S, Richards L, et al. Randomized clinical trial of therapeutic exercise in subacute stroke. Stroke. 2003:34;2173-2180.
4. Andrew K, Stewart J. Stroke recovery: he can but does he? Rheumatol Rehabil 1979:18;43–48.
5. Sunderland A, Tuke A. Neuroplasticity, learning and recovery after stroke: a critical evaluation of constraint-induced therapy. Neuropsychol Rehabil. 2005:15;81-96. 6. Taub E, Uswatte G, Mark VW, et al. The learned nonuse phenomenon: implications
for rehabilitation. Eura Medicophys. 2006:42;241-256.
7. Taub E, Uswatte G. Constraint-induced movement therapy: bridging from the primate laboratory to the stroke rehabilitation laboratory. J Rehabil Med. 200334-40.
8. Sterr A, Freivogel S, Schmalohr D. Neurobehavioral aspects of recovery: assessment of the learned nonuse phenomenon in hemiparetic adolescents. Arch Phys Med
Rehabil. 2002:83;1726-1731.
9. Taub E, Crago JE, Burgio LD, et al. An operant approach to rehabilitation medicine: overcoming learned nonuse by shaping. J Exp Anal Behav. 1994:61;281-293.
10. Uswatte G, Taub E, Morris D, et al. The Motor Activity Log-28: assessing daily use of the hemiparetic arm after stroke. Neurology. 2006:67;1189-1194.
11. Uswatte G, Taub E. Implications of the learned nonuse formulation for measuring rehabilitation outcomes: lessons from constraintinduced movement therapy. Rehabil
Psychol. 2005:50;34-42.
12. Wade DT. Measurement in Neurological Rehabilitation: Oxford Medical Publications; 1992.
13. Chen S, Wolf SL, Zhang Q, et al. Minimal Detectable Change of the Actual Amount of Use Test and the Motor Activity Log: The EXCITE Trial. Neurorehabil Neural
Repair. 2012:In press.
14. Oldfield RC. The assessment and analysis of handedness: the Edinburgh inventory.
Neuropsychologia. 1971:9;97-113.
15. Fugl-Meyer AR, Jaasko L, Leyman I, et al. The post-stroke hemiplegic patient. 1. a method for evaluation of physical performance. Scand J Rehabil Med. 1975:7;13-31. 16. Mamolo CM, Roy EA, Rohr LE, et al. Reaching patterns across working space: the
17. Stoloff RH, Taylor JA, Xu J, et al. Effect of reinforcement history on hand choice in an unconstrained reaching task. Front Neurosci. 2011:5;41.
18. Roby-Brami A, Feydy A, Combeaud M, et al. Motor compensation and recovery for reaching in stroke patients. Acta Neurol Scand. 2003:107;369-381.
19. Rinehart JK, Singleton RD, Adair JC, et al. Arm use after left or right hemiparesis is influenced by hand preference. Stroke. 2009:40;545-550.
20. Winstein CJ, Miller JP, Blanton S, et al. Methods for a multisite randomized trial to investigate the effect of constraint-induced movement therapy in improving upper extremity function among adults recovering from a cerebrovascular stroke.
Neurorehabil Neural Repair. 2003:17;137-152.
21. Johnson M, Paranjape R, Strachota E, et al. Quantifying learned non-use after stroke using unilateral and bilateral steering tasks. IEEE Int Conf Rehabil Robot. 2011:2011;1-7.
22. Brown E. Hand preference after stroke: The development and initial evaluation of a new performance-based measure. Thesis, Department of Kinesiology, University of
Waterloo. 2011.
23. Steenbergen B, Van Thiel E, Hulstijn W, et al. The coordination of reaching and grasping in spastic hemiparesis. Human Movement Science. 2000:19;75–105.
24. Han CE, Arbib MA, Schweighofer N. Stroke rehabilitation reaches a threshold. PLoS
Comput Biol. 2008:4;e1000133.
25. Schweighofer N, Han CE, Wolf SL, et al. A Functional Threshold for Long-Term Use of Hand and Arm Function Can Be Determined: Predictions From a Computational Model and Supporting Data From the Extremity Constraint-Induced Therapy Evaluation (EXCITE) Trial. Phys Ther. 2009:89;1327-1336.
26. Hidaka Y., Han C.E., Wolf S.L., et al. Use it and improve it or lose it: Interactions between arm function and use in humans post-stroke PLoS Comput Biol. 2012 8(2):e1002343.
Table 1. Demographic data of the stroke group ID Age (yrs) Gender Dominant Hand Affected Hand Time from Onset (month) FM-UE Motor Score (66 max) FM-Cor Reliability / Validity 1 52 F R R 84 57 4 Rb 2 66 F R R 83 51 3 Rb,V 3 73 M R R 127 43 3 Rb,V 4 64 M R L 41 52 5 Rb 5 79 M R L 79 48 5 Rb,V 6 64 M R R 100 30 4 Rb,V 7 61 M R R 56 48 4 Rb 8 83 M R L 59 60 4 Rb 9 69 F R R 56 53 5 Rb 10 57 M R R 83 63 5 Rb 11 78 M R L 218 56 6 Rb 12 54 M R L 99 39 3 Rb 13 65 M R R 46 58 5 Rb 14 56 M R R 60 45 4 Rb,V 15 77 M R R 112 53 4 Rb,V 16 80 M R L 90 59 6 Rb,V 17 55 M R L 38 61 5 Rb,V 18 60 M R L 49 36 3 Rb,V 19 66 F R L 23 47 2 Rb,V 20 41 M R R 46 56 5 V 21 51 M R L 23 49 5 V 22 68 F R R 275 22 3 V 23 40 F R R 49 61 6 V 24 35 M R L 11 34 2 V AVG/ COUNT (SE) 62.25 (2.64) 18M/ 6F 24R 13R/11L 79.46 (12.19) 49.21 (2.18) 4.21 (0.2 4) 19Rb/ 15V * F=female, M=male, R=right, L=left, FM=Fugl-Meyer, FM-Cor=coordination subscale of the FM-UE, Rb=Reliability, V=Validity, AVG=average, SE=standard error.
Figure 1. Measuring arm use with the Bilateral Arm Reaching Test (BART). The home
position, identified by the green circle and the targets indicated by a white circle. For each
trial, participants were instructed to reach to the target with their choice of hand using the
index finger as quickly and accurately as possible. The magnetic sensors were attached to the
Figure 2. Computing use and non-use with BART in one session over the 2D reaching
workspace for participant post-stroke ID2, in session 3. (a) Constrained use probability for
ID2. (b) Average spontaneous use probability for non-disabled participants (right handed). (c)
Constrained use probability for ID2 after masking with average healthy subject data of panel
(b). (d) Spontaneous use probability fro ID2. (e) Non-use probability for ID2. Color coding:
red = 100% use the paretic arm (right arm for healthy controls), blue = 0% use of the paretic
arm. The indifference line, which is indicated by the thick black line, corresponds to the 50%
decision boundary.
a
b
c
Figure 3. Arm use and non-use in participants post-stroke as estimated from the QOM
subscale of the AAUT. The total height of each bar is cAAUT, the score in the constrained
use condition of the AAUT. Because nuAAUT = cAAUT – sAAUT, cAAUT decomposes into
sAAUT (grey), the performance in the spontaneous use condition of the AAUT, and nuAAUT
(black), the estimate of arm non-use. As can be seen, all participants post-stroke exhibited at
least some degree of non-use.
A
B
C
Figure 4. Examples of use and non-use with BART in one session over the 2D reaching
workspace for three right-handed concordant participants with stroke. Each row represents a
difference subject. Maps from left to right for each row: spontaneous use, performance,
performance after masking with healthy subject choice data, and non-use A. participant with
little non-use. (ID10; session 2, FM 63, FM_cor 5, sBART = 0.64, cBART = 0.57, nuBART =
0.113). B. a participant with large non-use, albeit mild impairment. (ID1; session 2, FM 57,
FM_cor 4, sBART = 0.10, cBART = 0.54, nuBART = 0.433). C. A participant with moderate
non-use and (ID3; session 2 c, FM 49, FM_cor 3, sBART = 0.18, cBART = 0.340, nuBART =
Figure 5. External validity of nuBART shown by plotting nuAAUT as a function of
nuBART for 15 participants post-stroke in the validity study (correlation between nuBART