Wireless sEMG Recording System and Application on Muscle
Fatigue Detection
Kang-Ming Chang 1, Xuan-Han Wu 2 and Shin-Hong Liu 2,*
1 Department of Photonics and Communication Engineering, Asia University, Taichung, Taiwan;
E-Mail: changkm@mail2000.com.tw,
2 Department of Computer Science and Information Engineering,Chaoyang University of
Technology, Taichung, Taiwan; E-Mail: s9827626@cyut.edu.tw
* Author to whom correspondence should be addressed; E-Mail: shliu@cyut.edu.tw; Tel.: +886-(0)4-2332-3000 ext. 5211; Fax: +886-(0)4-2374-2375.
Received: / Accepted: / Published:
Abstract: Surface electromyography (sEMG) is an important measurement to monitor
exercise and fitness. With high sampling frequency requirement, wireless transmission of sEMG is a challenge. In this article, a wireless sEMG measurement with sampling frequency 2K Hz is developed, based upon MSP 430 microcontroller and Bluetooth transmission. Standard Isotonic and isometric muscle contraction are clearly represented in the receiver user’s interface. Muscle fatigue detection is an important application of sEMG. Traditional muscle fatigue is detected from the medium frequency of sEMG power spectrum. Regression slope of linear regression of medium frequency is an important muscle fatigue index. A more negative slope value represents a higher muscle fatigue condition. To test the system performance, muscle fatigue detection was examined by running on pedaled-multifunctional elliptical trainer for nearly 30 minutes with three loading levels. There are ten subjects with totally 60 times experiments were examined. Results showed that regression slope is gradually decreasing as expected, and there is significant gender difference.
Keywords: KW= sEMG, muscle fatigue, Bluetooth, Regression slope
1. Introduction
Physiological monitoring with wireless transmission prompts many applications , such as for healthcare monitoring with portable device . Liu designed a wireless device which measured the one lead ECG signal and three-axis acceleration signals of body motion. An adaptive filter was used to filter the motion artifact of ECG signal [3]. Chang et. al. used a wireless system to monitor the sleep action [4]. Yu et. al. had developed a wireless medical sensor measurement system, inclusive of 1 2 3 4 5 6 7 8 9 10 11 12 13 14 15 16 17 18 19 20 21 22 23 24 25 26 27 28 29 30 31 32 33 34
Electrocardiograph, body skin temperature, eye movement detection, electromyography (EMG), motion detection, and muscle strength, to detect fatigue on multiple sclerosis patients [5]. Pastor-Sanz et al. applied wireless biosignal recording system for emotion detection [6]. Among these physiological measurement system, EMG is an important non-invasive measurement for monitoring muscle fatigue. EMG can be divided as implantable recording or surface skin recording. Implantable myoelectric sensors were also developed for intramuscular electromyogram recording [7]. EMG was also used to monitor changes in corticospinal function and ankle motor control during recovery from incomplete spinal cord injury [8]. Monitoring of exercise and fitness was also an important application of wireless physiological signal system, a well developed non-invasive methodology will encourage individuals to begin and remain compliant with an exercise program allowing a variety of health care providers to assist in patient care [9].
Muscle fatigue detection is one of the important issues among all the application of EMG. There were variety articles involved on muscle fatigue detection by surface EMG (sEMG) amplitude and frequency features [10,11]. Muscle fatigue is a complicated phenomenon that resulted with insufficient blood oxygen and nutrition. There are three types of fatigue [12], (1) central fatigue, (2) fatigue of the neuromuscular junction and (3) muscle fatigue. Muscle fatigue may also be estimated by determining lactate concentration, and it is used routinely in sports medicine, giving an estimation of global fatigue of the organism. Local muscle fatigue can be continuous monitoring by sEMG. It can also demonstrate the biochemical and physiological changes in muscles during fatiguing contractions. The advantage of sEMG is the non-invasiveness and real-time fatigue monitoring during the performance of defined work; it also can monitor fatigue of a particular muscle that is highly correlated with biochemical and physiological changes in muscles during fatiguing.
Power spectrum analysis is the main EMG signal analysis method. Several spectral sEMG analyses could be used to reveal changes in electrophysiological characteristics and, therefore, its validity to assess muscle fatigue [13]. Gonzalez investigated several EMG power spectral indices during dynamic muscle contractions [14]. Spectral parameters such as mean frequency (MNF) and medium frequency (MF) are as fatigue indexes during dynamic contractions until exhaustion [14,15]. The MNF and MF always shift to the low frequency when the muscle fatigue has been happening. Ament found that MNF during an uphill run at a speed of 5 km with a gradient of 20% [16]. Although muscle fatigue is one of the important application of sEMG measurement, and the need for exercise and rehabilitation program, there was still few sEMG recording system with appropriate wireless transmission function. The main problem is the high transmission rate. In general, the sample frequency for measuring sEMG is above 1k Hz. If MNF is used to evaluate the muscle fatigue, the sample frequency must arrive to 2k Hz. Therefore, the goal of this study is to develop a wireless sEMG recording system with a 2k Hz sample rate for the muscle fatigue estimation.
2. Hardware Architecture
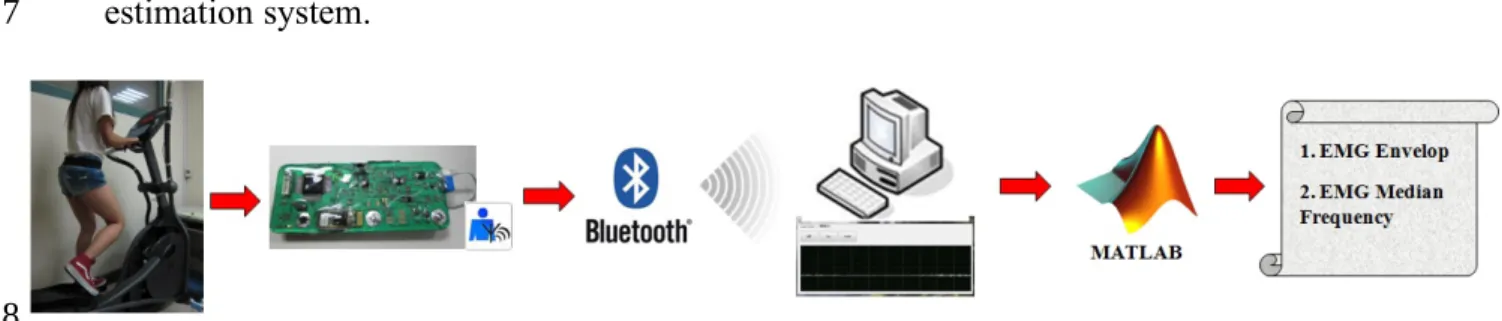
The structure of this wireless EMG recording and muscle fatigue detection system is illustrated in Figure 1. This system is based on the microcontroller MSP430-F5438 as the core structure. The EMG signal was recorded from electrodes attached to the subject and transmitted to the amplifier circuit. Following MSP430-F5438 microcontroller converted recorded data to a digital signal through a 12 bit 2 1 2 3 4 5 6 7 8 9 10 11 12 13 14 15 16 17 18 19 20 21 22 23 24 25 26 27 28 29 30 31 32 33 34 35 36 37 38 39 40
analog-to-digital converter (ADC) embedded in MSP430-F5438. Digital EMG signal was then transferred to a Bluetooth chip and transmitted wirelessly to a remote server. A Visual Basic-based interface system was used to receive the Bluetooth transmitted signal and also used as a real-time signal display and storage. Further EMG signal analysis was performed by a Matlab coded program. Detailed information on each component is described next.
Figure 1. Structure of wireless sEMG recording and muscle fatigue detection and
estimation system.
2.1. sEMG Sensor and Amplifier
Figure 2 shows the block diagram of analog circuit for the portable sEMG device. The raw sEMG signal is a low-amplitude signal; therefore it needs to be amplified. An instrument amplifier (AD8236, ADI Company) was used to enhance the signal which gain is 10. The traditional operational amplifier (AD 8609, ADI Company) was used in the design of a filter, amplifier, peak rectifier, and baseline offset circuit. A two order Butterworth high-pass filter (cutoff frequency is 30Hz) is used to remove the direct current (DC) offset and baseline wandering, whereas the tow order Butterworth low-pass filter (cutoff frequency is 1k Hz) was used to reduce high frequency noise and to avoid aliasing. A gain of non-invert amplifier is 100. The peak rectifier was used to extract the envelope of sEMG as the muscle force. Finally, the baseline of sEMG signal was raised to 1 V by a baseline offset circuit. The power supply to the measurement system was a 4.5-V lithium battery. A voltage regulator (XC62FP) was used to regulate a 3.3 voltage for this circuit.
Figure 2. Block diagram of analog circuit for the portable sEMG device.
2.2. MSP430 Microcontroller
The core of the system is the microcontroller (MCU) MSP430-F5438 chip from Texas Instruments. This device has an embedded 16-bit ADC, 256kB+512B Flash memory and 16kB RAM. The advantage of the MSP430 is that it is a low-power consumption device needing a working voltage 2 1 2 3 4 5 6 7 8 9 10 11 12 13 14 15 16 17 18 19 20 21 22 23 24 25 26
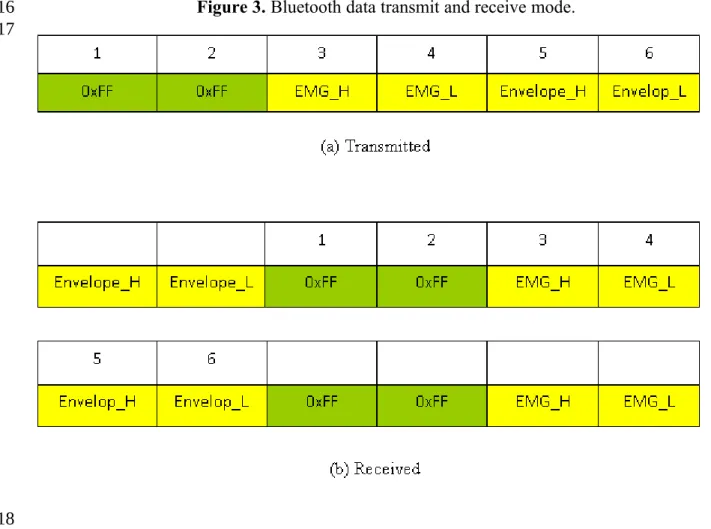
between 1.8 and 3.6 V, and a working current of 0.1μA ~ 250μA when operated at 24M Hz . Due to the properties just mentioned, the MSP430 is a popular device, especially for biomedical signal acquirement systems. A 16-bit timer in the MSP430-F5438 chip was used to enable the ADC 12 to acquire 2 channel signals, EMG and its envelope. Sampling frequency is 2k Hz. The MCU used the serial communication port (baud rate: 115,200) to connect to the Bluetooth module. Because the A/D converter of the MCU is 12 bits, the sample data were separated into low and high bytes. Therefore, in one sample point, there are 2 sample data from the sEMG and its envelope which are separated 4 bytes and stored in a buffer. In this device, when the Bluetooth was suddenly interrupted to stop the communication, some bytes were still being stored in the buffer of the Bluetooth model, and when the Bluetooth transmitted data again, these bytes would appear before the new data. Hence, we transmitted 2 bytes, FF and FF, as the distinguishing code before the 4 sample data to distinguish each sample point’s data, as shown in the transmitted form of Figure 3(a). When the Bluetooth model received the data, 6 bytes were considered as a segment. We first found the position of the distinguishing code. Then, one sample point’s data would be acquired between two distinguishing codes, as shown in the received form of Figure 3(b).
Figure 3. Bluetooth data transmit and receive mode.
2.3. Bluetooth Chip
Bluetooth was chosen as the wireless transmission interface in this study as a consequence of its low cost and low-power radiofrequency transmission. It is widely used in biomedical field, such as 2 1 2 3 4 5 6 7 8 9 10 11 12 13 14 15 16 17 18 19 20 21
heart beat monitoring, healthcare data transmission. A Bluetooth chip made by the CSR Company with type number BTM-204B was used. This Bluetooth chip is energy saving and has a high transmission capacity of 1 megabits per second with pin code. The hopping rate is 1600 hop per second. It is also easy to integrate into the low-level circuit requirements. The transmission range is limited to within 10 m and the highest transmission rate is 11 MB. This is still a very powerful wireless transmission tool in terms of the requirements of a home environment.
2.4. User Interface
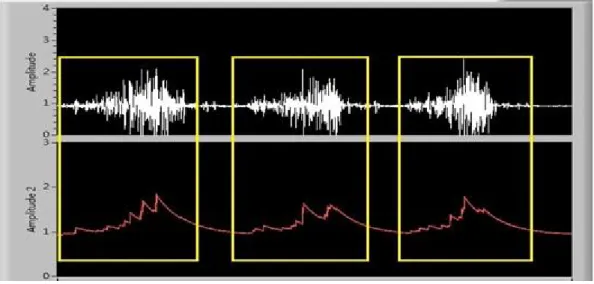
A remote personal computer (PC) receives the Bluetooth-transmitted data and connects to the host PC through USART. A Visual Basic-based user interface was designed to collect the data package from the Bluetooth device through serial COM port. Transmitted sEMG and its envelope signals were examined and displayed on a monitor. Offline sEMG signal analysis was performed, and the data was saved in a text file format. Figure 4 is the received sEMG and its envelope signal.
Figure 4. Display of the received EMG signal. The (a) isotonic contraction signal and (b)
corresponding waveform envelop is significant.
3. Hardware performance examination
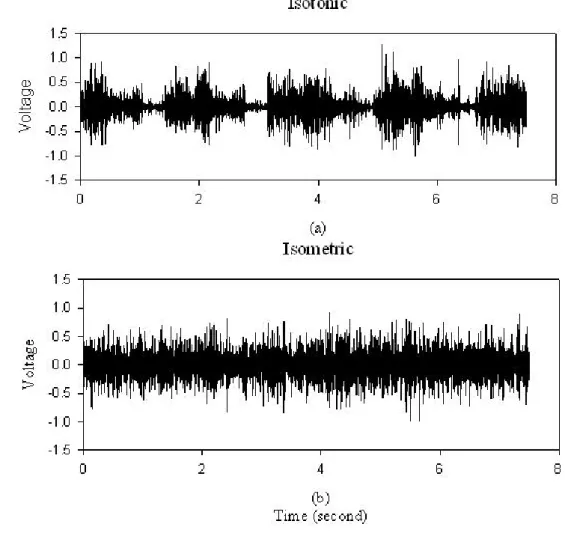
There are two major muscle contraction patterns, one is isometric contraction and the other is isotonic contraction. Isometric contraction is a static movement. Subject is required to be held in a static position; isotonic contraction is dynamic movement. To test the sEMG hardware performance, a dumbbell of 20 ponds was held for one minute. In Figure 5(a), periodic muscle contraction is obviously with the isotonic contraction exercise. Figure 5(b) is the result of isometric contractions. It is obviously that this portable sEMG system is capable of recording muscle contraction effectively.
Figure 5. sEMG hardware performance examination for (a) 7.5 seconds isotonic
contraction. (b) 7.5 seconds isometric contraction. 2 1 2 3 4 5 6 7 8 9 10 11 12 13 14 15 16 17 18 19 20 21 22 23 24
4. Application on muscle fatigue detection 4.1. Experiment Procedure
There are ten volunteers involved (5 male, and 5 female), their age is from 19 to 27 years). Their information is listed in Table 1. The developed wireless sEMG device is worn in the lateral waist, and the electrode is placed at the left vastus lateralis, as shown in Figure 6. The sEMG data is transmitted to the host computer and recorded. Subjects are required to run in the pedaled-multifunctional elliptical trainer (Johnson E8000) to be monitored of their muscle fatigue.
Table 1. Subject characteristics.
Variable Male (n=5) Female (n=5)
Age (years) 24 (2) 21 (2)
Weight (Kg) 78.6(10.8) 53.3(5.3) Height (cm) 176.5(6.8) 163.6(4.7) BMI (Kg-M-2) 25.0(3.9) 19.8(1.4)
Data are expressed as mean (standard derivation). BMI is Body Mass Index.
Figure 6. Illustration of wireless sEMG device worn in the lateral waist with electrode
placed at the left vastus lateralis. 2 1 2 3 4 5 6 7 8 9 10 11 12
An exercise based muscle fatigue examination procedure is established as following procedures: Step 1: Subjects are wearing wireless sEMG device as required procedure. We will use the alcohol to clean the surface, smear the electrolytic gel on electrodes to decrease the contact impedance. Athletic tape is used to fix electrode and avoiding movement of electrode.
Step 2: There are three levels of the pedaled-multifunctional elliptical trainer, L2, L4 and L6. The load of L2 is low and L6 is heavy. Speed of L2 is 55-60 SPM for male and 50-55 for female. Speed of L4 is 60-70 SPM for male and 56-65 for female. Subjects are required to run at their maximum speed until exhaustion on L6, the speed is larger than that on L4. It takes 10 minutes both for L2 and L4.
Step 3: Each subject was recorded twice time for a week, and there was totally six recording times for each subject.
4.2. Muscle Signal Processing
The recorded sEMG is divided into many segments and Fast Fourier Transform is performed. The MF of each segment is extracted. MF is defined as the frequency where accumulated spectrum energy is half of the total spectrum energy, as shown in equation (1). Where p(f) is power spectrum density of sEMG.
MF
MF p f df p f df df f p 0 2 0 1 (1) The window size of the sEMG segment is 30 second, and step size is 15 second. In order to quantify the distribution of MF during the examinations of three stages, a linear regression analysis is applied to evaluate the muscle fatigue condition [17]. The linear function is defined as:b Ax y (2) 2 1 2 3 4 5 6 7 8 9 10 11 12 13 14 15 16 17 18 19 20 21 22
where y is MF and x is the time interval, A is the regression slope and b is the bias. The more muscle fatigue, the smaller slope [18]. We also used the correlation coefficient (r) to represent the stability of sEMG in terms of muscle fatigue which is defined as:
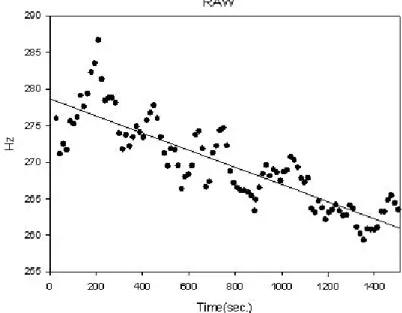
n i i n i i n i i i y y x x y y x x r 1 2 1 2 1 (3) where and are average of x and y, respectively. The more stable sEMG, the larger r value is. A typical MF distribution is shown in Figure 7. It is well known that MF will be decreasing as muscle exercise time is increasing. Parameter r and A will be used to describe the variability and degree of muscle fatigue.Figure 7. A typical illustration of medium frequency distribution and regression line for
one subject for 30 minute exercise.
4.3. Statistics
In this study, the SIGMAPLOT software package was used to conduct data analysis. Descriptive statistics was applied to subjects’ personal information and muscle fatigue parameters (regression slope and correlation coefficient). Data was represented as mean ± standard deviation (mean ± SD). Statistical testing between male and female on muscle fatigue parameters was examined by t-test. Significance test for the alpha value was set at 0.05.
4.4. Result of Muscle Fatigue Experiment
The MF regression parameters distribution of 30 minute exercise is demonstrated in Table 2. There is significant gender difference of muscle fatigue shown in regression slope during L4 (male -0.0088±0.0070, female -0.0161±0.0113, p<0.01**) and L6 (male -0.0128±0.0095, female -0.0257±0.0175, p<0.001***), and also during L2 (male 0.6079±0.2366, female 0.4192±0.2774, p<0.01**), L4 (male 0.4912±0.2259, female 0.6383±0.2196, p<0.05*) and L6 (male 0.5080±0.2220, 2 1 2 3 4 5 6 7 8 9 10 11 12 13 14 15 16 17 18 19 20 21 22 23
female 0.6393±0.2729, p<0.05*) load level with correlation coefficient parameter. There is no gender difference on both parameters for whole 30 minute experiment. Lower slope is an index of higher muscle fatigue. At the beginning of experiment (L2 session), slope between gender is very close and there is no statistical difference. As time goes by, female suffered more fatigue than male, therefore the slope of female is lower than that of male. Table 3 shows the comparison among different exercise levels for all subjects. There is significant difference of muscle fatigue shown at L4 and L6 of regression slope (L4 -0.0125±0.0100, L6 -0.0193±0.0154, p<0.01**). Because the L6 belong to the maximum voluntary contraction, then its muscle fatigue is more serious than L4. The mean slope of L6 is lower than the mean slope of L4. This reasonable result can be a demonstration of the reliability of this wireless sEMG recording system.
Table 2. Slope and Regression result of muscle fatigue examination for the gender
difference. Data are expressed as mean (standard derivation).
Parameters levels Male (n=30) female (n=30) P value Slope (A) L2 -0.0167 (0.0108) -0.0160 (0.0175) 0.859 L4 -0.0088 (0.0070) -0.0161 (0.0113) 0.004** L6 -0.0128 (0.0095) -0.0257 (0.0175) 0.0008*** All -0.0170 (0.0121) -0.0224 (0.0130) 0.098 Correlation co efficient ( r ) L2 0.6079 (0.2366) 0.4192 (0.2774) 0.006** L4 0.4912 (0.2259) 0.6383 (0.2196) 0.013* L6 0.5080 (0.2220) 0.6393 (0.2729) 0.045* All 0.8154 (0.1910) 0.8246 (0.1824) 0.849 P <0.05*; p<0.01**; p<0.001***.
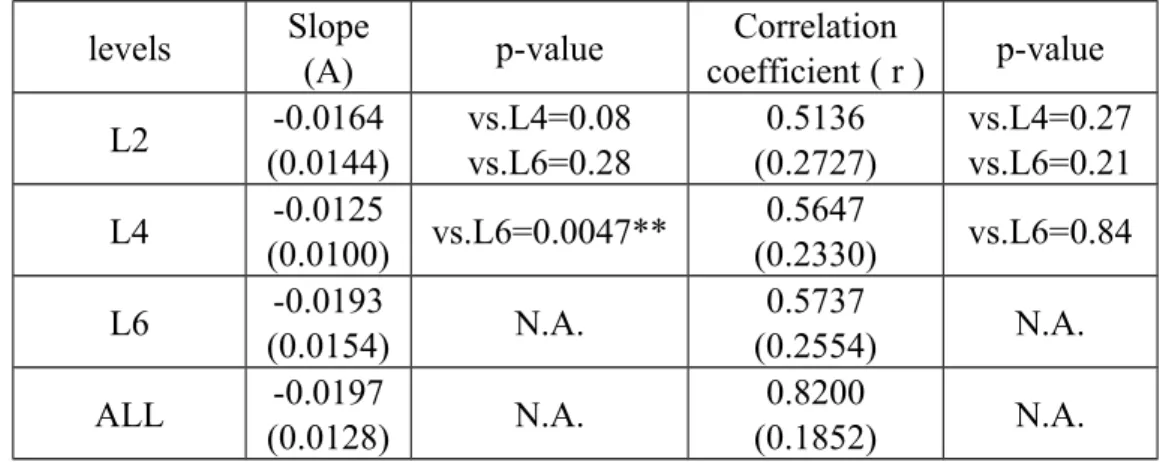
Table 3. Slope and Regression result of muscle fatigue examination for all subjects. P
value is test result of t-test. Data are expressed as mean (standard derivation). levels Slope (A) p-value Correlation coefficient ( r ) p-value L2 -0.0164 (0.0144) vs.L4=0.08 vs.L6=0.28 0.5136 (0.2727) vs.L4=0.27 vs.L6=0.21 L4 -0.0125 (0.0100) vs.L6=0.0047** 0.5647 (0.2330) vs.L6=0.84 L6 -0.0193 (0.0154) N.A. 0.5737 (0.2554) N.A. ALL -0.0197 (0.0128) N.A. 0.8200 (0.1852) N.A. 2 1 2 3 4 5 6 7 8 9 10 11 12 13 14 15
5. Results and Discussions
Wireless EMG transmission is not a very easy job due to the high frequency components. EMG signal is around 100-1000 Hz. According to Nyquist’s theory, sampling frequency must be twice higher than maximum signal frequency. Wireless transmission capacity is the limitation of sampling frequency. With suitable arrangement of MSP430 and Bluetooth chip, this proposed system is able to achieving a satisfactory sampling frequency 2000 Hz. Combined with MSP430 and Bluetooth system, the proposed sEMG recording is stable, low cost, low power and user friendly. Bluetooth transmission is often interrupted, due to invisible environment electromagnetic wave interference or concrete blockage. This system can record sEMG data and its envelop is stored in a buffer. When the Bluetooth was suddenly interrupted to stop the communication, buffered data would be shown when the system is connected again.
This proposed system also was used for muscle fatigue examination under exercise training. The main requirement of exercise sEMG recording is the system stability. This proposed system is useful to detect sEMG during elliptical trainer exercise. The wireless function provides more application possibility than traditional sEMG recording system, such as for dynamic monitoring of specific muscle disorder patient, and for health care of elders.
The well-known phenomena of MF decreasing with muscle fatigue increasing are also demonstrated by this system. Female will suffer more muscle fatigue when exercise. This is also shown on the result that the MF regression slope for female is lower than male subject. The gender difference is significant on each 10 minute durations of L4 and L6 levels. L6 level is the maximum voluntary contraction. Thus, its mean slope is the lowest than the other levels, and has a significant different for the mean slope of L4 level in Table 3. Although, for the correlation coefficient, the gender difference is also significant on L2 to L6 levels in Table 2, we couldn’t find that the stability of sEMG has the relation with the force level in Table 3. This phenomena is same to the previous studies [14-16, 18]. Moreover, in Table 3, we find that the mean slope of L2 level is lower than L4 level, and its standard derivation is also larger than L4 level. This reason is that the L2 level is the minimum voluntary contraction, and belongs to the exercise beginning. Thus, the degree of muscle fatigue is very light. In Fig. 7, the MF distribution of L2 level doesn’t decrease gradually. This phenomenon is also the same to the previous studies [14,18].
This system can be potential candidate for other sEMG related disorder recording. Homecare and rehabilitation are two main applications. Elder’s motion monitoring, such as Parkinson’s subjects, will be benefit by this wireless sEMG recording system.
6. Conclusions
A portable wireless muscle contraction activity monitoring system with monitoring of muscle fatigue was developed. Standard isotonic and isometric muscle contraction can be effectively recorded. High sampling frequency achieving 2k Hz of Bluetooth transmission is beneficial for walking and exercise. Standard muscle fatigue index, the regression coefficient and slope of MF for three loading exercise is also examined. There is also significant difference of regression slope 2 1 2 3 4 5 6 7 8 9 10 11 12 13 14 15 16 17 18 19 20 21 22 23 24 25 26 27 28 29 30 31 32 33 34 35 36 37 38
between male and female subjects. This system can be potential candidate for sEMG related disorder recording, especially under homecare and rehabilitation environment.
Acknowledgments
This work has been partly supported by the National Science Council of Taiwan (Grant no. NSC 99-2632-E-324 -001 -MY3) and Asia University, Taiwan (Grant no. 100-A-13).
References
1. Lee, Y. and M. Lee, SMS application using EMG signal of clenching teeth for e-health
communication. Telemed J E Health, 2008. 14(6): p. 593-7.
2. Wang, W.S., et al., Wireless biopotential acquisition system for portable healthcare monitoring. J
Med Eng Technol, 2011. 35(5): p. 254-61.
3. Liu, S.H., Motion Artifact Reduction in Electrocardiogram Using Adaptive Filter. Journal of
Medical and Biological Engineering, 2011. 31(1): p. 67-72.
4. Chang, K.M. and S.H. Liu, Wireless portable electrocardiogram and a tri-axis accelerometer
implementation and application on sleep activity monitoring. Telemed J E Health, 2011. 17(3): p.
177-84.
5. Yu, F., A. Bilberg, and E. Stenager, Wireless medical sensor measurements of fatigue in patients
with multiple sclerosis. Conf Proc IEEE Eng Med Biol Soc, 2010. 2010: p. 3763-7.
6. Pastor-Sanz, L., et al., Clinical validation of a wearable system for emotional recognition based
on biosignals. J Telemed Telecare, 2008. 14(3): p. 152-4.
7. Weir, R.F., et al., Implantable myoelectric sensors (IMESs) for intramuscular electromyogram
recording. IEEE Trans Biomed Eng, 2009. 56(1): p. 159-71.
8. Wirth, B., H.J. Van Hedel, and A. Curt, Changes in corticospinal function and ankle motor
control during recovery from incomplete spinal cord injury. J Neurotrauma, 2008. 25(5): p.
467-78.
9. Burkow-Heikkinen, L., Non-invasive physiological monitoring of exercise and fitness. Neurol
Res, 2011. 33(1): p. 3-17.
10. Dimitrov, G.V., et al., Simulation analysis of interference EMG during fatiguing voluntary
contractions. Part II--changes in amplitude and spectral characteristics. J Electromyogr Kinesiol, 2008. 18(1): p. 35-43.
11. Dimitrova, N.A., et al., Estimate of M-wave changes in human biceps brachii during continuous
stimulation. J Electromyogr Kinesiol, 2005. 15(4): p. 341-8.
12. Mesin, L., R. Merletti, and A. Rainoldi, Surface EMG: the issue of electrode location. J
Electromyogr Kinesiol, 2009. 19(5): p. 719-26.
13. Shankar, S., R.E. Gander, and B.R. Brandell, Changes in the myoelectric signal (MES) power
spectra during dynamic contractions. Electroencephalogr Clin Neurophysiol, 1989. 73(2): p.
142-50.
14. Gonzalez-Izal, M., et al., EMG spectral indices and muscle power fatigue during dynamic
contractions. J Electromyogr Kinesiol, 2010. 20(2): p. 233-40.
15. Potvin, J.R., Effects of muscle kinematics on surface EMG amplitude and frequency during 2 1 2 3 4 5 6 7 8 9 10 11 12 13 14 15 16 17 18 19 20 21 22 23 24 25 26 27 28 29 30 31 32 33 34 35 36 37 38 39
fatiguing dynamic contractions. J Appl Physiol, 1997. 82(1): p. 144-51.
16. Ament, W., et al., Electromyogram median power frequency in dynamic exercise at medium
exercise intensities. Eur J Appl Physiol Occup Physiol, 1996. 74(1-2): p. 180-6.
17. Xie, H. and Z. Wang, Mean frequency derived via Hilbert-Huang transform with application to
fatigue EMG signal analysis. Comput Methods Programs Biomed, 2006. 82(2): p. 114-20.
18. Dimitrova, N.A., et al., Fatigue analysis of interference EMG signals obtained from biceps
brachii during isometric voluntary contraction at various force levels. J Electromyogr Kinesiol, 2009. 19(2): p. 252-8.
© 2011 by the authors; licensee MDPI, Basel, Switzerland. This article is an open access article distributed under the terms and conditions of the Creative Commons Attribution license (http://creativecommons.org/licenses/by/3.0/). 2 1 2 3 4 5 6 7 8 9 10 11