Work Environment and Psychosocial Factors Affecting Physical Activity Among Taiwanese Information Technology Professionals: A Structural Equation Modeling
Approach
Abstract
Objective: To examine the relationships among work environment, psychosocial factors, and
physical activity (PA) in information technology (IT) professionals. Methods: This was a cross-sectional survey of 576 IT professionals from three IT companies in Taiwan. Structural equation modeling was used to test a theoretically-supported model using Social Cognitive Theory, incorporating variables from the demand/control model. Results: Higher levels of PA were positively associated with supportive workplace environments, positive outcome expectations, and self-efficacy for PA. Self-efficacy partially mediated the effects of supportive workplace environments on PA. Job strain had an indirect effect on PA through self-efficacy. The final model accounted for 31% of the variance in PA. Conclusions: Work environment and psychosocial factors are both important. Workplace PA interventions directed toward
individuals’ self-efficacy and outcome expectations in the context of supportive environments may be useful.
The health benefits of physical activity (PA)1 and the health risks of sedentary
behavior2 have been widely documented. In the workplace setting, studies have demonstrated
positive associations between PA and better job performance,3–5 improved health,4,5 and reduced
absenteeism and health care costs.5–7 In contrast, sedentary behaviors (mainly sitting) have
contributed to negative health effects and increased health care costs. For example, workers whose jobs required long hours of sitting had two times the increased risk of cardiovascular disease than those whose jobs required physical effort.8 Workers who were moderately active (1–
2 times/week; 20 min/time) and very active (3 times/week; 20 min/time) had lower health care costs than sedentary (<1 time/week) workers.7
Despite an increased emphasis on the benefits of regular PA, a recent Internet survey revealed that information technology (IT) workers are the least active working population in Taiwan, with approximately 70% considering themselves to be physically inactive.9 Over the last
three decades, the IT services have emerged as one of the most important industries in the global economy. In Taiwan, the employment of IT workers increased from 65,499 in 2006 to 80,748 in 2009, and continued growth is expected.10 Furthermore, the ever-increasing global market
competition, rapid technological advances, and tight deadlines have made the IT profession a very demanding and stressful job requiring long hours that contribute to the sedentariness of IT workers.11 Because of the nature of their work, they may have a bigger problem than other office
workers.
Social Cognitive Theory
Physical activity behavior is influenced by a complex, interrelated set of determinants, including personal and environmental factors.12–14 Social Cognitive Theory15 addresses the
is thus suited for understanding the influence of personal (psychosocial, specifically self-efficacy and outcome expectations) and environmental (work environment, specifically supportive workplace environments and job strain) factors on PA of workers.
Personal Psychosocial Factors
Self-efficacy for PA is an individual’s judgment of his/her confidence in his/her ability to engage in regular PA despite various barriers.15 People are less likely to perform a behavior when
facing difficulties if they do not have confidence in their ability to do it and believe they can produce the desired outcomes by their actions.16 Self-efficacy has been the most widely
investigated variable in worker PA studies and has had a consistent positive correlation with PA.17–26 Outcome expectations for PA are an individual’s judgment of the likely consequences of
engaging in regular PA.15 Surprisingly, very few studies23,27 have examined the outcome
expectations of PA in workers, and even fewer23 have examined outcome expectations in
conjunction with self-efficacy. According to Williams and colleagues,28 outcome expectations
construct has been labeled and conceptualized differently across models, but all include expected outcomes of a behavior. Positive outcome expectations, perceived benefits and pros are
essentially the same concept, whereas negative outcome expectations, perceived barriers and cons are closely related and overlapping concepts. In studies of worker PA, most found that perceived benefits and pros of PA had small, positive associations with PA.18,21,23,24,26,27 Perceived
barriers and cons of PA were more consistently and negatively correlated with PA.17–19,21,23–27 Organizational and Individual Work Environment Factors
Few studies have examined the organizational work environment and results suggest a weak positive relationship with levels of PA.23,29,30 Supportive workplace environment was
relationship between supportive workplace environment and workplace PA was partially
mediated by self-efficacy in the cross-sectional23 and longitudinal31 analyses in a diverse sample
of Canadian workers (healthcare, education and city workers). Worksite policies supporting PA, such as subsidies for health club use and paid time for non-work-related PA, were positively related to leisure-time PA and work-break PA. Worksite environments supporting PA, such as having access to on site exercise facilities and a safe place to walk outside work, were positively related to leisure-time PA and work-break PA.30
Little is known about the relationship between work environment and outcome
expectations for PA. It is reasonable to speculate that a highly supportive workplace environment could influence workers by increasing their expectations for positive outcomes associated with PA. It could be part of the workplace culture.
In recent years, much attention has been given to the effects of working conditions (individual work environment) on PA or sedentary behavior. Karasek’s demand/control model,32
a widely used theory, posits that job strain results from the combined effects of high
psychological job demands and low control over work. The evidence for a relationship between PA and job demands, job control, and job strain (ratio of demands to control) is somewhat inconsistent and varied across gender33–37 and countries.37 In some studies passive jobs, high
strain jobs, and low job control had a relatively consistent relationship with low levels of PA in both sexes.35–37 In other studies job demands, job control, or job strain were not associated with
PA.18,22,38,39
Purpose and Hypotheses
In summary, with some exceptions (e.g., computer maintenance engineers, equipment engineers, etc.), IT workers are typically sedentary due to the nature of their jobs which may lead
to more serious problems for IT workers than other workers. However, no studies have explored the specific nature of PA and its determinants in IT workers. While most worker PA studies have examined psychosocial and individual work environment factors, few have focused on broader organizational work environment factors. The purpose of this study was to examine the
relationships among work environment (i.e., supportive workplace environments and job strain), psychosocial factors (i.e., outcome expectations and self-efficacy for PA), and PA in Taiwanese IT professionals. Examination of these relationships was guided by a conceptual model (Figure 1) using Social Cognitive Theory,15 incorporating variables from the demand/control model.32
Four key hypotheses form the model: (H1) Supportive workplace environments will have a positive effect on PA, outcome expectations, and self-efficacy for PA; (H2) Job strain will have a negative effect on PA; (H3) Outcome expectations and self-efficacy for PA will have a positive effect on PA; and (H4) Outcome expectations and self-efficacy for PA will mediate the effects of supportive workplace environments on PA (Figure 1).
Insert Figure 1 about here
METHODS Participants
A cross-sectional survey was conducted between March and April 2010. Participants were recruited from three IT companies in northern Taiwan. A sample of 735 IT professionals was drawn from a list of potential subjects (245 out of approximately 1,000 from each company). Eligible respondents were those who met the inclusion criteria: (a) full-time IT professionals who perform knowledge work in professional positions; (b) aged 18 years or older; (c) no physical limitations or medical problems that would prevent PA performance; and (d) not currently pregnant. We distributed 735 survey packages, each including an informed consent
letter, a self-administered questionnaire, a $3 gift card, and a return envelope. A total of two reminder e-mails were sent to all participants. The study was approved by the Institutional Review Board at the University of Michigan.
Of the 735 questionnaires distributed, 687 were returned and 620 met the eligibility criteria. However, 44 cases were disqualified because of missing data (n = 41) or overreporting (n = 3) on the Taiwan version of the International Physical Activity Questionnaire (IPAQ-Taiwan) long form,40 leaving a final response rate of 78.4% (N = 576). There was no statistically
significant difference between disqualified (n = 44) and qualified (n = 576) groups in regard to their demographic data.
Measures
Three instruments—the Perceived Workplace Environment Scale (PWES),23 the Positive
and Negative Outcome Expectations Scale (PNOES),41 and the Historical Physical Activity
Questionnaire (HPAQ)42,43 were translated into Chinese using a modified committee approach.44 Outcome Measure
Physical activity was measured with the 27-item IPAQ-Taiwan long form.40 The IPAQ
quantified moderate and vigorous intensity PA as well as walking in four domains (work-related, transport-related, domestic/yard work, and leisure-time PA) over the last 7 days. Sitting time was evaluated by hours of sitting time on a weekday and weekend day. Support for the reliability and validity of the questionnaire was provided by Liou in her study.45 The data were reported as
continuous measures according to IPAQ guidelines.46 The scores (METmin/week) were square
root transformed before analysis since the data were positively skewed. The PA latent factor in our structural analyses was defined by three indicators (and their corresponding factor loadings): walking (0.30), moderate PA (0.46), and vigorous PA (0.62).
Predictor Measures
Supportive workplace environment was measured with the Chinese version of the PWES (PWES-C; 6-item; Cronbach’s α = 0.88).47 The scale assesses workers’ perceptions of the extent
to which their workplace environment supports worker PA, and it includes six dimensions: individual, social, organizational, community, policy, and physical environment.23 Each item was
rated on a 5-point scale ranging from 1 (none) to 5 (a great amount). The supportive workplace environment latent factor was defined by four indicators and their corresponding factor loadings ranged from 0.63 to 0.79.
Job strain was measured by the Psychological Job Demands (α = 0.84) and Job Control Scale (α = 0.78), derived from the Chinese version of the Job Content Questionnaire.48,49 The
7-item Psychological Job Demands Scale was used to assess workload, pace of work, and
organizational constraints. A 9-item Job Control Scale was used to measure skill discretion (six items) and decision authority (three items).49 Each item was rated on a 4-point scale (1 = strongly disagree to 4 = strongly agree). Negative items were reverse scored. A sum of weighted item
scores and a standardized score were calculated for both subscales, respectively. To reflect the job strain, one observed variable was formed by the ratio of demands to control, with high scores indicating high degrees of job-related mental strain.
Self-efficacy for PA was measured with the 15-item Scale of Exercise Self-Efficacy (α = 0.93),19 which assesses the respondent’s confidence in engaging in regular PA (i.e., moderate or
vigorous PA for 30 minutes a day, at least 10 minutes at a time, 3 days a week) over the next three months in different situations or the presence of barriers. Participants rated their confidence on a 6-point scale (1 = not at all confident to 6 = completely confident). The scale used in this study replaced the term “exercise” with “PA” to reflect the outcome measure. The self-efficacy
for PA latent factor was defined by three indicators and their corresponding factor loadings ranged from 0.88 to 0.96.
Outcome expectations for PA were measured with the Chinese version of the 25-item PNOES. The scale assessed the expected outcomes of engaging in regular PA (as defined above) over the next three months. It is composed of two subscales: positive (12 items; α = 0.88) and negative (13 items; α = 0.86) outcomes from engaging in regular PA, arranged in a 5-point scale (1 = not at all likely to 5 = extremely likely). Following each expected outcome, respondents were then asked to indicate the value of each outcome on a 5-point scale (1 = not at all
important to 5 = extremely important). A rating of outcome likelihood was multiplied by its
corresponding rating of outcome value.41 Negative items were reverse scored. To reflect the
outcome expectations for PA, one observed variable was formed by the mean score that included both positive and negative items. High scores indicated high positive outcome expectations for PA.
Demographic and background covariates included gender, seniority, perceived health, work hours, and historical PA.42,43 Seniority was assessed based on the number of years
employed in the current position. Perceived health was measured with one item: “In general, would you say your health is excellent, very good, good, fair, or poor?” Work hours were measured by asking, “During the last whole week you worked, how many hours did you work (including working at home or on weekends)?” A Chinese version of the HPAQ was used to assess historical PA (i.e., work/occupation, walking/bicycling, home/household work, and exercise) and inactivity (i.e., using computer/watching TV/reading and sleeping) at age 20 and 30, using five questions with predefined response categories and an open question about sleeping hours.42,43 Two HPA scores (METh/day) at age 20 and 30 were used in the analysis. However,
because not all participants were over the age of 30, scores of HPA at age 20 were used for subjects aged 24–34, whereas scores of HPA at age 30 were used for those aged 35–60.
Analytic Procedures
Prior to data analyses, data were examined for accuracy, missing data, outliers, normality, linearity, and homoscedasticity. SPSS 18.0 for Windows was used for descriptive data analyses. Overall, incomplete data rates for most variables were less than 1%. Compared to respondents with complete data (n = 502), those with incomplete data displayed a trend toward high job strain and working longer hours (P < 0.05). To account for this difference, we imputed missing values using the expectation maximization algorithm of the EQS software.50 Possible company effects
were considered because ANOVA showed differences among companies in terms of supportive workplace environments, F (2, 573) = 76.4, P < 0.001. Two dummy variables (site B and site C) were created and included in the model as covariates, with site A as the reference group.
The role of work environment and psychosocial factors on PA were described as a structural model (Figure 2). Models were tested via structural equation modeling (SEM) analyses using the EQS 6.1 program.50 All analyses were performed on covariance matrices using
maximum likelihood estimation, with the Satorra-Bentler (S-B) scaling method employed to handle non-normal data (Mardia’s normalized estimate = 14.89)51. The S-B scaled χ2 and indices
were used to evaluate model fit: nonnormed fit index (NNFI), comparative fit index (CFI), Bollen’s (IFI) fit index, and root mean-square error of approximation (RMSEA). For fit indices, a value 0.95 and for the misfit RMSEA index, a value 0.06 indicate adequate fit. However, with large samples it is rare to find a nonsignificant χ2.50,51 To compare models, we used
calculations based on work by Satorra and Bentler.52 The modification indices for dropping and
by Baron and Kenny.53 The significance level was set at P 0.05. Our sample size for each SEM
analysis met requirements for minimal sample of 5–10 cases per model parameter.54
At the end of the survey, participants were given an opportunity to make
recommendations on how to promote PA for IT professionals in their company. The content analysis technique55 was used to analyze responses to this open-ended question and to quantify
the data. We first read the text line by line to generate categories that fit the data. The codes were attached to words or text fragments. They were then categorized to identify themes and
subthemes.
RESULTS Descriptive Information
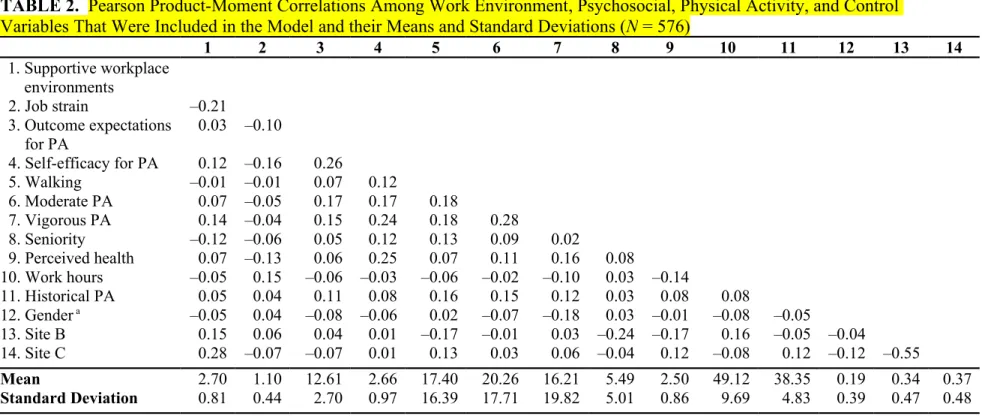
The sample consisted of 576 Taiwanese IT professionals from three IT companies. Subjects were mainly men (81%) and never married (57.6%) with a mean age of 33.7 years (range = 24–60). Nearly 61% of the respondents reported that they engaged in recommended levels of PA (e.g., 30 min/day of moderate-to-vigorous PA for 5 days/week); however, 8% did not engage in any PA for at least 10 minutes at a time. Average sitting time on a weekday and weekend day was 7.8 and 6.4 hours per day, respectively. Sample characteristics by gender and site are described in Table 1. Table 2 presents the means, standard deviations, and correlations among all variables included in the model.
Insert T able 1 about here Insert T able 2 about here
Measurement Model
Prior to testing the structural model specified in Figure 2, the adequacy of the
self-efficacy for PA, and PA) was tested. The test of the measurement model showed a good fit to the data, S-B χ2 (df = 32, N = 576) = 37.1, P = 0.24; NNFI = 0.99, CFI = 0.99, IFI = 0.99, and
RMSEA = 0.02 (90% CI: 0.00–0.04). It was thus used in testing the structural model.
Testing the Proposed Model of Physical Activity in IT Professionals
The structural model was tested to address the four key hypotheses described earlier. According to the modification indices, three directional paths (one from self-efficacy to outcome expectations, one from job strain to self-efficacy, and another from site C to outcome
expectations) and one correlation (between work hours and historical PA) that are conceptually and/or empirically meaningful were added to the model individually, and the model was rerun each time. However, two nonsignificant paths from site B to self-efficacy and from gender to outcome expectations were removed, and the model was re-estimated. The initial simple model fit reasonably well, although the nested model comparisons indicated that all the modified models fit significantly better than the initial model at P < 0.05. Figure 2 displays the SEM results of the final model and estimates of its parameters. The values along the paths represent standardized path coefficients (β). The final model showed a good fit to the data: S-B χ2 (df =
126, N = 576) = 272.3, P = 0.00; NNFI = 0.94, CFI = 0.96, IFI = 0.96, and RMSEA = 0.05 (90% CI: 0.04–0.05). It accounted for 31% of the variance in PA.
Insert Figure 2 about here
The findings provide full support for H3, but only partial support for H1 and H4 in a model that included seven covariates. Namely, outcome expectations and self-efficacy had a positive effect on PA (H3). Supportive workplace environments had a positive effect on PA and self-efficacy (H1). Self-efficacy mediated the effects of supportive workplace environments on PA (H4). Results failed to support the hypotheses that a supportive workplace environment has a
positive effect on outcome expectations (H1); job strain has a negative effect on PA (H2); and outcome expectations mediate the effects of supportive workplace environments on PA (H4).
The effects of covariates on PA and/or the other constructs are also displayed in Figure 2. As expected, the predictors of PA were supportive workplace environments, outcome
expectations, self-efficacy, perceived health, work hours, historical PA, and being male (Ps < 0.001–0.05). Variables that contributed to the variance in outcome expectations were self-efficacy, work hours, historical PA, and site C (Ps < 0.001–0.05). Variables that contributed to the variance in self-efficacy were supportive workplace environments, job strain, seniority, and perceived health (Ps < 0.001–0.05). Variables that contributed to the variance in supportive workplace environments were site B, site C, and perceived health (Ps < 0.001–0.05). Variables that contributed to the variance in job strain were perceived health and work hours (Ps < 0.05). In brief, the major contributors to PA (in descending order of total effect: 0.30–0.18) were self-efficacy, historical PA, perceived health, and supportive workplace environments.
Regarding possible mediating effects, seven significant indirect effects on PA were found. Self-efficacy partially mediated the effect of supportive workplace environments (Sobel test = 2.05, P < 0.05) and perceived health (Sobel test = 3.12, P < 0.01) on PA. Although high perceptions of supportive workplace environments remained significantly related to high levels of PA when self-efficacy was controlled, the magnitude of the association was reduced by 14.8% (β was reduced from 0.18, P < 0.01 to 0.15, P < 0.05). Further, self-efficacy fully mediated the effect of seniority on PA, as seniority had no direct effect on PA when self-efficacy was controlled. On the other hand, the influence of self-efficacy on PA was partially mediated by outcome expectations (Sobel test = 2.52, P = 0.01). Additionally, job strain had an indirect effect on PA via efficacy (P < 0.05), although it had no direct effect on PA in the absence of
self-efficacy. Both site B (P < 0.01) and site C (P < 0.05) had an indirect effect on PA via supportive workplace environments, although they had no direct effect on PA in the absence of supportive workplace environments.
Additional Analysis of Qualitative Results
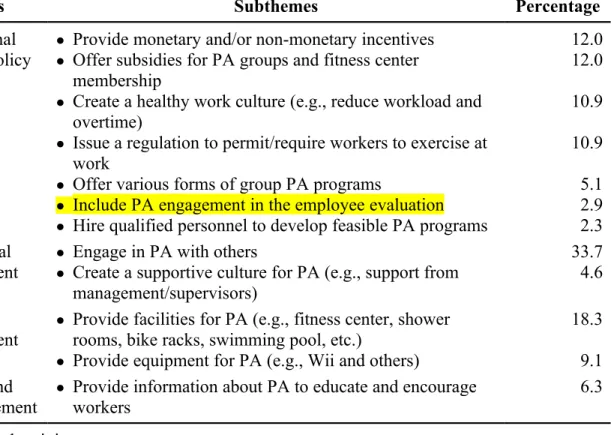
Table 3 summarizes the qualitative responses to an open-ended question about how to promote PA for IT professionals in their company. The response rate for the question was 30.4% (175/576). The data were categorized into four themes and several subthemes on the basis of how frequently the theme was mentioned. The four themes derived from the participant
recommendations included organizational support/policy, socio-cultural environment, physical environment, and education and encouragement.
Insert T able 3 about here
DISCUSSION
Results presented in our model (Figure 2) indicated that supportive workplace
environments, outcome expectations, and self-efficacy had a positive effect on PA. The influence of supportive workplace environments on PA was partially mediated by self-efficacy. The results suggest that IT workers are not different from other office workers and lend support to the general framework of Social Cognitive Theory for developing interventions to promote PA in Taiwanese IT professionals.
The findings of this study support a growing body of evidence that self-efficacy is the most influential determinant of PA among employees.17–26 Participants with high self-efficacy for
PA tended to expect more positive outcomes for PA than did those with low self-efficacy. High positive outcome expectations led to high levels of PA. This is consistent with previous research that found a positive relationship between perceived benefits or pros of PA and the level of
PA18,21,23,24,26,27 and a negative relationship between perceived barriers or cons of PA and the level
of PA.17–19,21,23–27
Our results indicate that a supportive workplace environment can contribute directly to higher levels of PA, and this is in line with earlier studies of other types of workers.23,29,30 The
results of the present study were also similar to the findings of Prodaniuk et al.23 and Plotnikoff
et al.,31 who found that self-efficacy partially mediated the effect of supportive workplace
environment on workplace PA in cross-sectional and longitudinal analyses, respectively. It is conceivable that workplace environments could affect self-efficacy through social persuasion and modeling (vicarious experience)15 within the workplace. In addition, there could be an
interaction type of effect where people with high self-efficacy for PA were more likely to respond to a positive workplace environment and to take advantage of the resources.
Supportive workplace environments and outcome expectations were not related. This has not been examined in previous research. It is possible that there is no relationship between the two or that a highly supportive workplace environment is required before a physically active lifestyle becomes part of the corporate culture and influences outcome expectations for PA.
We did not find a direct link between job strain and PA and this is consistent with previous research.38 Others found that neither job demands nor job control was associated with
PA.18,22,38,39 This was likely due to lack of variance in job strain in our particular working group.
Another explanation might be that individual workers coped with job stress differently. For example, some workers might have coped with job stress by engaging in more PA, whereas others might be overwhelmed by the job stress and unable to find time or energy to be more active. However, we did find that job strain had an indirect effect on PA through self-efficacy. Likewise, Payne et al.,39 using a sample from a U.K. computer company, expressed the similar
idea that job demands influenced exercise indirectly by reducing one’s perceptions of control over exercise.
Other factors that influenced PA include historical PA, gender, work hours, and perceived health. Our findings are consistent with others56,57 in showing that people who were
physically active during young adulthood were more likely to be active later in life. However, very few studies have examined how historical PA during young adulthood (ages 20–30) influences current PA or have assessed PA over a period of time longer than one year.
In addition, men were more likely than women to engage in PA, particularly vigorous PA. This finding is supported by previous studies27,33,36 and suggests the need to tailor
interventions differently for men and women.
Results of this study also demonstrated that employees who worked longer hours were less likely to engage in PA. This finding echoes prior research.58,59 However, Lallukka et al.37 did
not find a relationship between these two variables. This inconsistency may be due to the fact that Lallukka and colleagues defined or categorized working overtime differently than did the other two studies,58,59 while we treated work hours as a continuous variable in analyses.
Finally, perceived health appeared to have a positive impact on PA, directly and indirectly, mainly via the increase in one’s ability to overcome barriers to being physically active. This extends prior research suggesting that perceived poor health was associated with insufficient PA.60 Yet, it is possible that higher levels of PA contributed to positive health
outcomes.4
Study Strengths and Limitations
A unique feature of this study is that it used a theoretical approach to incorporate job strain variables from the demand/control model into Social Cognitive Theory to predict PA in IT
professionals. In addition, to our knowledge, it is the first study in the field of worker PA to employ SEM to examine the complex interrelationship among independent variables and to account for measurement error, thus producing more accurate estimates of the path coefficients and testing of meditational effects.53 Further, because our overall response rate was very high
(93.5%), the possibility of selection bias is expected to be low.
There are some limitations of the present study. First, due to the cross-sectional design, relationships among variables should be treated with some caution and considered tentative. Second, our sample was limited to IT professionals from three IT companies in northern Taiwan. This limits the generalizability of the findings to other types of businesses and different
geographic locations of Taiwan. Third, our data were based on self-report and might be subject to recall and response bias and contaminated by common factors (e.g., negative affectivity and social desirability). However, confidentiality and anonymity were maintained by not associating surveys with any participant’s name or identification number and not requiring a signature on the consent form. Finally, the IPAQ long form has been found to overestimate PA. It is because of its assessment of the multiple domains of PA, compared to the IPAQ short form and other measures that assess leisure-time PA alone.61
Implications for Practice and Policy
First and foremost, our quantitative results suggest that interventions directed toward increasing individuals’ confidence in their ability to overcome barriers to being physically active and positive expected outcomes for PA in the context of supportive workplace environments may be useful. As emphasized by some authors, interventions targeting individual level efforts are more likely to produce success if integrated into supportive environments.62,63 Additionally,
redesigning jobs to reduce job strain and long hours may influence work culture and reduce barriers to exercise.
Our qualitative results provide ideas for how to create supportive environments/policies that encourage and support employee PA. Suggestions included: (a) organizational support/ policy: provide monetary/non-monetary incentives and subsidies for exercise groups or fitness center membership, create a healthy work culture with less workload and not encouraging overtime, and issue a regulation to permit time for non-work-related PA at work; (b) socio-cultural environment: create opportunities for employees to engage in PA with others (e.g., offer various indoor/outdoor group PA programs and hold worksite exercise competitions) and create a supportive culture for PA (e.g., support from management/supervisors); and (c) physical environment: offer more facilities/equipment for PA that employees can easily access to become more physically active
Future Directions
To further test the proposed theoretical framework, the following recommendations should be considered. A larger number of corporations using a longitudinal design are needed to fully explore the effects of workplace environments. To link worker health to business outcomes, further development and expansion of this work would include the short- and long-term effects of PA both on the workers and the organization. It is necessary to examine the associations of behavior patterns with biomarkers and use accelerometers to objectively measure the levels of PA and sedentary time, and cardio-metabolic biomarkers (e.g., waist circumference, HDL cholesterol, C-reactive protein, triglycerides, plasma glucose, and insulin).64
In conclusion, work environment and psychosocial factors are both important. The quantitative findings of this study, along with the accompanying qualitative recommendations
from the study participants, provide a useful foundation for employers, program developers, policy makers, and researchers in developing interventions to promote PA for health for IT professionals.
ACKNOWLEDGEMENTS
This study was supported by grants from (a) the American Association of Occupational Health Nurses Foundation; (b) the Midwest Nursing Research Society; (c) Sigma Theta Tau International, Rho Chapter; and (d) the University of Michigan Rackham Graduate School. The content is solely the responsibility of the authors and does not necessarily represent the official views of the funding agencies. We would like to thank the statistical support provided by Dr. Amiram Vinokur from the Institute for Social Research and Laura Klem and Brady West from Center for Statistical Consultation and Research, University of Michigan. Special thanks to Dr. Kimberlee Gretebeck for her support in the early development of this work. Our sincere thanks go to occupational health professionals and department assistants from the three companies for their help in the data collection, and to all the IT professionals who participated in this research.
REFERENCES
1. U.S. Department of Health and Human Services. 2008 Physical Activity Guidelines for Americans. http://www.health.gov/PAGuidelines/pdf/paguide.pdf. Accessed March 1, 2009. 2. Owen N, Healy GN, Matthews CE, Dunstan DW. Too much sitting: the population health
science of sedentary behavior. Exerc Sport Sci Rev. 2010;38:105–113.
3. Pronk NP, Martinson B, Kessler RC, Beck AL, Simon GE, Wang P. The association between work performance and physical activity, cardiorespiratory fitness, and obesity. J Occup
Environ Med. 2004;46:19–25.
4. Burton WN, McCalister KT, Chen CY, Edington DW. The association of health status, worksite fitness center participation, and two measures of productivity. J Occup Environ
Med. 2005;47:343–351.
5. Shephard RJ. A critical analysis of work-site fitness programs and their postulated economic benefits. Med Sci Sports Exerc. 1992;24:354–370.
6. Baun WB, Bernacki EJ, Tsai SP. A preliminary investigation: effect of a corporate fitness program on absenteeism and health care cost. J Occup Med. 1986;28:18–22.
7. Wang F, McDonald T, Champagne LJ, Edington DW. Relationship of body mass index and physical activity to health care costs among employees. J Occup Environ Med. 2004;46:428– 436.
8. Hamilton MT, Healy GN, Dunstan DW, Zderic TW, Owen N. Too little exercise and too much sitting: inactivity physiology and the need for new recommendations on sedentary behavior. Curr Cardiovasc Risk Rep. 2008;2:292–298.
9. Taiwan 1111 Job Bank. Physically inactive group in the workplace—a survey of physical activity habits among office workers. http://project.1111.com.tw/zone/pr/headline.asp? autono=1702. Accessed February 5, 2011. (in Chinese)
10. Taiwan Science and Technology Advisory Group, Executive Yuan. Survey on supply and
demand of manpower in the information technology service industry. Taipei: Taiwan Science
and Technology Advisory Group of Executive Yuan; 2007. (in Chinese)
11. Taiwan Council of Labor Affairs, Executive Yuan. Career guide to industries: computer system design services industry. http://statdb.cla.gov.tw/careerguide/ind/ind_detail.asp? section_id=1&id_no=K072. Accessed February 14, 2009. (in Chinese)
12. Brug J, Oenema A, Ferreira I. Theory, evidence and intervention mapping to improve behavior nutrition and physical activity interventions. Int J Behav Nutr Phys Act. 2005;2:2. 13. Kremers SP, de Bruijn GJ, Visscher TL, van Mechelen W, de Vries NK, Brug J.
Environmental influences on energy balance-related behaviors: a dual-process view. Int J
Behav Nutr Phys Act. 2006;3:9.
14. Spence JC, Lee RE. Toward a comprehensive model of physical activity. Psychol Sport
Exerc. 2003;4:7–24.
15. Bandura A. Social foundations of thought and action: a social cognitive theory. Englewood Cliffs, N.J.: Prentice-Hall; 1986.
16. Bandura A. Health promotion by social cognitive means. Health Educ Behav. 2004;31:143– 164.
17. Chen CM, Chang M. Exercise behavior and related factors in career women—the case of a bank in Taipei City. J Nurs Res. 2004;12:180–190.
18. Kaewthummanukul T, Brown KC, Weaver MT, Thomas RR. Predictors of exercise participation in female hospital nurses. J Adv Nurs. 2006;54:663–675.
19. Kao YH, Lu CM, Huang YC. Impact of a transtheoretical model on the psychosocial factors affecting exercise among workers. J Nurs Res. 2002;10:303–310.
20. Lee YS, Huang YC, Kao YH. Physical activities and correlates of clinical nurses in Taipei municipal hospitals. J Nurs Res. 2005;13:281–292.
21. Nishida Y, Suzuki H, Wang D-H, Kira S. Psychological Correlates of Physical Activity and Exercise in Japanese Male Employees. Int. J. Sport Health Sci. 2004;2:136–144.
22. Payne N, Jones F, Harris P. The impact of working life on health behavior: the effect of job strain on the cognitive predictors of exercise. J Occup Health Psychol. 2002;7:342–353. 23. Prodaniuk TR, Plotnikoff RC, Spence JC, Wilson PM. The influence of self-efficacy and
outcome expectations on the relationship between perceived environment and physical activity in the workplace. Int J Behav Nutr Phys Act. 2004;1:7.
24. Purath J. Comparison of the traits of physically active and inactive women. J Am Acad Nurse
Pract. 2006;18:234–240.
25. Sassen B, Kok G, Schaalma H, Kiers H, Vanhees L. Cardiovascular risk profile: cross-sectional analysis of motivational determinants, physical fitness and physical activity. BMC
Public Health. 2010;10:592.
26. Tavares LS, Plotnikoff RC, Loucaides C. Social-cognitive theories for predicting physical activity behaviours of employed women with and without young children. Psychol Health
Med. 2009;14:129–142.
27. Steinhardt MA, Dishman RK. Reliability and validity of expected outcomes and barriers for habitual physical activity. J Occup Med. 1989;31:536–546.
28. Williams DM, Anderson ES, Winett RA. A review of the outcome expectancy construct in physical activity research. Ann Behav Med. 2005;29:70–79.
29. Dodson EA, Lovegreen SL, Elliott MB, Haire-Joshu D, Brownson RC. Worksite policies and environments supporting physical activity in midwestern communities. Am J Health Promot. 2008;23:51–55.
30. Lucove JC, Huston SL, Evenson KR. Workers' perceptions about worksite policies and environments and their association with leisure-time physical activity. Am J Health Promot. 2007;21:196–200.
31. Plotnikoff RC, Pickering MA, Flaman LM, Spence JC. The role of self-efficacy on the relationship between the workplace environment and physical activity: a longitudinal mediation analysis. Health Educ Behav. 2010;37:170–185.
32. Karasek RA. Job demands, job decision latitude, and mental strain: implications for job redesign. Admin Sci Quart. 1979;24:285–308.
33. Brisson C, Larocque B, Moisan J, Vezina M, Dagenais GR. Psychosocial factors at work, smoking, sedentary behavior, and body mass index: a prevalence study among 6995 white collar workers. J Occup Environ Med. 2000;42:40–46.
34. Gimeno D, Elovainio M, Jokela M, De Vogli R, Marmot MG, Kivimaki M. Association between passive jobs and low levels of leisure-time physical activity: the Whitehall II cohort study. Occup Environ Med. 2009;66:772–776.
35. Hellerstedt WL, Jeffery RW. The association of job strain and health behaviours in men and women. Int J Epidemiol. 1997;26:575–583.
36. Kouvonen A, Kivimaki M, Elovainio M, Virtanen M, Linna A, Vahtera J. Job strain and leisure-time physical activity in female and male public sector employees. Prev Med. 2005;41:532–539.
37. Lallukka T, Lahelma E, Rahkonen O, et al. Associations of job strain and working overtime with adverse health behaviors and obesity: evidence from the Whitehall II Study, Helsinki Health Study, and the Japanese Civil Servants Study. Soc Sci Med. 2008;66:1681–1698. 38. Landsbergis PA, Schnall PL, Deitz DK, Warren K, Pickering TG, Schwartz JE. Job strain
and health behaviors: results of a prospective study. Am J Health Promot. 1998;12:237–245. 39. Payne N, Jones F, Harris PR. The impact of job strain on the predictive validity of the theory of planned behaviour: an investigation of exercise and healthy eating. Br J Health Psychol. 2005;10:115–131.
40. Taiwan Bureau of Health Promotion, Department of Health. Taiwan Version of the International Physical Activity Questionnaire: Long Form.
http://www.bhp.doh.gov.tw/BHPnet/Portal/. Accessed June 20, 2009. (in Chinese) 41. Rovniak LS, Anderson ES, Winett RA, Stephens RS. Social cognitive determinants of
physical activity in young adults: a prospective structural equation analysis. Ann Behav Med. 2002;24:149–156.
42. Norman A, Bellocco R, Bergstrom A, Wolk A. Validity and reproducibility of self-reported total physical activity—differences by relative weight. Int J Obes Relat Metab Disord. 2001;25:682–688.
43. Orsini N, Bellocco R, Bottai M, Pagano M, Wolk A. Reproducibility of the past year and historical self-administered total physical activity questionnaire among older women. Eur J
44. Harkness J, Pennell B-E, Schoua-Glusberg A. Survey questionnaire translation and assessment. In Presser S, Rothgeb JM, Couper MP, et al., eds. Methods for Testing and
Evaluating Survey Questionnaires. New York: John Wiley & Sons, Inc.; 2004:453–473.
45. Liou YM. Development and Verification of Validity and Reliability of the Taiwan Version of
International Physical Activity Questionnaires. Doctoral Dissertation, National Taiwan
University, Taipei; 2004. (in Chinese)
46. IPAQ Research Committee. Guidelines for Data Processing and Analysis of the International Physical Activity Questionnaire (IPAQ)—Short and Long Forms. http://www.ipaq.ki.se/ scoring.pdf. Accessed June 20, 2009.
47. Lin YP, Kao TS, McCullagh MC, Edington DW, Larson JL. Translation and psychometric properties of the Chinese version of the Perceived Workplace Environment Scale in Taiwanese information technology professionals. J Occup Health. 2012. In press. 48. Cheng Y, Luh WM, Guo YL. Reliability and validity of the Chinese version of the Job
Content Questionnaire in Taiwanese workers. Int J Behav Med. 2003;10:15–30.
49. Yeh WY, Cheng Y, Chen MJ, Chiu WH. Development and validation of an occupational burnout inventory. Taiwan J Public Health. 2008;27:349–364. (in Chinese)
50. Bentler PM. EQS 6 structural equations program manual. Encino, CA: Multivariate Software, Inc; 2006.
51. Finney SJ, DiStefano C. (2006). Non-normal and categorical data in structural equation modeling. In: Hancock GR, Mueller RO, eds. Structural Equation Modeling: A Second
Course. Greenwich, CT: Information Age Publishing; 2006:269–314.
52. Satorra A, Bentler PM. A scaled difference chi-square test statistic for the moment structure analysis. Psychometrika. 2001;66:507–514.
53. Baron RM, Kenny DA. The moderator-mediator variable distinction in social psychological research: conceptual, strategic, and statistical considerations. J Pers Soc Psychol.
1986;51:1173–1182.
54. Bentler PM, Chou C. Practical issues in structural modeling. Sociol Method Res. 1987;16:78– 117.
55. Berg BL. Qualitative research methods for the social sciences. Boston: Allyn and Bacon; 1998.
56. Conroy MB, Cook NR, Manson JE, Buring JE, Lee IM. Past physical activity, current physical activity, and risk of coronary heart disease. Med Sci Sports Exerc. 2005;37:1251– 1256.
57. Lee IM, Paffenbarger RS, Jr., Hsieh CC. Time trends in physical activity among college alumni, 1962-1988. Am J Epidemiol. 1992;135:915–925.
58. Artazcoz L, Cortes I, Escriba-Aguir V, Cascant L, Villegas R. Understanding the relationship of long working hours with health status and health-related behaviours. J Epidemiol
Community Health. 2009;63:521–527.
59. Schneider S, Becker S. Prevalence of physical activity among the working population and correlation with work-related factors: results from the first German National Health Survey. J
Occup Health. 2005;47:414–423.
60. Burton NW, Turrell G. Occupation, hours worked, and leisure-time physical activity. Prev
Med. 2000;31:673–681.
61. Craig CL, Marshall AL, Sjostrom M, et al. International physical activity questionnaire: 12-country reliability and validity. Med Sci Sports Exerc. 2003;35:1381–1395.
62. Golaszewski T, Allen J, Edington D. Working together to create supportive environments in worksite health promotion. Am J Health Promot. 2008;22:1–10, iii.
63. Pronk NP, Kottke TE. Physical activity promotion as a strategic corporate priority to improve worker health and business performance. Prev Med. 2009;49:316–321.
64. Healy GN, Matthews CE, Dunstan DW, Winkler EA, Owen N. Sedentary time and cardio-metabolic biomarkers in US adults: NHANES 2003-06. Eur Heart J. 2011;32:590–597.
Figure Captions
FIGURE 1. Hypothesized workplace physical activity model.
FIGURE 2. Structural model of the effects of work environment and psychosocial factors on
physical activity.
Rectangles across the top of the figure are covariates; ellipses represent latent factors; rectangles within the figure represent observed variables.
TABLE 1. Characteristics of the 576 IT Professionals Recruited from Three IT Companies in
Northern Taiwan by Gender and Site
Variable Men (n = 467) Women (n =109) Site A (n = 169) Site B (n = 196) Site C (n = 211) M SD M SD M SD M SD M SD Age (year) 33.8 6.1 33.1 5.9 36.4 7.9 32.1 4.3 33.1 5.1 Seniority (year) 5.4 4.9 5.8 5.5 7.7 7.0 3.8 2.8 5.3 4.0 Work hours (h/wk) 49.5 9.9 47.6 8.7 47.9 7.5 51.2 11.7 48.1 8.9
IPAQ total physical activity (METmin/wk) Work-related
Transport-related Domestic/yard work Leisure time physical activity
2067 672 163 382 849 2167 1372 384 684 1320 1441 212 238 406 584 1476 500 428 775 833 1799 563 249 330 656 1941 1357 405 629 939 1841 347 139 358 996 2179 897 430 686 1629 2168 824 155 458 729 2050 1438 339 765 1014
Sitting hours (h/day) 7.3 2.6 8.2 2.3 7.4 2.4 8.1 2.4 6.8 2.6
HPA at age 20 (METh/d) 40.2 5.0 38.7 5.0 39.6 4.9 39.5 5.1 40.4 5.1 HPA at age 30 (METh/d) 36.0 4.5 35.1 4.1 36.1 4.5 34.8 3.4 36.5 4.9
Frequency (percentage)
Education
Senior high/vocational school Junior college
College/university Graduate school and above
0.2 13.3 49.1 37.3 0.9 13.8 59.6 25.7 0.6 23.8 51.8 23.8 0 11.7 61.2 27.0 0.5 6.6 41.2 51.7 Job title Assistant engineer Associate engineer Engineer
Senior/chief/senior advisory engineer Supervisor/section manager/chief (Associate) manager, skilled/project/
senior manager (Associate) director 0.9 1.5 72.4 5.4 3.9 15.2 0.9 4.6 0 75.2 1.8 3.7 13.8 0.9 2.4 0 68.0 1.8 1.8 23.1 3.0 2.0 0 68.4 9.7 6.6 13.3 0 0.5 3.3 81.0 2.4 2.8 10.0 0 Body mass index (kg/m2)
Underweight (<18.5) Normal weight (18.5–23.99) Overweight (24.0–26.99) Obese (27.0) 1.3 46.5 34.2 18.1 15.6 70.6 10.1 3.7 3.0 50.0 31.0 16.1 5.6 56.6 21.4 16.3 3.3 46.7 36.2 13.8 Perceived health Poor Fair Good Very good Excellent 8.4 47.4 31.3 11.6 1.3 9.2 50.5 26.6 11.0 2.8 6.5 47.3 30.8 14.2 1.2 13.8 53.3 24.6 5.6 2.6 5.2 43.6 35.5 14.7 0.9 Smoking status Current nonsmoker Current smoker Did not answer
81.6 15.6 2.8 94.5 1.8 3.7 85.8 8.9 5.3 83.2 15.3 1.5 83.4 14.2 2.4 M, mean; SD, standard deviation; IPAQ, Taiwan version of the International Physical Activity Questionnaire long form; HPA, historical physical activity; MET, metabolic equivalent.
TABLE 2. Pearson Product-Moment Correlations Among Work Environment, Psychosocial, Physical Activity, and Control
Variables That Were Included in the Model and their Means and Standard Deviations (N = 576)
1 2 3 4 5 6 7 8 9 10 11 12 13 14 1. Supportive workplace environments 2. Job strain –0.21 3. Outcome expectations for PA 0.03 –0.10 4. Self-efficacy for PA 0.12 –0.16 0.26 5. Walking –0.01 –0.01 0.07 0.12 6. Moderate PA 0.07 –0.05 0.17 0.17 0.18 7. Vigorous PA 0.14 –0.04 0.15 0.24 0.18 0.28 8. Seniority –0.12 –0.06 0.05 0.12 0.13 0.09 0.02 9. Perceived health 0.07 –0.13 0.06 0.25 0.07 0.11 0.16 0.08 10. Work hours –0.05 0.15 –0.06 –0.03 –0.06 –0.02 –0.10 0.03 –0.14 11. Historical PA 0.05 0.04 0.11 0.08 0.16 0.15 0.12 0.03 0.08 0.08 12. Gender a –0.05 0.04 –0.08 –0.06 0.02 –0.07 –0.18 0.03 –0.01 –0.08 –0.05 13. Site B 0.15 0.06 0.04 0.01 –0.17 –0.01 0.03 –0.24 –0.17 0.16 –0.05 –0.04 14. Site C 0.28 –0.07 –0.07 0.01 0.13 0.03 0.06 –0.04 0.12 –0.08 0.12 –0.12 –0.55 Mean 2.70 1.10 12.61 2.66 17.40 20.26 16.21 5.49 2.50 49.12 38.35 0.19 0.34 0.37 Standard Deviation 0.81 0.44 2.70 0.97 16.39 17.71 19.82 5.01 0.86 9.69 4.83 0.39 0.47 0.48
PA, physical activity.
a 0 = men; 1 = women.
TABLE 3. Participant Recommendations for Promoting Physical Activity for IT Professionals
in their Company (n = 175)
Themes Subthemes Percentage
Organizational support/policy
● Provide monetary and/or non-monetary incentives
● Offer subsidies for PA groups and fitness center membership
● Create a healthy work culture (e.g., reduce workload and
overtime)
● Issue a regulation to permit/require workers to exercise at
work
● Offer various forms of group PA programs
● Include PA engagement in the employee evaluation
● Hire qualified personnel to develop feasible PA programs
12.0 12.0 10.9 10.9 5.1 2.9 2.3 Socio-cultural environment
● Engage in PA with others
● Create a supportive culture for PA (e.g., support from
management/supervisors)
33.7 4.6 Physical
environment
● Provide facilities for PA (e.g., fitness center, shower rooms, bike racks, swimming pool, etc.)
● Provide equipment for PA (e.g., Wii and others)
18.3 9.1 Education and
encouragement
● Provide information about PA to educate and encourage
workers
6.3 PA, physical activity.