Journal of Environmental Management (I 995) 43, 49-66
Using Data Envelopment Analysis to Measure the Achievement and
Change of Regional Development in Taiwan
Pao-Long Chang,* Shiuh-Nan Hwangt and Wen-Ying Cheng*
*Institute of Management Science, National Chiao Tung University, 114, 4F,, Sec. 1, Chung-Hsiao W. Road, Taiwan, Republic of China and tDepartment of Business Administration, National Yunlin Institute of Technology, Taiwan, Republic of China
Received 8 November 1993
The purpose of this paper is to extend the use of the data envelopment analysis (DEA) approach, developed by Charnes, Cooper and Rhodes, and which proposes a mathematical programming model for measuring the relative effectiveness of an organization, which is used in evaluating the relative achievement of regional developments in 23 administrative regions of Taiwan in 1990. At the same time, this paper also extends the model for measuring the relative effectiveness of an organization to become a model for measuring the effectiveness change of an organization by merging it with the Malmquist productivity approach, as expressed by F/ire et al. (1985, The Measurement of Efficiency. Boston: Kluwer-Nijhoft), and uses the model to determine whether the relative change of the regional development of the 23 administrative regions in Taiwan moved forwards or backwards between 1983 and 1990. The model in this paper can be used to measure the relative effectiveness and relative effectiveness change of an organization under multiple criteria, wherein each criterion represents a familiar performance ratio. The case in this paper also can provide useful information for the formulation of a regional development plan of Taiwan.
Keywords: data envelopment analysis, regional development, efficiency, effectiveness, effectiveness change.
1. Introduction
The ultimate objective o f economic development is to increase the welfare o f a nation's citizens, and improve the living environment. Since h u m a n activities are closely related to the development o f industries, and deeply affected by regional development, the ways to measure the conditions o f regional development are absolutely an essential subject in the establishment o f a nation's public policies.
Over the past four decades o f rapid development o f the Taiwan area, the e c o n o m y has grown at an annual average o f 8"9%; this real rate o f growth, which encompasses the total increased production o f goods and heightened value o f labour, indicates that production t o d a y a m o u n t s to 17 times what it was 40 years ago. At this time o f steady
49
50 DEA and regional development economic advancement and rapid increasing affluence, however, the nation is faced with a number of problems. The most serious of these are economic imbalance and a loss of social order, a failure of infrastructural construction to keep pace with rapid economic development, and a general deterioration of the living environment.
Although the economy has maintained a high level of prosperity and society has become more affluent day by day, the inability of infrastructural construction to keep pace with economic development in recent years has given rise to the emergence of economic imbalances and disorders one after the other, especially traffic congestion, environmental pollution, inferior residential quality, noise, litter, uncertain drinking water safety and deteriorating public security, as well as inadequate cultural and recreational facilities and a decline of the traditional Chinese ethic. All of these problems indicate that the R.O.C. in Taiwan is faced with a developmental bottleneck: "poverty in the midst of affluence".
The Republic of China in Taiwan is now going through a stage of socio-economic transition. As an advisory agency, the Council of Economic Planning and Development (CEPD) of the Executive Yuan is responsible for the design, review, co-ordination and evaluation of the nation's economic development. To solve thoroughly the problems of economic imbalance and social disorder mentioned above, and to accelerate the modernization of the country, the council placed the goals of "pursuing balanced regional development" and "improving the quality of life" among the top priorities of the policies involving the formulation of the Six-year National Development Plan started in 1989. The council hopes to strengthen infrastructural construction in slower development regions, solidify facilities in transportation and communications systems, housing, schools, cultural establishment, medical care, and reduce the development differences among different regions.
The implementation of balanced regional development requires a tremendous amount of money. The resources have to be used effectively. If the relative conditions of the regional development of each region can be learned in advance, useful information can be provided for the formulation of a balanced regional development plan. While formulating the regional development plans, the CEPD collects such indices of urban and regional development as population density, urban planned area as percentage of the total area, piped water supply of population served, number of local telephone subscribers per 100 people, number of physicians per 10 000 people, number of copies of newspapers and magazines sold per 1000 people, the average income per capita, and so on (Council for Planning and Development, 1990). These indicators covering the aspects of population, public utilities, transportation and communication, public health, education and culture, and regional economy help the CEPD to understand the current conditions of the development in each region.
Nevertheless, the various indicators of each region often fail to point to the same direction. For example, for a certain region, one indicator may be high, but another indicator may be very low. Therefore, it is necessary to add weight on the various indicators to obtain a compositive indicator for further understanding of the current conditions of the regional development of each region. The major problem, then, is how the various indicators should be weighted. An arbitrary attribution of weight usually ends up as a victim of subjectivity.
This paper extends the uses of DEA approach developed by Charnes et al. (1978), and simplifies the multiple performance indicators into a compositive indicator to measure the current achievement of the regional development in all county and urban regions of Taiwan. At the same time, the paper proposes a model for measuring the
P.-L. Chang
e t al. Penghu E o q Taipei M . ~ - Keelung C. f-x.... , pei P J lHsinchu C ~ ~ " ~ .
, ' ~ / ~# H s i n ~ u P'~ Hma P. )
/
• chunlf - ;
Taichung ''~ g . ~R
HualienE
/
Y \S/A,
.__... • 'raitung R Tainan E "~ / I Kaohsiung E Pingtung I.Figure 1. Jurisdiction of Taiwan area.
%
Boundary of prefectures and cities
51
effectiveness change by combining the DEA approach with the Malmquist productivity
approach expressed by F~ire et al. (1992). This model is applied to evaluate the change
of the regional development of the Taiwan area, and also serve as a basis to determine the priorities of all county and urban regions in the Taiwan area for regional development. 2. The problem
As shown in Figure 1, the Taiwan area is divided into 23 administrative regions, including the two municipalities under the direct jurisdiction of the Executive Yuan, Taipei and Kaohsiung, the five cities of Keelong, Hsinchu, Taichung, Tainan and Chiai under the jurisdiction of the provincial government of Taiwan Province, and the remaining 16 counties. As soon as the cabinet led by premier Hao Po-tsuen assumed office in June 1989, Hao ordered the CEPD to formulate the Six-year National Development Plan. For the formulation of the Six-year National Development Plan, the various ministries and agencies of central governments, Taiwan Provincial government, Taipei and Kaohsiung municipal government all presented their proposals; then, in accordance with the goals listed above and in consideration of the supply of national resources available, the CEPD brought together and arranged the different proposals into an integrated plan. During the execution of the plan, review and modifications will be made annually.
52 DEA and regional development
After working for 6 months, the council finished the proposal for the Six-year National Development Plan in January 1990. It listed a budget of NT$8.2 trillion, hoping to strengthen infrastructural construction in slower development regions, solidify facilities in transportation and communications systems, housing, schools, cultural establishment, medical care, encourage every individual region to fulfill its greatest potential, and reduce the incentive for the mobilization towards cities in order to minimize the development differences among different regions.
During the time when the cabinet led by premier Hao was in office, the government deficit increased gradually, which led to the financial difficulties facing the completion of the Six-year National Development Plan. To carry out the plan under limited financial resources, the CEPD had to determine the priorities of the execution of each regional plan while formulating the Six-year National Development Plan. For this purpose, the CEPD must evaluate the development achievements of the 23 administrative regions in Taiwan to allocate the resources in the most appropriate region. The CEPD wanted to know the answers to the following two questions:
1. What are the relative development achievements of the 23 administrative regions in Taiwan? Which regions are showing more sluggish development?
2. What is the change of regional development of the 23 administrative regions in Taiwan in recent years? Which regions possess greater potential for development?
To answer the above questions, the criteria for evaluating regional development have to be defined first. After discussion by council members of CEPD, the aspects of population characteristics, municipal planning, income levels, local finance, public facilities, medical and health care, education and culture were selected by the council as the criteria for evaluating regional development. These criteria are further defined by the following indicators:
1. Population characteristics: indicated by population density and the non-ag- ricultural population as percentage of total population.
2. Urban planning: indicated by the urban planned area as percentage of total area, and commercial area as percentage of total area.
3. Income level: indicated by the average current household income. 4. Local finance: indicated by the local government expenditure per capita. 5. Public utilities: indicated by the number of local telephone subscribers per 100
people, and the piped water supply of population served.
6. Medical and health care: indicated by the number of physicians per 10 000 people. 7. Education and culture: indicated by the copies of newspaper and magazines sold per 1000 people and the percentage of the population over the age of 15 with an education of senior high school or above.
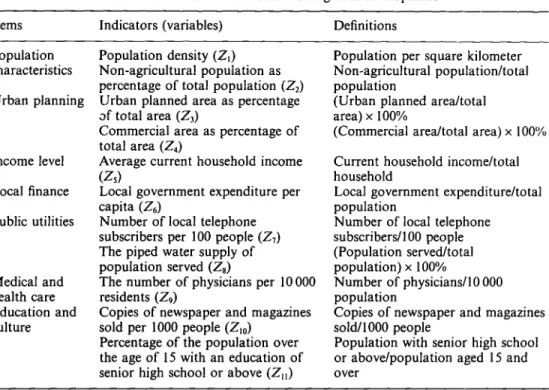
The definitions of each of the aforementioned 11 indicators are listed in Table 1. The larger the value of the indicator, the greater the degree of development in that region. Nevertheless, the various indicators of each region often fail to point to the same direction. For example, for a certain region, one indicator may be high, but another indicator may be very low. Therefore, the set of multiple indicators is still not capable of evaluating the current conditions of the development in every region. This paper collected the values of the above indicators in 1990 and 1983 based on the urban and regional development statistics compiled by the CEPD which are listed in Tables
P.-L. Chang et al. 53
TABLE 1. Performance indicators of regional development
Items Indicators (variables) Definitions
Population characteristics Urban planning Income level Local finance Public utilities Medical and health care Education and culture Population density (Z0 Non-agricultural population as percentage of total population (Z2) Urban planned area as percentage of total area (Z3)
Commercial area as percentage of total area (Z4)
Average current household income (Zs)
Local government expenditure per capita (Z6)
Number of" local telephone subscribers per 100 people (Z0 The piped water supply of population served (Zs)
The number of physicians per 10 000 residents (Zg)
Copies of newspaper and magazines sold per 1000 people (Zj0)
Percentage of the population over the age of 15 with an education of senior high school or above (ZH)
Population per square kilometer Non-agricultural population/total population
(Urban planned area/total area) x 100%
(Commercial area/total area) x 100% Current household income/total household
Local government expenditure/total population
Number of local telephone subscribers/100 people (Population served/total population) x 100%
Number of physicians/l 0 000 population
Copies of newspaper and magazines sold/1000 people
Population with senior high school or above/population aged 15 and over
2 and 3. The data were then processed by the models for measuring the relative effectiveness and effectiveness change to answer the two questions mentioned earlier, and list the priorities for achieving a balanced regional development.
3. The measurement of relative effectiveness and effectiveness change
There is a variety o f methods that can be derived for measuring management performance based on the concepts o f efficiency or effectiveness. Efficiency is a concept based on the physical and engineering science and refers to the relationship between inputs and outputs, where effectiveness is the degree to which the goals o f an organization are met. Management is concerned with minimizing resource cost for a given output, and the goal attainment which means "doing the right thing" as expressed by Peter Drucker (Robbins, 1991). The D E A approach developed by Charnes et al. (1978) represents a method by which non-commensurate multiple inputs and outputs o f an entity can be combined objectively into an overall measure o f organizational efficiency. D E A generates a wealth o f information useful in a variety o f decision settings. F o r present purposes, its principal strength lies in its ability to combine multiple inputs and outputs into a single summary measure without requiring prespecified weights. However, we are led to consider D E A in a broader context, since there have been very few studies on the use o f the D E A concept in the measurement o f the relative effectiveness o f an organization. But the internal and external demand for existing multiple performance ratios is likely to result in their continued use. This section will discuss the use o f the D E A concept to propose a model for measuring the relative effectiveness and effect- iveness change o f an organization.
54 DEA and regional development 0 O~ .~. 0 ~ u 0 0 ,..-1 N . . ~ ~ ~ ~ 0 ~ 0 ~ . 0 o ~ ° ~ ~ • ~ • ~ =_+7. ,~ = ~00.; ~ 0 ~ : ~ ~ 0 e'~ 0 , ~ ~ . ~ . ~ . ~ . ~ ~ o - ~ ~ . ° , ~ . o ~ = ~ o = 0 ,...~ ¢xl o,'1 ~ - ICh . ~ . ~ = o ~ , ~ ' ~ ~ ' ~ . ~ . ~ ~ o = o =
a~a~
4--- + + ~0'~P.-L. Chang et a/. 55 O n ~ e ~ ¢.q o c~ ~o O O ~o o4 ~a o N t~ O "1= • ~ . 1 = I p''~ ~ = I ~ : - ~ ~ ~ 0 ~ ' ~ ~
. ~ .~, ~ ~'.~ ~
- - =
~ . ~ :2 .~ ~ .~ ~ ~56 DEA and regional development
3.1. DEA AND THE RELATIVE EFFECTIVENESS
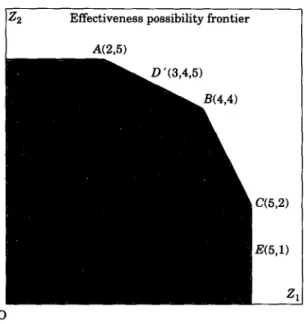
Consider five decision making units (DMUs), each having varying levels of achievement on two different performance criteria, where each DMU seeks to maximize achievement on each criterion. Figure 2 provides a two dimensional representation where each point represents the DMUs' achievement on two criteria, Zt and Z2, with the hypothetical data. The goal is to find the DMUs with Pareto-optimal combinations and compare the remaining DMUs to this subset. A DMU is Pareto-optimal in its performance if none of its effectiveness with specified criterion can be increased without decreasing some of its effectiveness with other criterion (Zeleny, 1982). A DMU is not Pareto- optimal in its performance if it can be shown that some other DMU or combination of DMUs can achieve higher levels on at least one criterion without achieving less on any other criterion. It is apparent from Figure 2 that A, B, C and E are Pareto-optimal because they are not dominated by others. For example, concerning A, it is not possible to find any other DMU, or any linear combination of DMUs, which achieve more on one criterion and no less on the other. The line segments of A, B, C and E are connected to form the effectiveness possibility frontier. On the contrary, D violates the Pareto optimality conditions since movement to A is possible through an increase in Z2 by two units, without decreasing achievement on the other criterion. Moveover, assuming all points on the segment AB represent feasible achievement levels, proportionately increasing Z~ and Z2 would move D to D' where it would be optimal. We can compare D with D', the linear combination of A, and B DMU. Both the Z, and Z2 indicators of D" are greater than those of D. In addition, D has only reached the ODIOD" percentage of what D' has achieved. A measure of effectiveness is implied by the relative distance that D must move to reach Pareto optimality at D' i.e. OD/OD', where OD is the actual objective D can achieve, OD" is the potential objective lies on the effectiveness possibility frontier. At this stage, D' is called the projection of D. Since OD is the linear combination of OA and OB, A and B are thus called the reference set of D. This signifies that A and B serve as the referential basis of the effectiveness of D. As A, B and C have reached the Pareto optimal, and are located in the effectiveness possibility frontier, their efficiency value is 1.
The measurement of the effectiveness of D is the measurement of ODIOD'. 0 0 D is the ray of OD bypassing D. The following formula must be satisfied to let 0 O-19 fall inside the area with oblique lines:
2 4 5 Z 2 5 > 2
(1)
L~+L2 +~3+ ~.4+ k5 < 1.
Meanwhile, to obtain the maximum value of 0 from OD'= 0 0 D in equation (1), OD'/
OD can be derived from the following linear programming:
Max 0 s.t. k~ +~+k3+~.4+~.5_< 1 2L~ + 4 ~ + 5•3 + 2~,4 q- 5~,5 ~--- 20 5kl +4k2 + 2~.3 + 3k4 + 1~.5 > 30 ki>0, i=1 . . . 5 ; 0 > 0 .
(2)
P.-L. Chang e t al. 57
O
Figure 2. Effectiveness measuring with two criteria.
The solution o f equation (2) is
Z*=
I " 5 , ~ , 1 = 0 " 5 , ~ , 2 = 0 " 5 , I / Z * = 0"667. This is the relativeeffectiveness of D, i.e.
OD/OD'=0.667.
And O-D ' = 0 O-19 = 1.5(2,3)=(3,4.5).The above example explains how the relative effectiveness under multiple criteria can be derived from a linear programming model. In general, the model for measuring an organization's effectiveness under multiple criteria Za,Z2,.., Zs is as the following:
Max 0
n
s.t. jEll,j<.= _ 1
n
j~=l~JZij~
OZjo ; i = 1, . . . , s criteria ~j>O j = 1 . . . . n D M U s(3)
o r Max 0 n E L j + s + = I s.t. j= I n j~--- I )Ljzi'j - - s t = 0 Z i d 0 ;i = I . . . s c r i t e r i a ~,j>0 ;]=1 . . . n DMUs. (4)The necessary and sufficient conditions for any D M U to reach the Pareto optimal are
O*=I,Sf'=S+'=O
(Charneset al.,
1978). Take the case discussed in previous sections as an example. D M U E corresponds with 0* = 1 but $7" = 1. This indicates that D M U E is yet to reach the Pareto optimal. Therefore, D M U E is not relatively effective. Besides, the projection o f D M U which is relative ineffective can be derived from equation (4). 0* Z;j.0+$7"
can thus be considered as the management control58 DEA and regional development
objective. For example, in the aforementioned case, D'(3,4.5) can be used as the management control objective of the organization D.
Next, let performance indicators, Z1Z2 . . . Zs, be used to evaluate the relative effectiveness of n DMUs. The effectiveness possibility set is defined as the following:
F(Z) = {(ZI,Z2 . . . Zs)I(Z1,Z2,..., Zs) can be performed, Zi eR~+} and let Z = (ZI,Z2 . . . Zs) ~F(Z).
Let the effectiveness possibility set also satisfy the following properties PI: i f Z ° ~ F and Z I e F then a Z ° + ( 1 - a ) Z I ~ F, 0 < a < l .
P2: if Z ° e F and Z I < z ° then Z 1 ~ F. P3: F is a closed set.
P1 implies that the effectiveness possibility set is a convex set; P2 implies the lower level goal can be attained if the higher level goal has been achieved; P3. With the satisfaction of the above properties, provided there are n DMUs, the observation values of the s number of performance indicators are Zj=(ZIj, Z 2 j , . . . , Z~j), j = 1 . . . . , n (following F/ire et al. (1985).) The effectiveness possibility set formed by the given observations can be written as:
F ( Z ) = Z i ~./Zij>Z, jE)tj<l,)~/>_O,i=l,... -= s ; j = l . . . n
(5)
Following Shephard's distance function (Shephard, 1970), the effectiveness distance function is defined as:
D(Z)=max{O:OZ e F, 0>0} (6)
and the relative effectiveness is defined a s [ 9 ( 2 ) ] - 1 . The relative effectiveness can then
be derived from the linear programming in equation (3).
In a practical application, the decision maker usually designates a number of criteria in conduction performance evaluation. These criteria are usually represented with a ratio based on the input and output items. Let Z = (Zt,Z2 . . . ZK) represent k number of evaluation criteria. For any of the evaluation criteria, the index is the ratio of a certain output and a certain input, that is Zk = Y/X,, where X~ is input Yr is output and ,i~{1,2 . . . m},re {1,2 . . . s}. Here, the s number of criteria, Z=(Z1,Z2 . . . , Zs) are used to evaluate the relative effectiveness of n DMUs. This can be done by substituting the ratio data into equation (3). The relative effectiveness is [D(Z)]-I.
3.2. T i m M E A S U R E M E N T O F T H E C H A N G E O F R E L A T I V E EFFECTIVENESS
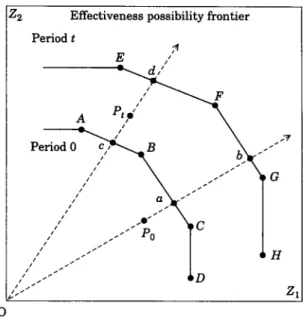
The method for measuring an organization's effectiveness can be extended to measure the change of an organization's effectiveness with the combination of the Malmquist productivity approach (Caves et al., 1982). As shown in Figure 3, the lines o f A, B, C and D represent the effectiveness possibility frontier at period 0, and those of E, F,, G and H t h e effectiveness possibility frontier at period t. P0 and P, represent the combination o f ZI and Z2 of an organization at period 0 and t, respectively. To propose the method
P.-L. Chang e t al.
Z2 Effectiveness possibility frontier Period t
t¢/
?~
/ / /
...'-""" Po
l C
It/Ill IIIIjttl
~ D
~7 G H Z1Figure 3. Effectiveness change measuring with two criteria.
59
for measuring the effectiveness change between the time periods 0 and t, the effectiveness distance functions of the time periods 0 and t have to be defined first as the following:
D°(Z°)=max {0:0 Z ° e F °, 0>0} (7)
and
D'(Z`)
= m a x {0:0Zte
F', 0>0}.(8)
Furthermore, we define an effectiveness distance function, which is to use the effectiveness possibility frontier period t as the reference set for measuring the effectiveness of a certain D M U at period 0, as:
D ' ( Z ° ) = m a x {0:0 Z ° e F', 0>0}. (9)
From the geometric meaning of the aforementioned distance function in Figure 3, we know that:
D°(Z °) =
Oa/O Po, Dt( Z °) = OblO Po, D'( Z`) = Od/O P,, D°(Z ') = OclO P,.
According to the Malmquist productivity index expressed by F~ire
et al.
(1992), the shift in effectiveness (SIE) from period 0 to period t can be described byOdlOc
andOblOa.
From equation (7), (8), and (9), the geometric average ofOd/Oc
andOblOa
can be used to measure the shift in effectiveness, as represented by equation (10):
_ [ - ~ b 0--~ '~_ /D'(Z °) Dr(z9
, Do(z`)
60 DEA and regional development Also, the catching-up in effectiveness (CIE) from period 0 to period t can be represented by equation (11),
D°(Z °)
OP/Od
CIEo.,-
D'(Z') oPolO"~'
(11)which represents the ratio between the relative effectiveness of a D M U at period t against that at period 0.
CIEo.,
>1 indicates that the relative effectiveness of a D M U has a greater improvement at period t than at period 0. CIE0., × SIE0., can be used to measure the total effectiveness change (TEC) between the time periods 0 and t; that is:/
,,.,. D°(Z °)
[D'(Z °)
D'(Z'), , D 0 ( Z ,)
TEC0, = CIE0, x alto0., = ~
dDO(ZO )
V
(12)_ /D'(z°) D°(Z °)
V
D'(Z') D°(Z9
4 . R e s u l t s
Based on the model for measuring relative effectiveness shown in equation (4), the regional development achievement of the 23 administrative regions in the Taiwan area was evaluated according to the pre-selected indicators of regional development described in the previous sections. The values of the relative effectiveness and the slack variables corresponding to each of the indicators are listed in Table 4 in the order of the value of the relative effectiveness. A larger value of the relative effectiveness signifies a more- advanced degree of regional development, while a smaller value indicates a sluggish regional development. The more sluggish the regional development, the more urgent that region's need of a national development plan.
The results indicate that the relative effectiveness of Taipei M., Kaohsiung M., Keelong C., Taichung C., Tainan C. and Chiai C. is 1. The relative effectiveness of the remaining 18 regions is smaller than 1. Among these 18 regions, Hsinchu shows the largest value of the relative effectiveness. The results are in unison with the division of administrative regions in Taiwan area. Taipei M. and Kaohsiung M. are the two municipalities under the direct jurisdiction of the Executive Yuan. The four cities under the jurisdiction of the provincial government, Keelong C., Taichung C., Tainan C. and Chiai C., are better-developed regions. As for Hsinchu C., the latest cities to come under the jurisdiction of the provincial government, the relative effectiveness reaches 0-995. In addition, it is clear that the conditions for a district to be Pareto-optimal are 0 " = 1 and S - * = S + ' = 0 , where "*" indicates an optimal solution. If a district is not effective, based on the constraints in equation (4), the projection of each relative ineffective district can be derived. For example, the optimal Sfi for Hsinchu City is 12.6 as shown in Table 4. Together with 0*=0"995, this result indicates that
O*Z, +S
fi'=0.995 x 46.9+ 12-6=59.26 can be used as the guide and the potential objective for the regional development of Hsinchu city.Moreover, the model for measuring the effectiveness change presented in this paper is used to examine the change of the regional development of each administrative region
P.-L. Chang e t al. 61 0 O% O% 0 " 0 ¢',1 0 "-4 0 0 >. ..= ,4 ~a ~ ~ 0 ~ 0 ~ ~ 0 0 0 0 0 0 0 0 ~ % o ~ ~ ° ~ ~ . ~ ~ ~ 0 ~ ~ 0 0 0 0 0 0
~ 6 o ~ o o ~ o o ~ o ~ o o o ~ -
0 0 0 0 0 0 0 0 0 0 0 0 0 0 0 0 0 0 ~ 0 ~ 0 ~ ~ ~~
o~ ~
~o'~O~ oO
. . ~ . . . ~ ~ 0 0 0 0 0 0 ~ " " ~ 6 ~ 662 DEA and regional development 0 0
5
O ..> ID ° ~ ,..-1 U-1 F" . ~ . . . ~ = . ~ . . . ~ . . . ~ . . . . ~ ~ 9 ~ ~ 9 o ~ o . . ~P.-L. C h a n g e t al. 1 - I I i I I I i i I I f I I I 2 ~ 1 ± , . _ l ~ , I I I A
""
II1--111~11 • •/ / 7
0.9-~
- " ' - ' ' "
, k ,
,
~ , /
'l
0-8 --la~
U--u_nm_L~..n -
-ooi
0.4 0"4 1 I I I I I I I I I [ I I [ I I I I I I I I - 0.2 • 0 R9 R6 R3 R7 RI R5 R8 R4 R2 R21 R23 R22 R l l R10 R12 R19 R20 R14 R16 RI5 R13 R18 R17 O E 9 0 • E 8 3 • E C = S I E x C I EF i g u r e 4. D i a g r a m o f relative effectiveness a n d effectiveness c h a n g e o f the 23 districts in T a i w a n . 63 1.8 1.6 1.4 1.2 1
over the past 8 years from 1983 to 1990. The results are listed in Table 5 in the order of the value of effectiveness change. The correlation coefficients between the effectiveness change and the following items: shift in effectiveness, degree of catching-up in effect- iveness, the relative effectiveness in 1983 and the relative effectiveness in 1990 are listed in Table 6.
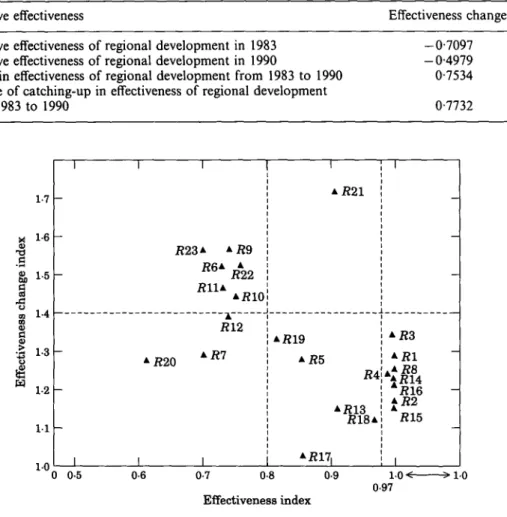
The results indicate that for the regional development of the 23 administrative regions in Taiwan area between 1983 and 1990, the effectiveness change is positively correlated with the shift in effectiveness and the degree of catching-up in effectiveness. But the change is negatively correlated with the relative effectiveness in 1983 as well as that in 1990. This signifies that during the 8 years between 1983 and 1990, the regions which enjoyed greater regional development are those with more sluggish development in 1983 as well as in 1990. The relationships among the relative effectiveness in 1983, the relative effectiveness in 1990 and the effectiveness change between 1983 and 1990 are shown in Figure 4. From this figure, it is obvious that the smaller the relative effectiveness in 1983, the greater the effectiveness change over the 8 years, and vice versa. For example, Penghu E, Miaoli E, Taitung P, Hualien E and Hsinchu E have a relatively less impressive value of relative effectiveness in 1983. But their effectiveness change over the past 8 years is relatively greater than that in other regions. On the other hand, the regions which have a relatively more-advanced relative effectiveness in 1983, such as Kaohsiung M., Chiai C., Tainan C. and Keelong C., produce a smaller effectiveness change over the past 8 years. The results indicate that according to the 11 regional development indicators in question the difference among the regional de- velopment of each of the administrative regions in Taiwan area between 1983 and 1990 was getting smaller.
The above analysis is sufficient to answer the questions posted by the CEPD, and serve as a reference for the formulation of a regional development plan. We represent the values of relative effectiveness for measuring the regional development of 23 regions with a horizontal axis. A smaller value represents a region with less development at present, which is considered a region more urgently in need of national development. A larger value represents a region with more-advanced development, which is considered a region less urgently in need of national construction. Moreover, we represent the
64 DEA and regional development
TABLE 6. Correlation coefficients between effectiveness change and relative effectiveness of the 23
districts in Taiwan
Relative effectiveness Effectiveness change
Relative effectiveness of regional development in 1983
Relative effectiveness of regional development in 1990
Shifts in effectiveness of regional development from 1983 to 1990
Degree of catching-up in effectiveness of regional development from 1983 to 1990 - 0 " 7 0 9 7 - 0 - 4 9 7 9 0-7534 0-7732 " O Xo I:1 > i i I 1 . 7 - 1 . 6 - R 2 3 • • R9 R 6 • • 1.5 - R22 R l 1 • • RI0, 1 . 4 . . . ~ . . . RI2 • R 19 • R3 1.3 - • R20 • R7 • R5 • R1 - R2, • * R8 % A. R14 1-2 - ', " R 1 6 - • R13 i t m 1.1 - R 1 8 • i, R 1 5 _ I I 1.O I I I •R171 [ I 0 0.5 0.6 0.7 0.8 0.9 1.0 < > 1.O 0.97 Effectiveness index I I • R21
Figure 5. Scatter of achievement and change of regional development of 23 districts in Taiwan.
value of the effectiveness change for measuring the regional development of 23 regions with a vertical axis. A smaller value indicates a region with a slower pace of development over the past 8 years, which is regarded as a region with less potential for regional development. A larger value indicates a region with a faster pace of development over the past 8 years, which is regarded as a region with greater potential for regional development. The scatter is shown in Figure 5. Based on the urgency of the demand of the national development plan and the potential for regional development, the 23 regions in Taiwan can be classified into five categories:
1. Regions with less development but a fast pace of change: the seven prefectures of Taitung, Hsinchu, Miaoli, Hualien, Changhwa, Nantou and Taichung have a value of relative effectiveness below 0.8, but an effectiveness change value over 1-4. The current development of these regions is less advanced, and their need for national development plan is more urgent. In addition, these regions had a fast pace of change in regional development over the past 8 years, showing a
P.-L. Chang e t aL 65
greater potential for regional development. Therefore, these regions can qualify as the top priorities for the implementation of national development.
2. Regions with less development and a slow pace of change: the prefectures of Pingtung and Ilan have a relative effectiveness below 0"8, and an effectiveness change below 1.4. The current development of these regions is less advanced, and the need for national development plan is quite urgent. However, the change of regional development in these regions over the past 8 years is rather limited, and so is the potential for regional development.
3. Regions with medium development and a fast pace of change: the relative effectiveness of the Penghu prefecture is between 0-8 and 0"97, and the effectiveness change value is over 1.4. This region has an intermediate current development and just an average urgency of the need for a national development plan. But this region had a fast pace of change in regional development over the past 8 years, and thus possesses good potential for regional development.
4. Regions with medium development and a medium pace of change: the five prefectures of Kaohsiung, Taoyuan, Chiai, Yulin and Tainan have a value of relative effectiveness between 0-8 and 0.97, but an effectiveness change value below 1-4. These regions have an intermediate current development and just an average urgency of the need for national development plan. The pace of change in regional development over the past 8 years is just an average for these regions, and so is the potential for regional development.
5. Regions with advanced development but a slow pace of change: the two mu- nicipalities of Taipei and Kaohsiung, five cities of Taichung, Hsinchu, Keelong, Tainan and Chiai, and the prefecture of Taipei have a relative effectiveness over 0"8, but an effectiveness change value below 1-4. The current development of these regions is rather advanced, and their need of national development plan is less urgent. In addition, these regions had a slow pace of change in regional development over the past 8 years, indicating limited potential for regional development.
5. Conclusion
In Taiwan, the objective of the Six-year National Development Plan is to achieve balanced overall development. To carry out the various plans for a balanced regional development under a limited budget, the urgency of the need of national development by each administrative region, as well as the potential for development possessed by each region, have to be evaluated and weighed to determine the priorities of all regional development plans.
Based on the Pareto-optimal concept, this paper extends the DEA approach for measuring relative efficiency by Charnes et al., and proposes a mathematical pro- gramming model, which is capable of measuring the relative effectiveness of an organization in terms of performance ratios under multiple criteria. At the same time, this paper combined the model for measuring effectiveness with the Malmquist productivity approach expressed by F~ire et al., and extended the model to become a model for measuring the effectiveness change of an organization. The model presented in this paper provided useful information for the formulation of a regional development plan in Taiwan and offered the solutions for the cases in this paper.
66 DEA and regional development References
Caves, D. W., Christensen, L. R. and Diewert, W. E. (1982). The economic theory of index numbers and the measurement of input, output, and productivity. Econometrica 50, 1393-1414.
Charnes, A., Cooper, W. W. and Rhodes, E. (1978). Measuring the efficiency of decision making units. European Journal of Operational Research 2, 429 444.
Charnes, A., Cooper, W. W. and Li, S. (1989). Using data envelopment analysis to evaluate efficiency in the economic performance of Chinese cities. Socio-Economic Planning Science 23, 325-344.
Council for Economic Planning and Development, Executive Yuan. (1990). Urban and Regional Development Statistics. Taipei, Taiwan: Council for Economic Planning and Development.
F~ire, R., Grosskopf, S., Lindgren, B. and Ross, P. (1992). Productivity changes in Swedish pharmacies 1980-1989: a non-parametric Malmquist approach. The Journal of Productivity Anal.vsis 3, 85-101. Fare, R., Grosskopf, S. and Lovell, C. A. K. (1985). The Measurement of Efficiency of Production. Boston:
Kluwer-Nijhoff.
Kao, C., Chang, P. L. and Hwang, S. N. (1993). Data envelopment analysis in measuring the efficiency of forest management 38, 73-83.
Robbins, S. P. (1991). Management, 3rd edn. pp. 5-6. New Jersey: Prentice-Hall.
Shephard, R. W. (1970). The Theory of Cost and Production Functions. Princeton: University Press Princeton. Zeleny, M. (1982). Multiple Criteria Decision Making, pp. 61-74. New York: McGraw-Hill.