LOGGING AND ANALYZING MOBILE USER BEHAVIORS
Po-Ming Chen,
National Chengchi University, Taiwan radination @gmail.com
Hui-Yin Wu,
National Chengchi University, Taiwan 100462010@nccu.edu.tw
Chih-Yu Hsu
National Chengchi University, Taiwan easyflys@gmail.com
Wen-Hung Liao
National Chengchi University, Taiwan whliao@cs.nccu.edu.tw
Tsai-Yen Li
National Chengchi University, Taiwan li@ nccu.edu.tw
ABSTRACT
With the rapid evolution of mobile devices, the usage patterns of applications on these devices also change over time. The topic of user behaviors on mobile devices such as smart phones has attracted much attention in recent years. In this work, we have developed an experimental platform that can log and analyze all user operations on a smart phone that is used freely over a long period of time. The collected data are transmitted to a server periodically when the network is available. Analytic tools such as charting, log query, and real-time log pattern analysis have also been developed to facilitate the study of user behaviors. In this paper, we will illustrate the functionalities of the proposed platform through several examples and a sample case study.
Keyword: mobile devices, user log analysis, mobile user behavior.
1 Introduction
The rapid development of mobile devices and communication infrastructure has made applications of smart mobile phones prevailing. In just a few years, the number and variety of Apps on smart phones has fundamentally changed the way we look at the mobile phone, which was traditionally considered as a portable device for voice communication. Due to the increase of computing power and display resolution,
applications such as gaming, music, photography and wireless services such as web access, location-based service (LBS), and mobile social networks are becoming increasingly popular. Novel services are being developed to take advantage of the evolving mobile platform. However, how people have adopted a smart phone and developed their own usage patterns is still an interesting question deserving further studies.
There are many ways to conduct studies on user behaviors. Typical studies on user experiences are designed and conducted in a controlled experimental environment where researchers can examine the behaviors of a user instructed to perform a certain task. An experimental session is usually videotaped, and corresponding key events during the operations are also recorded for further identification of the motive behind a user behavior. A survey questionnaire is usually used to collect background information of the participants as well as the subjective ratings of the system under experiment. The disadvantage of this kind of experimental design is that the tasks to be performed need to be clearly identified in advance, and they are usually limited to those that can be accomplished in a short period of time. The design of the experimental environment is also crucial to avoid unnecessary annoyance by the participants such as being watched. In addition, traditional approaches have their limitations on the study of long term daily user behavior. It is highly desirable to develop new methodologies to understand user behavior and assess user preference over a longer period of time. These methodologies can be greatly facilitated if there exists an experimental platform that can provide convenient logging services and appropriate analytical tools for studying these logs on mobile devices.
The behaviors of using a smart phone could be rather complex in the setting of everyday life. An application on the smart phone may consist of several functional modules to work together seamlessly. For example, a photo-taking activity may consist of taking the location information from the GPS system, taking the picture, and transferring the picture to a social network site. A user can make phone calls by entering the phone number manually, through the phone book, or selecting from the call history. Although the result of these actions is all making a phone call, each action pattern may mean a different usage context. The studies of these behaviors are crucial for the design of a smart phone and its applications and cannot be easily conducted in a controlled laboratory. In addition, the pervasive availability of network connections has enabled novel applications such as social networks. Many mobile phones feature built-in social network services. The applications of this type of services have changed the ways that people interact with each other. However, investigation of the dynamics and characteristics of these mobile social networks also calls for the development of new and powerful log collection and analysis tools.
Smart phones are becoming prevailing because of their openness and extensibility. Among the popular mobile operating systems, Android OS is one with great extensibility and can be further customized for different phone brands and models. Its great flexibility in modifying and supplementing extra functions for the system allows one to implement a ‘monitoring’ application to keep track of user operation. In our previous work [1], we have taken advantage of the openness of Android OS to develop a log collection service that executes in the background and records detailed user operation in a database. The user log will be transferred to a remote server when internet connection is available. In
this paper, we will present the tools that we have designed to facilitate the analysis of the log data. We will also use several examples and a comprehensive application to demonstrate the potential uses of these tools on analyzing mobile user behavior.
The rest of this paper is organized as follows. In Section 2 we will briefly review some related work pertaining to long-term log collection and analysis. Section 3 presents the log collection and analysis services implemented in this research. In Section 4 we will describe three demonstrative examples and a comprehensive application of using these proposed services. Section 5 concludes this paper with an outlook on future research directions.
2 Related
Work
In the past few years we have seen the general increase of research in the field of mobile user behavior. In [3], the authors analyze long-term location-based information collected through Bluetooth devices to gain deeper understanding of user personal behavior. Further, specific details on the mobile operations carried out by users can be retrieved through background user-log collection program, as demonstrated in [4]. Individual usage patterns are recorded in the form of log data, which encompass daily activities such as text messaging, phones calls, photo taking, gameplay and other leisure activities. We use a similar log-collecting approach in this paper with a broader goal to provide a platform that integrates hardware resources, software design and user group management. In this way, researchers from different fields can cooperate to explore new topics in interdisciplinary areas.
The online game community is another place where large amounts of log data are collected, mainly for recording different sessions throughout the gameplay. In [2], the authors create a database to store character profile information such as character ID and location. The information is collected through a client-side user interface. Through analysis of the relationship between characters and groups (or guilds), they can study the evolution of online communities from a social network perspective. They designed a tool, ‘Social Dashboard’ to monitor group dynamics in real-time. This concept is incorporated our research to develop a similar web-based log monitoring tool that allows researchers to efficiently access the overall status of the collected data. This will ensure a smoother operation and convenience throughout the progress of the experiment.
The data obtained through the log collecting service is useful for doing qualitative analysis on user behavior, as proposed in [6]. In [7], the authors also provide a framework for automated usage analysis of user interfaces to include functionalities in synch and search, transforming event streams, analysis, visualization, and evaluation support. On our platform we implement many of the benefits of this framework on the mobile device logging platform by providing services including log charting services for graph visualization and statistic analysis, log query service for searching and statistic evaluation, and log real-time monitor for into user behavior pattern interpretations. This can provide a basis for not only quantitative but also qualitative research proposed in [6].
3 The Experimental Platform
service that we implemented in our previous work [1] and the analysis tools that we have developed. We will first describe the initial setup of our experiment, namely, the recruit of volunteers. We then proceed to describe the details of the log collection service, including the data flow, log table format and service policy.
Our experimental platform consists of a collection of smart phones with the Android operation system, a log collection program pre-installed on the phones, and a community of users who borrow our smart phones or use their own phones to participate in the long-time experiment in a living lab. The participants were recruited with a quarter as a term. There are about 30 participants in the experiment reported in this work. Most of the participants took part for the whole period of experiment lasting for six months. However, they were not told to use any specific software except for installing the logging program at the very beginning of the experiment. Therefore, all data collected in the experiment reflect their uses of the mobile phone in daily life.
Because of the open nature of Android operating system, we are allowed to utilize the functions provided by the Location Manager to record the position information from the localization services such as GPS, Wifi, and 3G. As for system logs, there is no corresponding API to directly access the low-level statistics. Instead, we make use of the ‘logcat’ tool included in the Android SDK to obtain raw data and then parse and filter the desired portion according to our needs.
All log data generated as a result of user operation are transferred and stored in a central repository such that researchers can retrieve certain section of the data according to their specific research interests. For example, researchers who would like to analyze the correlation between the ‘photo-taking’ behavior and the location where the photo is taken will need to gather all activities related to ‘camera’ and the corresponding location information. Researchers who are interested in investigating the dynamics of social behaviors will need to define a set of terms containing all social networking activities and retrieve data accordingly. The log database is updated incessantly and incrementally, and the proposed platform provides a convenient web-based user interface for registered researchers to quickly browse and query the log content, as further elucidated in the following section.
4 Illustration
Examples
We have described the overall framework of our log collection service. Our main objective is to build an experiment platform which integrates hardware device, software customization and user group management for researchers from different areas of expertise to conduct long-term observation, collection and analysis of mobile user behavior such as gaming, social interactions, web browsing, photo-sharing, etc. In the following subsections, we will use three examples to illustrate how these collected data can be used to analyze user behaviors.
4.1 Log Charting Service
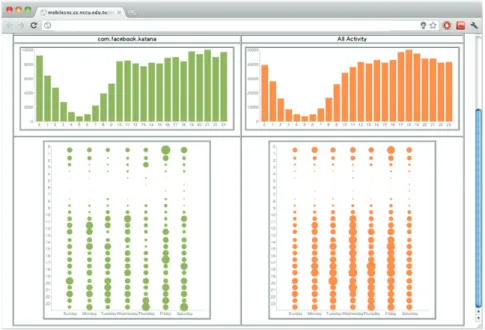
Log Charting Service provides the researcher with a quick way to get an overview of the data collected from the users who have installed the Log Collector. This data includes app information, usage time stamp, frequency, etc. By providing this service, researches can efficiently compare the differences in user behavior between various applications,
evaluate which apps are most popular, and gain deeper insight into those more recently released apps. Examples of charts (activity and application) generated by our tools are depicted in Figure 1.
Figure 1. Left: User activity chart (top: 24-hour period, bottom: the whole experiment period) Right: Charting the types of application run by a specific user
Figure 2. Top: the number of times an app runs at each time of the day, Bottom: the number of times an app is run on each weekday, and different times of the day. In Figure 2, an interesting case is used to elaborate the benefits of the Charting Service. The case mainly focuses on examining when users use applications most frequently, using the figures produced by the Charting Service for a quick explanation. The period of user log files for analysis is from May 2011 to November 2011. The top figures show the number of activities at different times of a day, and the bottom figure uses the size of a circle to indicate the number of activities for different times of each day. The researchers can easily grasp the general activity pattern for each day with this type of plot.
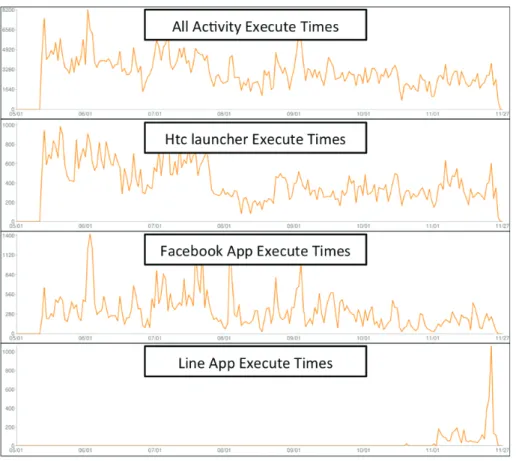
Figure 3. The number of times each application is run throughout the course of a day. From the top downwards are “Overall Application Activity,” ”Htc launcher,” ”Facebook Application,” and “Line Application”
From Figure 3, we show the usage of various programs over a six-month period of time. We can see that HTC launcher has positive relation to applications that are run because launcher is called each time an application is closed and the mobile device returns to the home screen. Also, from the overall app data we notice that Facebook is the most frequently used app, which sufficiently explains the importance of Social Network Services to current smart phone users. Another very popular application that was recently released is the Line App. By using the Charting Service, the researcher can clearly see the usage information of popular apps, and understand the recent and possibly predict future trends of an app.
Though the above figures explain the daily usage of different applications among users, it also shows the difference between working days and weekends or holidays. With further evaluation, a deeper insight into the frequency of applications run at various point of time throughout the day can also be gained.
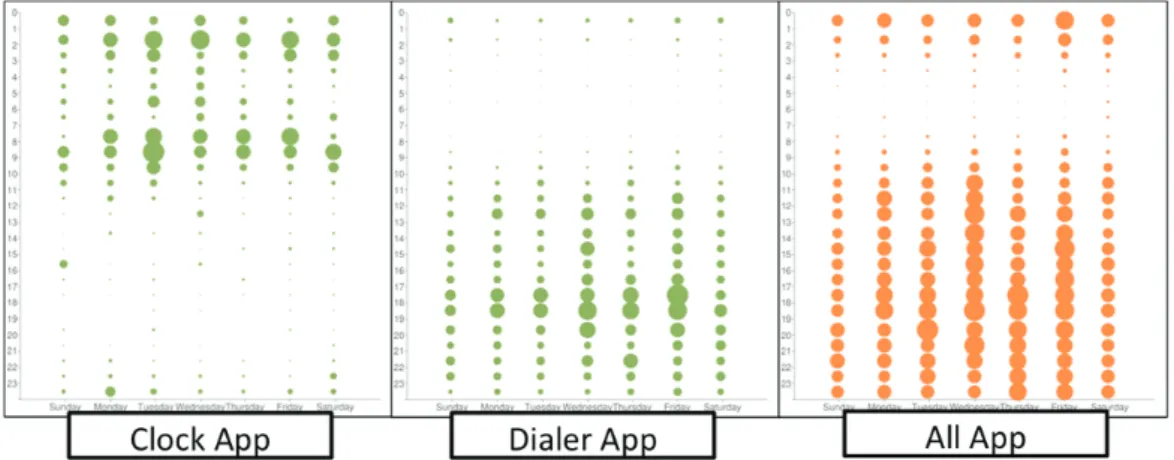
Figure 4. The usage distribution based on the day of the week, hour of the day and the time an application is run. (Left: Clock App, Middle: Dialer App, Right: All Apps. The x-axis represents the day of the week while the y-axis represents the time of the day from 0 to 23.)
Figure 4 explains the different usage of applications at various times of the day each day of the week. For example, the leftmost figure represents the Clock Application. Its function is very similar to a physical clock and is usually set before one goes to bed, and is set off in the morning as an alarm. This kind of application comes into contrast with other apps. For applications such as the dialer app, the “rush hour” is usually on weekdays from 5PM to 6PM, when class usually ends. Compared to other days of the week, the Dialer App has most usage on Friday afternoons after class. In this comparison we can see that the Clock App and the Dialer App vary in usage in different times of the day, the former usually in the morning and late night, and the latter in the afternoon. We can also observe that both of these apps are used more frequently on weekdays compared to weekends. It would be interesting to find out whether any applications are more frequently used during weekends and holidays.
For different types of apps, researches can also quickly compare the usage behavior between the varying types through the Charting Service. This provides the researcher with a convenient platform to efficiently set search conditions and pick out applications that fit the topic of interest. However, there are still limitations to the platform in that it still does not provide a very accurate grouping of related applications, therefore, an efficient solution to compare the usage of related applications is still to be desired. The question on comparing user behavior across similar applications at various time points would be an interesting topic for future research. Generally speaking, we believe that the findings with this charting tool can be used as a starting point for forming good research issues for further qualitative studies.
4.2 Log
Query
Service
It is also an interesting question on how users evaluate and determine the life of an application: Where did they gain access to it? How frequent is the application used? When does it come into need? How long is its span of interest? Does the user decide to
uninstall it after it falls out of favor? Using the log files collected on the platform, some insight can be gained into the life cycle of applications.
In this study, we examine the user log files of three communications related apps collected over a twelve-month period. The first application is for free text-messaging. The second and third are free Internet phone applications, the former a long existing service, and the latter relatively new. We compare the number of log files collected throughout this period and examine the changes in the amount of usage.
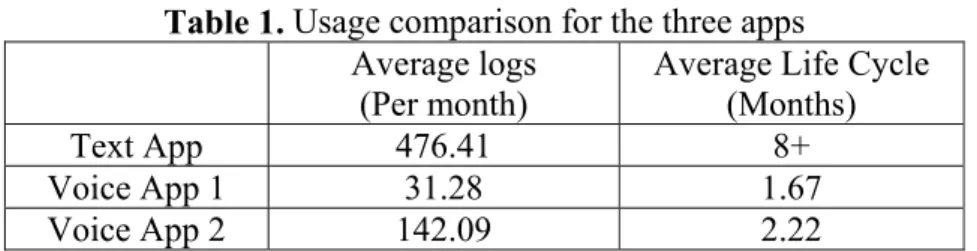
From the data, a few observations are made. First, we find that the users prefer the text-messaging app to the voice-messaging apps. Though the usage of the text-messaging app is occasionally high and low, the app remains in longer usage from the installation until the end of their experiment period, the shortest being three months and the longest already over twelve months with an average of 8 months. In comparison, the usage graph for the two Internet phone apps both have disconnected and scattered points of usage that do not last more than two months. In for the first of the two has an average application life cycle of 1.67 months spanning from just a few hours to three months, and the second 2.22 months. This comparison can be seen in Table 1.
Table 1. Usage comparison for the three apps
Average logs
(Per month)
Average Life Cycle (Months)
Text App 476.41 8+
Voice App 1 31.28 1.67
Voice App 2 142.09 2.22
Because the time the user downloads each app varies, it is difficult to find an absolute start point that can apply to every user. However, if we compare the app usage of individual users, we can see similarities in the sequence of downloading, and the period of usage in Figure 5. (a) 0 50 100 150 200 250
Usage TextVoice 1
(b)
Figure 5. Comparison of log amounts for (a) User 1 and (b) User 2
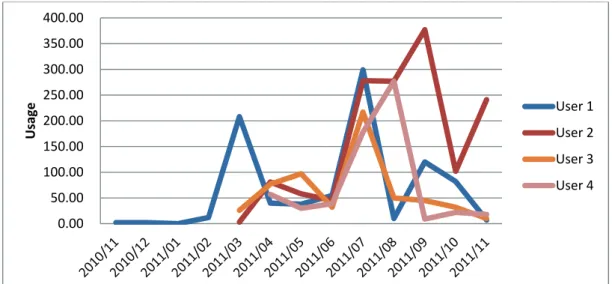
On observing the usage of the text app, we can see that although the shape of the usage curves do not completely overlap, all the curves have similar high or low irregularities among four sample users (Figure 6).
Figure 6. Usage information for four users of the text app
During a more in-depth survey, User 3 (also (a) in Figure 1) stated that there were three stages to the life cycle of app usage: initial experience, gradual balanced usage, and if applicable, uninstalling unused applications. Using the text application as an example, the initial stage, User 3 felt that the app was interesting, and the fascination led to more frequent usage. However, normally User 3 did not have texting habits prior to installing the app, so gradually the usage decreased after the fascination wore off. The irregular high use in mid-summer occurred while on travel, where need arose to contact family members and friends in a more efficient and inexpensive way. When asked about the usage of the other two apps after installation, User 3 stated that they came in use infrequently because few of his contacts used it, so there was no need to set up the app. If the app was out of use for some period, and User 3 realized that the memory space was limited, the unused app would be deleted.
0 20 40 60 80 100 Usage Text Voice 1 Voice 2 0.00 50.00 100.00 150.00 200.00 250.00 300.00 350.00 400.00 Usage User 1 User 2 User 3 User 4
In this case we can observe that though all three apps are free services for communication purposes, their usage model and app life style vary greatly from app to app. The text app seems to be designed for more sustained use while the two voice apps have a much shorter span of interest among users.
4.3 Log
Real-time
Monitor
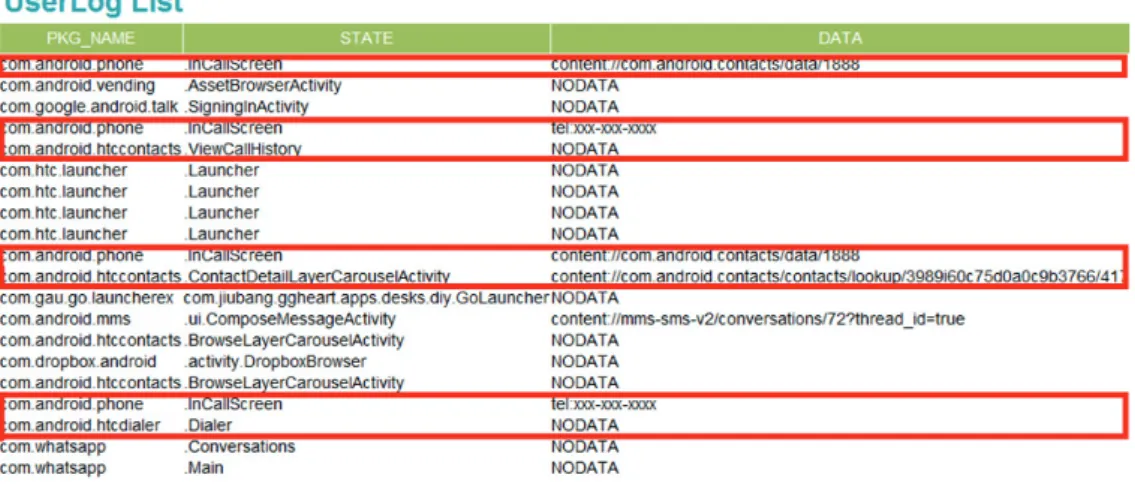
In the literature, three different levels of user behavior analysis have been identified, namely, activity, action, and operation [5]. An activity usually consists of a sequence of actions and is more related to the motivation behind. An action is a logical unit with a clear goal, while an operation is the most fundamental physical unit. From the researcher’s perspective, higher levels of description such as activity or action are of interest. However, a log item can only show us the operation performed. A sequence of logs will constitute higher level events. Therefore, we need to establish the mapping between an event and its corresponding log sequence. If researches wish to examine certain user behavior on smart phones by predicting the log pattern produced through a certain activity, they can immediately find the Log List of certain log patterns through manipulating the elements on the GUI with the help of the Log Real-time Monitor. It will be much easier to define user behavior patterns and gain insight into the user behavior.
Figure 7. Log Real-time Monitor
In Figure 7, the log files related to dialing activities are marked out. Through the log Monitor, the researcher can observe that com.android.phone .InCallScreen is the Activity users evoke when entering a call or dial application. However, there are many possibilities on how the user evokes the call activity. For example, the user may manually dial the phone number through the number pad, or via speed dial. Both methods can achieve the same purpose of placing a call. Other applications may have similar scenarios. For example, for photo-sharing, a single log file is definitely insufficient to determine the whole course of activity. Therefore a sequence of numerous log files must be defined to produce a pattern that can be used in further analysis. For example, if a user chose to place a call by searching through his/her contact list, the .InCallScreen activity must be preceded by the com.android.htccontacts .ContactDetailLayerCarouselActivity. The call placing action is then initiated by two log activities instead of one. By using
these two activities, we can define a user behavior pattern for “placing a call.”
Here is an explanation of deducing a user behavior pattern through the assistance of the Log Real-time Monitor to create a Log List. We analyze the log data produced based on six user scenarios.
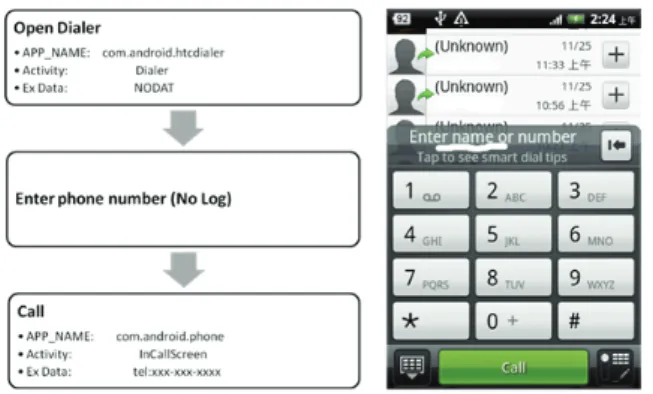
Manual Input Phone Number
Figure 8. Left: Steps for placing a call through manually inputting phone number Right: Screen for manually inputting phone number
Scenario 1 for Manual Input (Figure 8): When the expected receiver of the call is not in the contact list, or when the caller is remembers the phone number, they may choose to use this method of placing a call.
Contact List
Figure 9. Left: Steps for placing a call through contact list Right: Screen for contact list
Scenario 2 for Contact list (Figure 9): When the contacts are saved on previous occasions prior to the call, and the user not yet familiar with the receiver’s number, or when it has been some time since the number has been dialed, the user may choose to find the number through their contact list.
Figure 10. Left: Steps for placing a call through call history Right: Screen for call history
Scenario 3 for Call History (Figure 10): When the contact has recently been called, the user can directly place a call by searching through the call history.
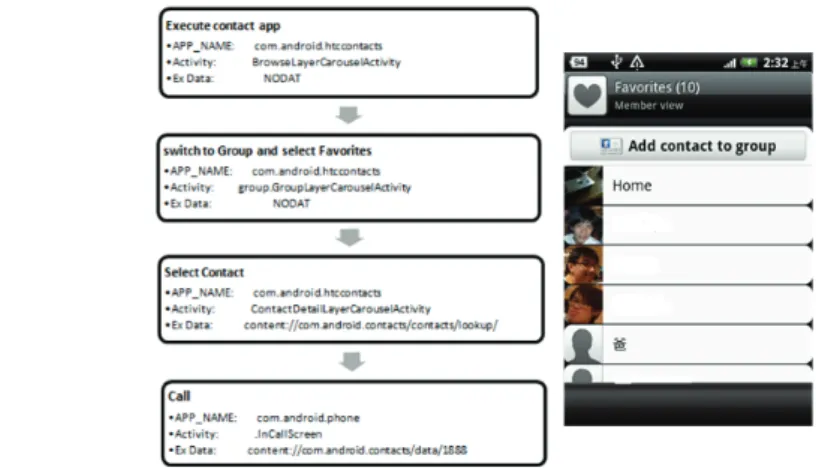
Frequent Contacts
Figure 11. Left: Steps for placing a call through Favorites Right: Screen for favorites
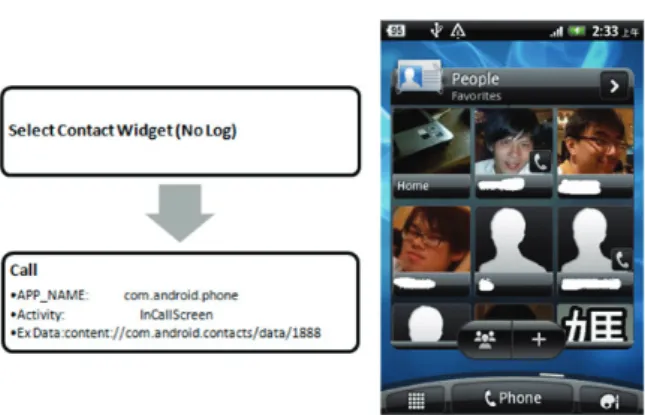
Scenario 4 for Frequent Contacts (Figure 11): When the receiver of the call has already been added to the Favorites list, the user can open the Favorites page to view a certain group of frequently used contacts, which narrows down the search overhead. Widget:
Figure 12. Left: Steps for placing a call through Widget Right: Screen for Widget
Scenario 5 for Widget (Figure 12): When the user puts frequently used contacts in the widget management, they can dial through a home screen shortcut instead of opening their contact list, which differs from the use of favorite lists in convenience. This greatly reduces the select elapsed time before placing a call.
Scenario 6 for Call from Voice: The contact must already be in the contact list. When users cannot use usual methods to place a call (Ex: while driving), they may choose to use Android’s voice recognition function instead. However, currently Android does not provide good Chinese a voice recognition system, so the log files for this method cannot be found yet.
Table 2. Steps for placing a call, and the relative number of applications, activities, and logs evoked
Step Used App Used Activity Log
Manual enter phone number 3 2 2 2
Contact List 3 2 3 3
Favorite contact 4 2 4 4
Call history 3 2 2 2
Widget: 2 1 1 1
By using the Log Real-time Monitor we can define five Log Patterns for user behaviors. However, it is worth noting that as indicated in Table 2, the log pattern for the Widget scenario includes only a single log record. This kind of log pattern may cause difficulty when analyzing. Another observation we can gain is that though it takes four steps to place a call through Favorites, it is still faster than through a Contact List. His is because the user can find their desired contact much faster through the shorter Favorites List. However, we cannot calculate the time it takes for the user to search through their contact list since no logs are produced for the searching process. Therefore, the activity log records cannot completely decide the length of time to carry out an activity.
In combining user behavior studies with the Log Real-time Monitor, researchers can quickly and efficiently find related Log Lists, and moreover define the user operations to generate a log pattern. This saves the time and trouble of searching through a huge amount of log data for relevant information for analysis. However, though the Log
Monitor provides a convenient interface for researchers to search and understand user behavior patterns and also greatly increases the efficiency, it is still limited compared to the variety of applications that can be found on the Android Market. Apart from the default applications on the phone, other more functional applications with similar purpose can replace the function of the default application. This may cause much difficulty when analyzing User Log records. Moreover, if the user has a certain unique habit of usage that cannot be fore-predicted, it may cause misinterpretation of the data. A critical issue for future research would be on how the Log Real-time Monitor can reduce such errors through more accurate definition of user patterns.
4.4 Comprehensive
Application
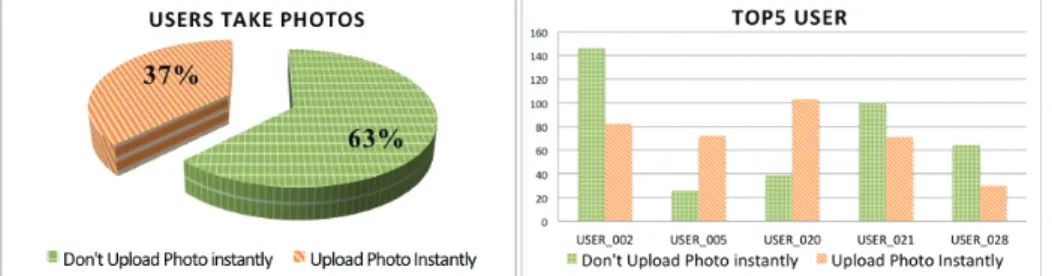
In this section, we illustrate some functionalities of our service platform with a sample case study in which the researcher is interested in knowing if a user is accustomed to sharing photos on Facebook immediately after taking pictures. Traditional survey-based or interview-oriented approaches may have limitations due to the lack of concrete data to support quantitative analysis. Such type of experiment cannot be conducted in a lab setting either since long-term observation is needed. Using the proposed service platform, researchers can search for activities related to ‘camera’ and ‘Facebook’ in a specified time interval and establish the causality to examine the usage pattern. To begin with, researcher defines the ‘photo-sharing’ activity by a sequence of user operations. This sequence of operation is repeated several times and the corresponding log list is observed using the real-time log monitor. The researcher looks for consistency and possible noise in the generated log to properly model the activity. When experiment commences, participants are told about the period of this experiment and are encouraged to operate their mobile phones using default settings (For example, use the built-in camera App to take pictures. Use Facebook but not other social network platforms to share photos.) During the experiment, researchers can check for general user activities using the charting function. They can also retrieve partial data to perform preliminary analysis. The results shown in Figure 13 were obtained with a user group of size 25 over a 3-month period. Here ‘instant sharing’ is acknowledged if the user uploads the picture to Facebook within 10 minutes of shooting.
Figure 13. Statistics of photo-sharing behavior
According to the statistics shown in Figure 13, 37% of the photos taken by the participants are shared on Facebook without much delay. If we turn our attention to the five most active photographers, we can observe two distinct types of users: {USER_005, USER_020} are more social than {USER_002, USER_021, USER_028}. Of course,
there exist other ways of categorizing the users if we incorporate more information from the log data.
5 Conclusion and Future Work
In this paper, we have presented a service platform for logging and analyzing user behaviors on mobile devices. The objective of this research is to provide a new direction for conducting research on user behaviors by taking advantage of the openness of the Android operating system to gather objective measures based on the user operations on mobile devices. We also have developed tools to facilitate the analysis of user behaviors. Three examples are shown to illustrate the uses of these tools to analyze and compare user behaviors and discover interesting research issues deserving further studies. We hope that the development of this experimental platform will enable the advent of novel research methods for analyzing user behaviors on mobile devices.
We are in the process of deriving automated methods to discover usage patterns from the log data. Since similar activities may result in different operation patterns under different application contexts, we hope to develop a new description language to describe the usage pattern in order to facilitate automatic extraction of these patterns from the log. We also would like to do further analysis on the current collected user log to discover more interesting research issues for further qualitative studies and benefit the design of mobile applications eventually.
6 References
[1] P.-M. Chen, C.-H. Chen, W.-H. Liao, T.-Y. Li, A Service Platform for Logging and Analyzing Mobile User Behaviors. Proc. of Edutainment 2011, LNCS 6872, Taipei, 2011. [2] N. Ducheneaut, N. Yee, E. Nickell, and R. J. Moore, The life and death of online
gaming communities: a look at guilds in world of warcraft. Proceedings of the SIGCHI conference on Human factors in computing systems, 2007.
[3] N. Eagle, and A. Pentland, Reality mining: sensing complex social systems. Personal Ubiquitous Computing, 10(4), 255-268, 2006.
[4] T. Kärkkäinen, T. Vaittinen, and K. Väänänen-Vainio-Mattila, I don't mind being logged, but want to remain in control: a field study of mobile activity and context logging.The Proceedings of the 28th international conference on Human factors in computing systems, 2010.
[5] A. N. Leontjev, Activity, Consciousness, and Personality. Englewood Cliffs, Prentice Hall, 1978.
[6] J. Kort, and H. de Poot, Usage Analysis: Combining Logging and Qualitative Methods. Proceedings of the 2005 CHI Conference on Human Factors in Computing Systems (Extended Abstracts), Vienna: ACM Press, 2121-2122, 2005. [7] D. M. Hilbert, and D. F. Redmiles, Extracting Usability Information from User