In Situ Observation of Dehydration-Induced Phase Transformation
from Na
2
Nb
2
O
6
−H
2
O to NaNbO
3
Jong Hoon Jung,*
,†,‡,○Chih-Yen Chen,
†,§,○Wen-Wei Wu,
∥,○Jung-Il Hong,
†,⊥Byung Kil Yun,
‡Yusheng Zhou,
†Nuri Lee,
#William Jo,
#Lih-Juann Chen,
§Li-Jen Chou,
§and Zhong Lin Wang
†,▽†School of Materials Science and Engineering, Georgia Institute of Technology, Atlanta, Georgia 30332, United States ‡Department of Physics, Inha University, Incheon 402-751, Republic of Korea
§Department of Materials Science and Engineering, National Tsing-Hua University, Hsinchu 30313, Taiwan ∥Department of Materials Science and Engineering, National Chiao Tung University, Hsinchu 30010, Taiwan
⊥Department of Emerging Materials Science, Daegu Gyeongbuk Institute of Science and Technology, Daegu 711-873, Republic of
Korea
#Department of Physics, Ewha Womans University, Seoul 120-750, Republic of Korea
▽Beijing Institute of Nanoenergy and Nanosystems, Chinese Academy of Sciences, Beijing, China
*
S Supporting InformationABSTRACT: We have monitored the phase transformation from a Sandia octahedral molecular sieve Na2Nb2O6−H2O to a piezoelectric NaNbO3 nanowire through in situ X-ray diffraction (XRD) and transmission electron microscopy (TEM) measurements at high temperatures. After dehydration at 288 °C, the Na2Nb2O6−H2O becomes significantly destabilized and
transforms into NaNbO3 with the increase of time. The phase trans-formation time is exponentially proportional to the inverse of temperature, for example, ∼105 s at 300 °C and ∼101 s at 500 °C, and follows an
Arrhenius equation with the activation energy of 2.0 eV. Real time TEM investigation directly reveals that the phase transformation occurs through a thermally excited atomic rearrangement due to the small difference of Gibbs
free energy between two phases. This work may provide a clue of kinetic control for the development of high piezoelectric lead-free alkaline niobates and a deep insight for the crystallization of oxide nanostructures during a hydrothermal process.
1. INTRODUCTION
As the restriction of hazardous substances is emerging as a major issue, the development of lead-free piezoelectric materials has attracted considerable interest.1,2As a strong candidate to replace lead-based piezoelectric materials such as Pb(Zr,Ti)O3,
alkaline niobates with perovskite structure such as (K,Na)NbO3
have received great attention due to their high piezoelectricity, high Curie temperature, and electromechanical coupling constant.3 Until now, however, the reported piezoelectric coefficients of alkaline niobate bulks and thin films are inferior to those of the Pb(Zr,Ti)O3counterpart, probably due to the
volatilization of alkaline ions at high temperature.4,5 On the other hand, alkaline niobate nanomaterials are free from the volatilization problem due to low temperature synthesis, such as hydrothermal method, through nonequilibrium process.6 Moreover, the relatively easy control of morphology, size, and shape through nonequilibrium process enables us to investigate the quantum size effects and to widen the applications of alkaline niobate nanomaterials.7 One of the remaining and challenging issues of alkaline niobate nanomaterials is the increase of piezoelectricity to realize the high performance of lead-free piezoelectric nano devices.
Among alkaline niobate nanomaterials, one-dimensional NaNbO3 nanowires are obtained through the unique
crystallization. Under the usual hydrothermal process, NaNbO3 nanocube (rather than nanowire) is crystallized.8 Prior to the crystallization of NaNbO3nanocube, it is observed
in situ an intermediate crystalline phase, i.e. Sandia octahedral molecular sieve Na2Nb2O6−H2O with nanowire morphology.9
The Na2Nb2O6−H2O nanowire transforms into NaNbO3 nanowire (not nanocube) after thermal annealing.10,11 Importantly, the NaNbO3 nanowires are very long, ranging
from tens to hundreds of micrometer and have high piezoelectricity.11To improve the piezoelectricity of NaNbO3
nanowires for nanogenerator and actuator applications,12the in situ investigation on the crystallization should be very important.9,13−15
In this paper, we utilized in situ transmission electron microscopy (TEM) in real time at atomic resolution to investigate the phase transformation from Na2Nb2O6−H2O to Received: August 26, 2012
Revised: October 2, 2012 Published: October 2, 2012
NaNbO3with the increase of temperature. Combined with in
situ X-ray diffraction (XRD), we directly showed that the phase transformation occurs after the dehydration and thermally excited atomic rearrangement is the main mechanism due to small Gibbs free energy difference. This work may provide insight for the growth kinetics during hydrothermal process and possible way for the design of high piezoelectric lead-free alkaline niobate nanowires.
2. EXPERIMENTAL SECTION
The Na2Nb2O6−H2O nanowires were synthesized by the
hydrothermal method. In this case, 0.24 mol of NaOH was dissolved in 20 mL of distilled water and then 3.76 mmol of Nb2O5 was added into the solution. The thoroughly stirred solution was transferred into a 25 mL Teflon lining in a stainless steel autoclave to undergo a hydrothermal reaction at 150°C for 4 h. The as-grown Na2Nb2O6−H2O nanowires were
further annealed at 300 and 600 °C for 12 h to obtain Na2Nb2O6 and NaNbO3 nanowires, respectively. The dehy-dration and phase transition were examined by thermogravim-etry (TG) and a differential scanning calorimetry (DSC) measurements, respectively. For these measurements, the temperature was slowly increased (∼10 °C/min). Fourier transform infrared (FT-IR, Bruker VERTEX 80 V) spectros-copy measurement was used to investigate the presence of water. For FT-IR spectroscopy measurement, the nanowires were mixed with KBr powder and dried at 120°C for 12 h.
High-resolution in situ XRD patterns were obtained via a Panalytical X’Pert Pro diffractometer with Cu Kα radiation. As-grown nanowires were placed in an Anton-Paar HTK 1200 furnace and heated up to 600 °C. To monitor the phase transformation with temperature, the scanning was performed during 30 min after the stabilization of given temperatures. To monitor the phase transformation with time at a given temperature, in addition, the scanning was performed within 1 min repeatedly for the diffraction angles of 2θ = 11−14° and 2θ = 31−34°.
High-resolution in situ TEM measurements were carried out by using a JEOL 2000 V UHV-TEM instrument (base pressure ∼3 × 10⁻¹⁰Torr) with a heating stage up to 1000°C. During
the real time observation, the temperature can be controlled simultaneously and the video recorder has a time resolution of 1/30 s. Fast Fourier transform technique was used tofilter the noise of the high-resolution images.
3. RESULTS AND DISCUSSION
In Figure 1, we show the two different crystalline structures of Na2Nb2O6−H2O and NaNbO3. The Na2Nb2O6−H2O consists
of NaO6and NbO6octahedra, as marked by chemical bonding,
and the remaining Na ions occupy sites in channels running along [010] (Figure 1a). The NbO6octahedra are connected to form double chains along [010], whereas the NaO6octahedra are connected into layers parallel to (001). The NaO6 layers
alternate with the layers containing NbO6double chains along
[001] direction.16 Peculiarly, the oxygen atoms in H2O
molecules, denoted as yellow spheres (Ow), take part in the chemical bonding with several Na ions to form NaO6
octahedra. On the other hand, the NaNbO3consists of NbO6
octahedra, as marked by chemical bonding, and Na ions (Figure 1d). The NbO6 octahedra connect to neighboring ones by corner sharing, as expected in the perovskite structure. Importantly, the Nb ions in NbO6 octahedra are not located
at the center but shifted along ⟨001⟩ directions. Hence, an electric polarization is spontaneously formed, which gives rise to the piezoelectricity of NaNbO3.
Medium-, high-resolution transmission electron microscopy (TEM), and fast Fourier transform (FFT) images are shown for Na2Nb2O6−H2O (Figure 1b, c) and NaNbO3(Figure 1e, f).
Both Na2Nb2O6−H2O and NaNbO3 have the nanowire
morphology and have high crystalline quality as evidenced by clear lattice fringes. The Na2Nb2O6−H2O nanowire grows along [1−10] and has monoclinic crystal structure (a = 17.114 Å, b = 5.0527 Å, c = 16.5587 Å, andβ = 113.947°) with C2/c symmetry. On the other hand, the NaNbO3 nanowire grows Figure 1.Crystal structure, medium-, and high-resolution transmission electron microscopy (TEM) images of Na2Nb2O6−H2O (a−c) and NaNbO3 (d−f). We show the fast Fourier transform (FFT) patterns for a Na2Nb2O6−H2O along the [110] zone axis (inset of c) and for a NaNbO3along the [120] zone axis (inset of f). In (a) and (d), we denote Na, Nb, O, and Owatoms as green, purple, light blue, and orange spheres, respectively. Here, Owdenotes the oxygen atoms in H2O molecules.
along [001] and has orthorhombic crystal structure (a = 5.567 Å, b = 7.764 Å, and c = 5.515 Å) with P21ma symmetry.17
As explained in the Experimental Section, the NaNbO3 nanowires are obtained through the thermal annealing of the Na2Nb2O6−H2O. While the morphologies of Na2Nb2O6−H2O and NaNbO3 are nearly the same (Supporting Information,
Figure S1), the piezoelectric properties are significantly different. Piezoresponse force microscopy (PFM) amplitude and phase images clearly suggest that the piezoelectricity of NaNbO3nanowire is strong while that of Na2Nb2O6−H2O is
negligible (Supporting Information, Figure S2).
To obtain insight about the phase transformation, we show thermogravimetry (TG) and differential scanning calorimetry (DSC) results in Figure 2a. For these measurements, we
increased temperature slowly (∼10 °C/min) to reach thermal equilibrium for each temperature. The mass of Na2Nb2O6− H2O suddenly decreases at ∼288 °C, corresponding to an
endothermic reaction. After the endothermic reaction, there is one more exothermic reaction at∼474 °C without significant change of mass. From these results, we can infer that the H2O molecules in Na2Nb2O6−H2O dehydrate at 288 °C and
dehydrated Na2Nb2O6transform into NaNbO3at 474°C.16 In Figure 2b, we show the Fourier transform infrared (FT-IR) absorption spectra of Na2Nb2O6−H2O, dehydrated Na2Nb2O6, and NaNbO3 nanowires. The Na2Nb2O6−H2O
clearly shows the strong absorption peaks from H2O molecules near 3200 and 3400 cm−1, while the dehydrated Na2Nb2O6and
NaNbO3 show negligible peaks. Optical phonon modes of dehydrated Na2Nb2O6located near 700 cm−1are rather similar
to those of Na2Nb2O6−H2O but quite different from those of NaNbO3.
To trace the structural evolution along with the phase transformation, we show the in situ X-ray diffraction (XRD) patterns with the increase of temperature (Figure 3a). The in situ X-ray diffraction patterns clearly show that the crystalline structure changes from Na2Nb2O6−H2O to NaNbO3. For example, the peaks located at 2θ ∼ 10° become sharply reduced and broaden, and thenfinally disappear above 500 °C. On the other hand, the peaks located at 2θ ∼ 32° become significantly
reduced at 300°C and then sharply increase above 400 °C at the different angles.
Interestingly, the dehydrated Na2Nb2O6 changes into NaNbO3with the elapse of time. In Figure 3b, we show the
X-ray diffraction patterns at 400 °C at the given elapsed time from the initial measurement. Each diffraction pattern was obtained in 1 min to trace the time evolution of XRD patterns. As representative peaks for Na2Nb2O6 and NaNbO3,
respectively, we focused the diffraction patterns located at 2θ = 11−14° and 31−34°. The diffraction peaks for Na2Nb2O6
(left panel) decrease with time, while those for NaNbO3(right panel) increase with time. The initial Na2Nb2O6 phase is
completely transformed into NaNbO3phase after 12 min. Such a phase transformation does not occur below 300°C, close to the dehydration temperature, within our measurement time (∼800 min). As shown in Supporting Information Figure S3, the phase transformation slowly (quickly) occurs at low (high) temperature.
In Figure 3c, we show the phase diagram for Na2Nb2O6− H2O, Na2Nb2O6, and NaNbO3 with temperature and time.
Before dehydration, the Na2Nb2O6−H2O does not change at all within our measurement time (∼105s). After dehydration, the Na2Nb2O6−H2O changes into Na2Nb2O6 and then finally NaNbO3 with the increase of temperature. The destabilized
Na2Nb2O6, due to the evaporation of oxygen atom (Ow) in NaO6octahedra, changes into NaNbO3as well with the elapse
of time. We note that the phase transformation time (tph) follows a simple Arrhenius equation, that is, tph = t0 exp(Eg/
kBT) with the activation energy of Eg= 2.0 eV.
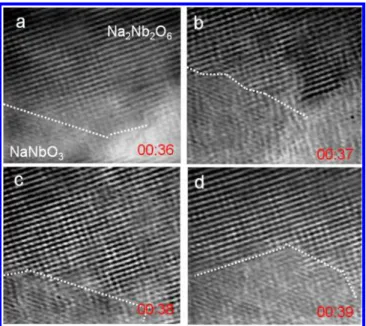
To investigate the growth kinetics of NaNbO3 from
Na2Nb2O6in detail, we conducted in situ TEM measurement in real time at atomic scale. Figure 4 shows a series of in situ high-resolution TEM images obtained at 500 °C. The time shown in each panel represents the elapsed time from the initial measurement. Note that we obtained images at one position for Figure 4a,b and at another position for Figure 4c,d. The interface clearly moves randomly accompanying the phase transformation from Na2Nb2O6to NaNbO3with the elapse of
time. (Real time movement obtained at 500°C is shown in the Supporting Information, Movie 1.) In consistency with the in
Figure 2. (a) Thermogravimetry (TG) and differential scanning calorimetry (DSC) results of Na2Nb2O6−H2O with the increase of temperature. (b) Fourier transform infrared (FT-IR) absorption spectrum of Na2Nb2O6−H2O (black line), Na2Nb2O6 (green line), and NaNbO3(purple line).
Figure 3.(a) In situ X-ray diffraction (XRD) patterns of Na2Nb2O6− H2O with the increase of temperature. (b) Time evolution of XRD patterns at 400°C. Left and right panels are shown for the change of representative peaks for Na2Nb2O6 and NaNbO3, respectively. (c) Temperature dependence of phase transformation time in log-scale. Below 300 °C, close to dehydration temperature, the phase transformation occurs very slowly (>105s) or not.
situ XRD results, the phase transformation slowly occurs at 400 °C. (Real time movement obtained at 400 °C is shown in the Supporting Information, Movie 2.)
The detailed in situ TEM movie unambiguously shows that the phase transformation occurs through the atomic rearrange-ment, rather than oriented attachment after amorphization.10 Thermally excited atoms will rearrange to their lowest energy sites to form NaNbO3 perovskite structure at the expense of Na2Nb2O6. Since the time scale for the crystal growth should be
related to the speed of atomic rearrangement, it takes shorter time at higher temperature vice versa.
There are several important points in our in situ XRD and TEM results for the phase transformation from Na2Nb2O6−
H2O to NaNbO3. First, it has been known that there are two kinds of phase transformation modes depending on the Gibbs free energy (ΔG) difference between them.18 If the energy difference is small, fast atomic displacement occurs at an angstrom scale. If the energy difference is large, on the other hand, nucleation for a new crystalline phase and its subsequent growth occurs. In this respect, the observation of atomic displacement rather than nucleation may imply that the ΔG values of dehydrated Na2Nb2O6 and NaNbO3 are not so different. Second, many oxide nanostructures are synthesized by the hydrothermal method. Due to the dehydrolysis nature of hydrothermal processes, water is necessary as a solvent and it remains as a product. Therefore, it is necessary to have an insight for the role of water molecules in the crystallization of oxide nanostructures. While we do not directly investigate the phase transformation process from Na2Nb2O6−H2O to
NaNbO3in solution, our observation of dehydration-induced phase transformation might provide an insight into the crystallization of oxide nanostructures during the hydrothermal process.19,20Third, there are several important parameters such as water pressure, temperature, reaction time, and precursors which can affect the nucleation of nanomaterials during the hydrothermal reaction. Since the final physical properties of nanomaterials are critically influenced by the kinetic pathway of
the phase transformation,21our in situ observation may provide a clue for the control of kinetics to develop lead-free alkaline niobates nanowires, including transition metal doped NaNbO3,22,23with high piezoelectricity.
4. CONCLUSIONS
We report the direct observation of phase transformation from Na2Nb2O6−H2O to NaNbO3through in situ X-ray diffraction
and transmission electron microscopy measurements. With the increase of temperature, the Na2Nb2O6−H2O transforms into
metastable Na2Nb2O6 after dehydration and then finally into NaNbO3without changing the nanowire morphology. Notably,
metastable Na2Nb2O6transforms into NaNbO3with the elapse of time through the atomic rearrangement. Since the NaNbO3
nanowires are quite long and have piezoelectricity without any toxic element such as Pb, our work may provide a clue to realize alkaline niobate nanowires with enhanced piezoelectricity for lead-free piezoelectric nanodevices.
■
ASSOCIATED CONTENT*
S Supporting InformationScanning electron miscopy (SEM) images (Figure S1), topology, piezoelectric force microscopy (PFM) amplitude, and phase (Figure S2), in situ X-ray diffraction patterns at 300, 330, 350, and 500°C (Figure S3), in situ TEM movie at 500 °C (Movie 1), and in situ TEM movie at 400 °C (Movie 2). This material is available free of charge via the Internet at http://pubs.acs.org.
■
AUTHOR INFORMATION Corresponding Author *Telephone: +82 (32) 860 7659. Fax: +82 (32) 872 7562. E-mail: [email protected]. Author Contributions○These authors contributed equally. Notes
The authors declare no competingfinancial interest.
■
ACKNOWLEDGMENTSThis work was supported by the Korea Research Foundation Grant funded by the Korean Government (MOEHRD) (KRF-2008-313-C00253).
■
REFERENCES(1) Cross, L. E. Nature 2004, 432, 24−25.
(2) Saito, Y.; Takao, H.; Tani, T.; Nonoyama, T.; Takatori, K.; Homma, T.; Nagaya, T.; Nakamura, M. Nature 2004, 432, 84−87.
(3) Rödel, J.; Jo, W.; Seifert, K. T. P.; Anton, E.-M.; Granzow, T.; Damjanovic, D. J. Am. Ceram. Soc. 2009, 92, 1153−1177.
(4) Skidmore, A.; Milne, S. J. J. Mater. Res. 2007, 22, 2265−2272. (5) Lee, H. J.; Kim, I. W.; Kim, J. S.; Ahn, C. W.; Park, B. H. Appl. Phys. Lett. 2009, 94, 092902.
(6) Vasco, E.; Magrez, A.; Forró, L.; Setter, N. J. Phys. Chem. B 2005, 109, 14331−14334.
(7) Hu, Y; Gu, H.; Hu, Z.; Di, W.; Yuan, Y.; You, J.; Cao, W.; Wang, Y.; Chan, H. L. W. Cryst. Growth Des. 2008, 8, 832−837.
(8) Zhu, H.; Zheng, Z.; Gao, X.; Huang, Y.; Yan, Z.; Zou, J.; Yin, H.; Zou, Q.; Kable, S. H.; Zhao, J.; Xi, Y.; Martens, W. N.; Frost, R. L. J. Am. Chem. Soc. 2006, 128, 2373−2384.
(9) Modeshia, D. R.; Darton, R. J.; Ashbrook, S. E.; Walton, R. I. Chem. Commun. 2009, 68−70.
(10) Liu, L.; Li, B.; Yu, D.; Cui, Y.; Zhou, X.; Ding, W. Chem. Commun. 2010, 46, 427−429.
Figure 4.In situ high-resolution TEM image sequences of growing NaNbO3from dehydrated Na2Nb2O6at 500°C (from a to d). The white line represents an interface between Na2Nb2O6and NaNbO3. The time shown in each panel is units of minute (first two numbers) and second (second two numbers).
(11) Ke, T.-Y.; Chen, H.-A.; Sheu, H.-S.; Yeh, J.-W.; Lin, H.-N.; Lee, C.-Y.; Chiu, H.-T. J. Phys. Chem. C 2008, 112, 8827−8831.
(12) Jung, J. H.; Lee, M.; Hong, J.-I.; Ding, Y.; Chen, C.-Y.; Chou, L.-J.; Wang, Z. L. ACS Nano 2011, 5, 10041−10046.
(13) Pienack, N.; Bensch, W. Angew. Chem., Int. Ed. 2011, 50, 2014− 2034.
(14) Chen, L. J.; Wu, W. W. Mater. Sci. Eng. R 2010, 70, 303−319. (15) Strelcov, E.; Davydov, A. V.; Lanke, U.; Watts, C.; Kolmakov, A. ACS Nano 2011, 5, 3373−3384.
(16) Xu, H.; Nyman, M.; Nenoff, T. M.; Navrotsky, A. Chem. Mater. 2004, 16, 2034−2040.
(17) Johnston, K. E.; Tang, C. C.; Parker, J. E.; Knight, K. S.; Lightfoot, P.; Ashbrook, S. E. J. Am. Chem. Soc. 2010, 132, 8732−8746. (18) Chung, S.-Y.; Kim, Y.-M.; Kim, J.-G.; Kim, Y.-J. Nat. Phys. 2009, 5, 68−73.
(19) Xu, C.-Y.; Zhen, L.; Yang, R.; Wang, Z. L. J. Am. Chem. Soc. 2007, 129, 15444−15445.
(20) Rørvik, P. M.; Grande, T.; Einarsrud, M.-A. Adv. Mater. 2011, 23, 4007−4034.
(21) Burda, C; Chen, X.; Narayanan, R.; El-Sayed, M. A. Chem. Rev. 2005, 105, 1025−1102.
(22) Nyman, M.; Tripathi, A.; Parise, J. B.; Maxwell, R. S.; Nenoff, T. M. J. Am. Chem. Soc. 2002, 124, 1704−1713.
(23) Pless, J. D.; Garino, T. J.; Maslar, J. E.; Nenoff, T. M. Chem. Mater. 2007, 19, 4855−4863.