April 2005 pp. 195-224
The Effects of the Integrated Income
Tax System and CPA Tax Attestation
on Corporate Tax Noncompliance
Mei-Juh Huang
†Ming Chuan University
Suming Lin
Kuo-Tay Chen
National Taiwan University
ABSTRACT: Taiwan has adopted the integrated income tax system since 1998. However, extant literature is lack of evidence on its effect upon corporate tax noncompliance. This paper investigates whether noncompliance decreases after the implementation of the integrated income tax system. We also study the effect of CPA tax attestation on corporate tax noncompliance. In order to resolve the issue of potential self-selection bias when a firm chooses between alternative tax filing modes, we employ an endogenous switching regression (ESR) model to analyze business income tax returns filed during the period between 1996 and 2000. The results reveal that self-selection bias does exist; hence, correcting for this self-selection bias is necessary. The results also indicate that CPA attested tax returns are more compliant than non-CPA attested tax returns both before and after the implementation. In addition, we find that firms’tax noncompliance level, on average, decreases after the implementation.
Keywords: Tax noncompliance, Integrated income tax system, CPA tax
attestation, Endogenous switching regression model.
This paper has benefited from the comments of two anonymous referees, as well as helpful suggestions offered by Professor Ming-Chin Chen, Professor Shuen-Zen Liu and participants in accounting workshop at National Taiwan University. The authors are also grateful to the Data Processing Center, Ministry of Finance, for the data used in this study.
†
I. INTRODUCTION
T
his study investigates whether Taiwan’s adoption of the integrated income tax system affects corporate taxpayers’noncompliance behavior, and whether a certified public accountant’s (CPA) tax attestation service affects corporate noncompliance before and after the income tax integration.1 This investigation is important since tax evasion results in tax revenue losses to the national treasury, thus seriously damaging proper functioning of the public sector. The empirical results in this study can help policymakers assess the impact of tax policies on noncompliance. They can also help tax authorities plan more effective and efficient tax audits.Because the laws mandate the confidentiality of corporate tax returns, empirical evidence on corporate tax noncompliance is limited. Most of U.S.-based tax compliance studies focused mainly on individual behavior (e.g., Clotfelter 1983, Witte and Woodbury 1985, Feinstein 1991, Erard 1993, and Erard 1997). However, since corporate tax noncompliance involves multiple party strategic behaviors; it is more complicated than individual income tax noncompliance. Therefore, evidences about individual income tax noncompliance behavior cannot be generalized into corporate income tax noncompliance (Chan and Mo 2000).
Taiwan adopted the integrated income tax system on January 1, 1998. Since this tax reform reduces the tax burden of shareholders, companies might become more tax compliant as potential benefits from underreporting income decrease. However, in those countries that have adopted the integrated income tax system in the past, there has been lack of empirical evidence on such a conjecture. Consequently, this tax reform in Taiwan provides an exceptional opportunity for investigating the effect of the implementation of the integrated income tax system on corporate tax noncompliance.
Furthermore, Article 102 of the Income Tax Law in Taiwan stipulates that a firm may entrust a CPA to prepare, attest, and file its business income tax return.2 The legislation aimed to reduce the workload of tax authorities and assist firms in meeting their tax obligations. However, studies in the U.S. indicated that, while tax professionals can alleviate many of the computational and informational barriers to tax compliance, they also possess the expertise to assist their clients in exploiting opportunities for tax noncompliance (Klepper et al. 1991, Udell 1991, and Dubin et al. 1992). In contrast to the inconclusive findings documented in the U.S. studies, Lin (2000) found that CPA attested tax returns in Taiwan evade less corporate income tax than non-CPA attested tax
1
Taiwan adopted the full imputation credit prototype as the core of the integrated income tax system in 1998. Under this new system, the corporate income tax rate remains at 25% and the individual income tax rate ranges from 6% to 40%. For dividend income, individual shareholders will be allowed a tax credit against their individual income tax for the corporate income tax paid at the corporate level. Dividends paid to corporate shareholders are exempted from corporate income tax, and the imputation credit will be fully passed to individual shareholders. However, due to the difference between the rate of corporate income tax and individual income tax, firms may be induced to retain earnings to defer their shareholders’individual income tax. Therefore, earnings not distributed in the second year are subject to an additional 10% corporate income surtax. Tax credits will also be given for the surtax if the retained earnings are distributed later on.
2
returns. However, Lin (2000) ignored a methodological problem that corporate taxpayers are not randomly assigned to alternative modes of tax returns preparation (CPA-attested vs. non-CPA-attested). Following Erard (1997), if unobserved factors influencing the decision to employ CPA tax attestation (e.g., the level of tax knowledge) are correlated with unobserved factors influencing the tax reporting decision (e.g., the attitude toward risk taking), then it is necessary to control for the influence of self-selection on observed noncompliance outcomes. Therefore, this study extends Lin’s (2000) framework by using an endogenous switching model to incorporate the self-selection bias correction (Maddala 1983 and 1991).
We collected and analyzed data of business income tax returns filed in Taiwan during the period between 1996 and 2000. The endogenous switching regression (ESR) analysis reveals that self-selection bias does exist. That is, the tax-filing mode is endogenous in the model of tax noncompliance behavior. Thus, it is necessary to correct for this self-selection bias. The results also show that, for both filing modes, noncompliance level decreases after the implementation of the integration income tax system. We also find that firms’characteristics (e.g. income level, effective tax rate, and whether a firm enjoys certain kinds of tax credits) have significant influence on tax noncompliance. In addition, the magnitudes and the signs of their estimated coefficients are different between pre- and post-implementation periods. This implies that firms’tax evasion behavior has changed after the implementation. Our analysis also reveals that CPA-attested tax returns are more compliant than non-CPA-attested tax returns both pre-and post-implementation.
Some other countries have considered adopting the integrated income tax system; for example, the American Congress discussed the proposal of an imputation tax system in December 2002.3 Our empirical evidence in Taiwan may help the policymakers in those countries predict whether firms’tax evasion behavior will be affected significantly. It can also help tax authorities assess the impact of CPA tax attestation on corporate noncompliance, and plan more effective and efficient tax audits. Our results suggest that tax authorities may expand the scope of CPA attested tax returns to reduce tax noncompliance, and that they can transfer some of the audit efforts from CPA attested tax returns to non-CPA attested tax returns to uncover more tax evasion. Moreover, since our results reveal that firms with tax credits are more compliant than others, tax authorities may select a higher proportion of firms without any tax credits for audit.
The remainder of this paper is organized as follows. Section 2 reviews previous related studies. Section 3 describes the data collection procedure. Section 4 explains the development and estimation of the endogenous switching regression model. Section 5 presents the estimation results, and Section 6 offers concluding remarks.
II. LITERATURE REVIEW
Ever since the 1970s, tax evasion has attracted considerable worldwide attention among academic researchers. This section briefly reviews the previous work on tax evasion related to our study.
3
Determinants of Tax Compliance
Allingham and Sandmo (1972) presented one of the earliest and most famous analytical studies on tax evasion. Their model, a straightforward application of individual choice based on expected utility theory, aimed to determine the effect of government instruments (e.g., penalty for evasion, audit probability and tax rates) on tax evasion. They proved that under-reported income would drop as the government increases the penalty rate or the probability of audit. However, their theoretical analysis failed to determine any clear-cut relationship between tax rate and reported income. Similarly, Yitzhaki (1974) also constructed a theoretical model based on expected utility theory to investigate the same relationship. He demonstrated that if the penalty was proportional to the amount of tax evaded instead of the under-declared income, then tax evasion would decrease when the tax rate increases.
As a pioneering empirical study about tax evasion, Clotfelter (1983) used 1969 data from the US Internal Revenue Service’s(IRS) Taxpayer Compliance Measurement Program (TCMP) to investigate the relationship between marginal tax rate (MTR) and individual income tax evasion. His most important finding was that both MTR and the level of after-tax income were positively correlated with tax evasion. Since the dependent variable, tax evasion, was censored at zero, Clotfelter, therefore, adopted Tobit regression analysis. Our paper, likeClotfelter’s,employs the Tobit model for the prediction of tax evasion.
Feinstein (1991) used pooled data from the 1982 and 1985 TCMPs to investigate the effect of MTR on tax evasion. One advantage of his data is that MTRs had changed over this period for the same levels of income. The result indicated that a significant negative relationship exists between MTR and tax evasion. Interestingly, this result is consistent with Yitzhaki’s analytical proof, but conflicts with Clotfelter’s empirical finding.
In contrast to studies in the U.S., Chan and Mo (2000) investigated the effect of tax holidays on foreign investors’tax noncompliance behavior in China’s developing economy. Their results showed that a company’s tax-holiday position would affect its noncompliance behavior. Companies are least compliant before entering a tax holiday, and most compliant while in a tax-exemption period. In addition, domestic market-oriented companies, service-oriented companies, and joint ventures are less compliant than export-oriented companies, manufacturing-oriented companies, and wholly foreign-owned enterprises, respectively.
In Taiwan, a few studies have also investigated tax evasion. Huang (1982) compared the income reported in all of the individual income tax returns with the personal income aggregated in the national income accounts. He concluded that about 71% of income was unreported by taxpayers in the 1979 tax year. Also based on national income accounts, Chen (1987) claimed that around 53% of total business income was unreported in the 1983 business income tax returns. Chu (1988) interviewed 54 Taiwan’s CPAs in an attempt to sort out the possible factors that cause businesses to evade tax. According to his MIMIC (multiple-indicator-multiple-cause) analysis, significant contributing indicators included the quality and integrity of tax officials, the tax rate structure, and the flexible interpretation of the tax law.
Determinants of Employing Tax Professionals
Several theoretical researches have aimed to explore the various roles played by tax professionals in tax filings. Scotchmer (1989) and Beck and Jung (1989) investigated tax professionals’role in reducing taxpayers’uncertainty about their legal tax obligations. In contrast, Slemrod (1989) examined the effectiveness of tax professionals in uncovering legal ways to avoid tax liabilities. More comprehensively, Long and Caudill (1987) empirically demonstrated that employment of tax professionals is positively related to marginal tax rate, income level, and tax complexity. In addition, it is affected by the source of income and whether the filing entity is self-employed.
In Taiwan, Wang et al. (1993) conducted a questionnaire survey and held panel discussions to examine the benefits of filing CPA attested tax returns. They found that the main reasons for companies to employ CPA attested tax returns included: ‘a good bargain to entrust tax attestation along with financial attestation’, ‘can enjoy tax preferences’, and ‘required by tax regulations’. Tax officials and businesses also claimed that CPAs can help firms fulfill their tax obligations and, at the same time, safeguard the firms’interests. Moreover, tax attestation reduces tax authorities’audit workload and costs.
Chen et al. (2002) used 1996 tax return data to investigate the fairness of prescribed limits on firms’entertainment expense in Article 37 of the Taiwan Income Tax Law. One of their main findings was that CPA attested tax returns claimed significantly greater percentages of entertainment expenses than non-CPA attested tax returns, suggesting that firms had used CPA attested tax returns to take advantage of the higher entertainment expense allowance.
Huang (1999) and Lin (2002) both used empirical data to analyze the determinants of using CPA attested tax returns by Taiwan’s medium-size enterprises. While Huang (1999) used a probit model to analyze business income tax returns filed for the 1996 tax year, Lin (2002) used a logit model to analyze business income tax returns for the years of 1996-1999 to additionally incorporate the potential effects of the integrated income tax system. Both of their findings indicate that company size, affording ability of CPA services, demands for financing, company organization, and deductions for entertainment expenses were the most significant determinants of employing CPA attested tax returns. However, implementation of the integrated income tax system has no effect on the usage of CPA tax return attestation.
Impacts of Employing Tax Professionals on Tax Noncompliance
Klepper et al. (1991) developed a theoretical model to predict the role of CPAs in tax noncompliance. The model jointly addressed the decision to engage a tax professional and the tax evasion outcomes conditional on whether a professional was engaged. He then used the 1982 TCMP data to conduct empirical analysis. The empirical results supported what they had predicted. When ambiguous line items were involved, tax professionals would play an advocacy role, thus contributing to greater noncompliance; whereas, in the case of unambiguous line items, the same professionals would play an enforcement role, contributing to greater compliance.
However, a factor not accounted for by Klepper et al. (1991) is that taxpayers freely choose whether to hire tax professionals. To account for the role of self-selection in compliance outcomes, Erard (1993) employed an endogenous switching regression model
that jointly accounts for the choice of tax preparation mode and the level of noncompliance. Within his specification, a correlation between the preparation mode and compliance choice is allowed. Erard analyzed a random sub-sample of about 14,000 observations from the 1979 TCMP. Contrary to earlier studies, he found that the level of income did not influence the employment of a tax professional; rather, it was the source of income, such as farm, rental or royalty income, that encourages the use of a tax professional. Most importantly, he found that employing an attorney or CPA specialist to prepare returns is significantly associated with increased noncompliance, even after controlling for self-selection.
In Taiwan, Lin (2000) also examined the impact of CPAs’tax attestation on tax evasion, using a Tobit model to analyze micro-level data in business income tax returns filed for the 1994 tax year.4 While Erard (1993) found that U.S. tax professionals contributed to higher noncompliance, Lin (2000) concluded that Taiwan’s CPA attested tax returns evaded less tax than non-CPA attested tax returns. However, unlike Erard (1993), Lin’s model did not control for the self-selection bias. Therefore, this study follows Erard (1993) by employing an endogenous switching regression model to control for self-selection bias. We believe such an extension can provide better evidence to clarify the role of CPA tax attestation on Taiwan’s corporate noncompliance.
III. DATA COLLECTION PROCEDURE
Data in the business income tax returns filed for the years of 1996, 1997, 1999, and 2000 are collected from the Data Processing Center of the Ministry of Finance in Taiwan for this study. Since the integrated income tax system was implemented on January 1, 1998, we exclude all the data for 1998 from our analysis to avoid potential confounding effects. As a result, the pre-implementation period ranges from 1996 to 1997 while the post- implementation period ranges from 1999 to 2000.
We have also taken several additional steps to refine our data. First, we delete firms with missing or unreasonable values. Second, we remove all financial and insurance companies, because they are legally required to use CPA attested tax returns. Third, we exclude firms with total revenue below NT$30 million, as they have the option of adopting the Expanded Paper Review (EPR)5 system, and records in the EPR returns are often incomplete. In addition, firms whose net sales were equal to or greater than NT$100 million are also eliminated from the sample because they are compelled to use CPA attested tax returns. Finally, we delete returns of non-profit organizations, foreign corporation branches in Taiwan, government-controlled firms, firms changing their fiscal year, liquidated firms, and those returns filed after the due date. The final sample includes 131,363 returns, of which there are 38,800, 41561, 42210 and 8,792 returns in 1996, 1997,
4
Lin (2000) investigated the impact of CPA tax attestation on corporate noncompliance before Taiwan integrated the corporate and individual income taxes.
5
The EPR system can be used by firms whose total amount of net operating revenue and gross non-operating revenue (excluding tax exempt income and transaction gains from lands as well as adhered properties of lands) is NT$30 million or less. Irrespective of the gains or losses that a firm has actually made, once the firm’s reported net profit ratio reaches the prescribed industry standard (around 6%), and full tax payment is made, the EPR system will assess the firm’s income tax only in light of the information available on the ‘papers’presented with the tax returns.
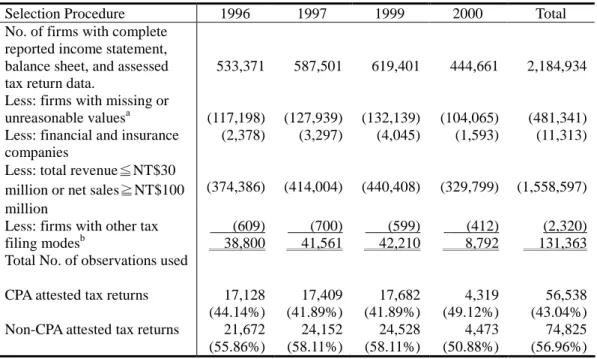
1999 and 2000, respectively.6 Table 1 provides a reconciliation of the sample size for each year.
Table 1: Sample Selection Procedure and Number of Sample Observations
Selection Procedure 1996 1997 1999 2000 Total
No. of firms with complete reported income statement, balance sheet, and assessed tax return data.
533,371 587,501 619,401 444,661 2,184,934
Less: firms with missing or
unreasonable valuesa (117,198) (127,939) (132,139) (104,065) (481,341)
Less: financial and insurance companies
(2,378) (3,297) (4,045) (1,593) (11,313)
Less: total revenue≦NT$30 million or net sales≧NT$100 million
(374,386) (414,004) (440,408) (329,799) (1,558,597) Less: firms with other tax
filing modesb
Total No. of observations used
(609) 38,800 (700) 41,561 (599) 42,210 (412) 8,792 (2,320) 131,363
CPA attested tax returns 17,128
(44.14%) 17,409 (41.89%) 17,682 (41.89%) 4,319 (49.12%) 56,538 (43.04%)
Non-CPA attested tax returns 21,672 24,152 24,528 4,473 74,825
(55.86%) (58.11%) (58.11%) (50.88%) (56.96%)
Note:
a. We delete firms with missing or unreasonable values, such as the amount of total assets, total liabilities, current assets, current liabilities, capital, or bank debt are negative.
b. Other tax filing modes include returns of non-profit organizations, foreign corporate branches in Taiwan, government-controlled firms, firms changing their fiscal year, liquidated firms, and returns filed after the due date, etc.
IV. RESEARCH METHODOLOGY
According to econometrics studies (e.g. Heckman 1976, 1979, Lee 1978, Barnow et
al. 1981, and Maddala 1983), when self-selection bias exists, using normal OLS
regression models could result in inefficient and inconsistent estimates. Therefore, we employ an endogenous switching regression model to avoid the problem. The model embeds the probit model of CPA attestation usage within the regression model of tax noncompliance. This section explains the derivation of the model.
Econometric Framework
The endogenous switching regression (ESR) model is developed for joint analysis of tax filing modes selection and tax noncompliance. Since sizable proportion of tax returns do not evade tax, this study, following Clotfelter (1983), uses a Tobit model to
6
The number of firms in 2000 is disproportionately smaller than other years. We checked our SAS programs several times and found no errors. The abnormality is caused by the much smaller assessed tax return data in 2000.
account for returns with zero noncompliance. As mentioned previously, the level of noncompliance may depend on the chosen mode of tax filing. Therefore, two separate Tobit equations should be used to model noncompliance levels (denoted as Y) for CPA attested tax returns and non-CPA attested tax returns, respectively. These two equations are formulated as follows:
c i ci ciX
Y
(1)
n i ni niX
Y
(2)Thesubscripts‘c’and ‘n’representCPA attested and non-CPA attested tax returns respectively.
Y
ci andY
nirepresent latent variables for the propensity of firm ‘i’ to underreport tax liabilities under the alternative filing modes.X
i represents a vector offirm and tax return characteristics that influence the decision of tax evasion, such as tax rates, audit rates, level of true income, and financial position. The terms
ciand
nirepresent random errors, and
cand
nrepresent parameter vectors to beestimated. It is assumed that
X
iis independent of the errors.The decision to adopt CPA tax attestation is modeled using a probit model:
i ii Z
P (3)
P
i is also a latent variable, representing the expected net benefits from choosing CPA attested returns over non-CPA attested returns. A firm would choose to use CPA tax attestation if
P
i
is greater than zero; otherwise, it would employ the non-CPA attested tax filing mode. Accordingly, we define
P
i= 1 ifP
i>0, = 0 otherwise.
The term
P
iis an observableindicatorofthetax filing modethatfirm ‘i’selects.Itequals one when the CPA attested tax return is employed and zero otherwise.
Z
i represents factors that might influence the choice of tax filing mode, such as firm size, profitability, and level of tax return complexity. It is assumed thatZ
i is independent of the disturbance
i.The propensity for tax evasion,
Y
ci andY
ni, is not observable. Rather, what is observed is the assessed additional tax,Y
ciandY
ni. Therefore:Y
ci=Y
ci if
P
i=1 andY
ci>0
and
Y
ni=Y
ni ifP
i=0 andY
ni >0 = 0 otherwise.Based on the endogenous switching regression model described by Maddala (1983), we assume that the errors [
ci,
ni, and
i] are trivariate normally distributed with zeromeans and a covariance matrix
:7 1 2 2
n n c cn cAssume that we have n observations, of which
nc
are CPA attested tax returns andnn
are non-CPA attested tax returns (n
c
n
n
n
). In order to estimate
cand
2
c for
the
nc
observations onY
ci, and estimate
nand
2n for thenn
observations onY
ni, we can, based on Greene (2000), re-write Equations (1) and (2) as:
c i c c ci ci ci X Y (4)
n i n n ni ni ni X Y (5)The terms
ciand
ni represent the self-selection correction terms for each sample observation, while
c
c and
n
nare their coefficients. The inefficiency or inconsistence of the usual OLS estimates arises from the omission of
ciand
ni. In addition, as Maddala (1991) stated, in the case of the Tobit model, there is a need to correct the standard errors because
ciand
niare“generated regressors.”Thus,weuse the maximum likelihood procedure programmed by Greene (2002) to meet this requirement.Empirical Model
Based on the derivation in last section, we specify our endogenous switching regression model as follows:8
7
We assume Var(
i)=1 becauseP
iis observed only as a dichotomous indicator. On the other hand, since we do not observeY
ciandY
nifor the same individual,
cnwould not be estimable even if it were assumed to be nonzero (see Maddala 1983, 1991).8
,0 ,1 ,2 ,3 ,4 ,5
c c c LNINC c ETR c ORG c AUDIT c WITHHOLD
URTL
,6 ,7 ,8 ,9
c QUICK c DEBT c CREDIT c CPI
13 19 8 12 10 , i 14 , j c i c iDISTRICT j c jIND (6) ,0 ,1 ,2 ,3 ,4 ,5
n n n LNINC n ETR n ORG n AUDIT n WITHHOLD
URTL
,6 ,7 ,8 ,9
n QUICK n DEBT n CREDIT n CPI
13 19 8 12 10 , k 14 , l n k n kDISTRICT l n lIND (7) and 0 1 2 3 4 5
CPA LNTAPROFIT ORGEXPRATELNRE
12
6DEBT 7ETR 8DONATE m 9 mDISTRICTm 7
18 11 13 n n nIND (8)
wherethesubscripts‘c’and ‘n’representCPA attested and non-CPA attested tax returns, respectively. The
c,
n and
are random error terms and the
’sand β’sarethe parameters to be estimated. Table 2 lists the detail definitions of these variables in the equations.In Equation (8), we hypothesize that the choice of using CPA attested tax returns is determined by (1) the natural logarithm of total assets (LNTA), (2) profit rate (PROFIT), (3) legal form of the firm (ORG), (4) ratio of entertainment expenses to total sales (EXPRATE), (5) the natural logarithm of retained earnings (LNRE), (6) debt ratio (DEBT), (7) effective tax rate (ETR), (8) ratio of donation to total sales (DONATE), (9) district of the national tax administration (DISTRICT1,…, DISTRICT5), and (10) industry affiliation (IND1,…, IND7).
According to an U.S. IRS survey (1987), CPAs’clients tend to have more complex returns. In Taiwan, since the definition and calculation of retained earnings are complicated, in order to report the amount of retained earnings correctly, firms with higher amount of retained earnings are more likely to seek the assistance of tax professionals. In addition, compared with other types of organization, limited-by-shares corporations generally have more shareholders and face higher pressure from shareholders to prepare reliable financial statements and correct tax returns. Thus, they are more likely to seek the assistance of CPAs. Moreover, firms with larger donation often need assistance of tax professionals for tax planning. Therefore, this study uses total
correction terms as shown in Equations (4) and (5) are obtained during the estimation process of the endogenous switching regression.
assets (LNTA), retained earnings (LNRE), organization type (ORG), and donation ratio (DONATE) to represent the complexities of tax returns.
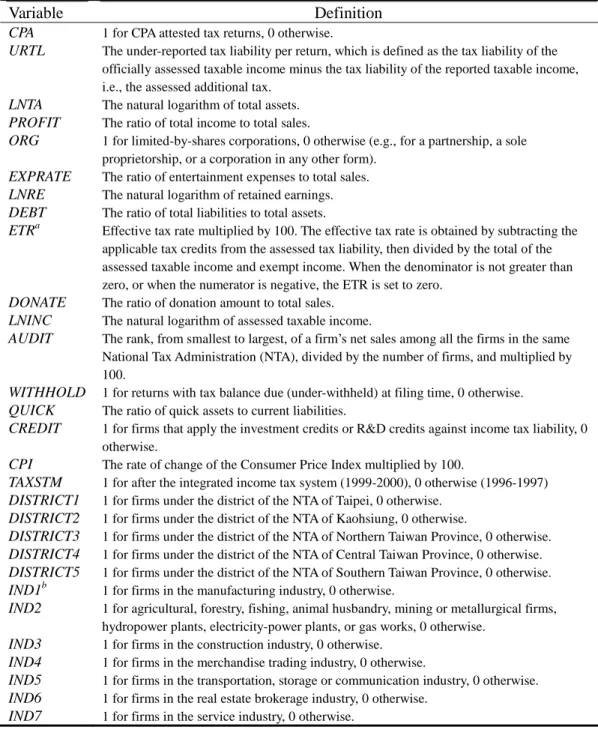
Table 2: Variable Definitions
Variable Definition
CPA 1 for CPA attested tax returns, 0 otherwise.
URTL The under-reported tax liability per return, which is defined as the tax liability of the officially assessed taxable income minus the tax liability of the reported taxable income, i.e., the assessed additional tax.
LNTA The natural logarithm of total assets. PROFIT The ratio of total income to total sales.
ORG 1 for limited-by-shares corporations, 0 otherwise (e.g., for a partnership, a sole proprietorship, or a corporation in any other form).
EXPRATE The ratio of entertainment expenses to total sales. LNRE The natural logarithm of retained earnings. DEBT The ratio of total liabilities to total assets.
ETRa Effective tax rate multiplied by 100. The effective tax rate is obtained by subtracting the applicable tax credits from the assessed tax liability, then divided by the total of the assessed taxable income and exempt income. When the denominator is not greater than zero, or when the numerator is negative, the ETR is set to zero.
DONATE The ratio of donation amount to total sales. LNINC The natural logarithm of assessed taxable income.
AUDIT The rank, from smallest to largest, of a firm’s net sales among all the firms in the same National Tax Administration (NTA), divided by the number of firms, and multiplied by 100.
WITHHOLD 1 for returns with tax balance due (under-withheld) at filing time, 0 otherwise. QUICK The ratio of quick assets to current liabilities.
CREDIT 1 for firms that apply the investment credits or R&D credits against income tax liability, 0 otherwise.
CPI The rate of change of the Consumer Price Index multiplied by 100.
TAXSTM 1 for after the integrated income tax system (1999-2000), 0 otherwise (1996-1997) DISTRICT1 1 for firms under the district of the NTA of Taipei, 0 otherwise.
DISTRICT2 1 for firms under the district of the NTA of Kaohsiung, 0 otherwise.
DISTRICT3 1 for firms under the district of the NTA of Northern Taiwan Province, 0 otherwise. DISTRICT4 1 for firms under the district of the NTA of Central Taiwan Province, 0 otherwise. DISTRICT5 1 for firms under the district of the NTA of Southern Taiwan Province, 0 otherwise. IND1b 1 for firms in the manufacturing industry, 0 otherwise.
IND2 1 for agricultural, forestry, fishing, animal husbandry, mining or metallurgical firms, hydropower plants, electricity-power plants, or gas works, 0 otherwise.
IND3 1 for firms in the construction industry, 0 otherwise. IND4 1 for firms in the merchandise trading industry, 0 otherwise.
IND5 1 for firms in the transportation, storage or communication industry, 0 otherwise. IND6 1 for firms in the real estate brokerage industry, 0 otherwise.
IND7 1 for firms in the service industry, 0 otherwise.
Notes:
a. We limit the range of the effective tax rate to be between 0 and 0.25; that is, if it is higher than 0.25, we truncated it at 0.25, and if it is lower than 0, we truncated it at 0.
b. The industry categorization is pursuant to the 6-digit industry code promulgated by the Ministry of Finance. Financial and insurance companies are not included in the sample because they are required to use CPA attested tax returns and their audit rules are different from other industries due to their specific characteristics.
Huang (1999) and Lin (2002) found that more profitable firms were more able to afford attestation fees. Also, firms with higher financing needs are more likely to employ financing attestation. On the other hand, compared with non-CPA attested returns, CPA attested tax returns are allowed to deduct a higher level of entertainment expenses from taxable income (Chen et al. 2002). Therefore, following prior studies, this study also anticipates that firms with higher profit ratio (PROFIT), debt ratio (DEBT) and entertainment expenses ratio (EXPRATE) are more likely to adopt CPA attested tax returns.
In addition, Long and Caudill (1987) and Christian et al. (1993) both argued that tax professional employment was positively related to tax rate because tax liability reduction became more desirable as the tax rate increased. Accordingly, we include tax rate as a measure of the value of CPA tax attestation services. Following Lin (2000) and Hsu et al. (2000), this study uses effective tax rates (ETR) rather than marginal tax rates (MTR) as an explanatory variable for tax filing mode. This is because the applicable marginal corporate tax rate will be 25% for all the firms with annual taxable income over NT$100,000. If we used MTR, there will be no differentiation among a great number of firms.
Finally, we add two sets of dummy variables, DISTRICTiand INDi, to control for the
regional effects and industry effects. DISTRICT1 to DRSTRICT5 represents the five national tax administration offices. Following Lin (2000), all firms are classified into seven industry categories (IND1,…,IND7) according to the 6-digit industry code (see
Table 2).
On the other hand, in Equations (6) and (7), we define tax noncompliance as the under-reported tax liability per return (URTL). We hypothesize that URTL is influenced by: (1) the natural logarithm of assessed income (LNINC), (2) effective tax rate (ETR), (3) legal form of the firm (ORG), (4) audit rate (AUDIT), (5) withholding status (WITHHOLD), (6) quick ratio (QUICK), (7) debt ratio (DEBT), (8) tax credits status (CREDIT), (9) change rate of the Consumer Price Index (CPI), (10) district of the national tax administration (DISTRICT1,…, DISTRICT5), and (11) industry affiliation (IND1,…, IND7).
While both Allingham and Sandmo (1972) and Clotfelter (1983) used under-reported income as the proxy for tax evasion, this study, following Lin (2000), defines tax evasion as the amount of under-reported tax liability (URTL). We believe such a definition can better represent the magnitude of tax evasion. The under-reported tax liability is derived as the tax liability that tax officials determined to be due, minus the tax liability reported in the tax return. The level of noncompliance is set to zero for returns that over-report. As a result, it includes not only ‘intentional’tax evasion subsequently detected, but also the additional assessed tax liability resulting from the rejection of
claimed expenses, or the upward adjustment of receipts arising from tax officials’ opposition to taxpayers’advantageous interpretations of the tax law. In other words, tax evasion in this study includes both intentional and unintentional under-reported tax liability. According to this definition, however, over-reported expenses and under-reported revenues that tax officials failed to discover in their audits are not included.9
According to Alm et al. (1933), people become less risk aversive as their income increases, thus, income can be treated as a proxy for risk aversion. They also claimed that taxpayers with higher taxable income have greater opportunity to commit noncompliance, due to the higher complexity of their financial circumstances. Therefore, we can expect that income (LNINC) should be positively related to noncompliance. In addition, the effective tax rate (ETR) is included as a measure of the price of tax compliance (Erard 1997); the higher the effective tax rate, the more expensive to report an additional dollar of taxable income. Accordingly, we hypothesize that ETR is positively related to noncompliance.
Rice (1992) stressed that publicly traded corporations are subjected to more public disclosure requirements, forcing them to more comply with tax laws than closely held firms. Similarly, Lin (2000) argued that the more widespread the ownership, the less likely that a small number of people can share the benefits of tax evasion. Therefore, he presumed that a limited-by-shares corporation will evade less tax than other types of organizations (e.g., a partnership, a sole proprietorship, etc.). Accordingly, this study includes the legal form of firms (ORG) as an explanatory variable for tax noncompliance.
Similar to Lin (2000), this study uses AUDIT as a proxy for the probability of a tax return to be selected for audit. We define AUDIT= (1-R/S) * 100, where R is the ranking of a firm’s net sales in its tax jurisdiction in a descending order and S is the total number of firms in that jurisdiction. According to this definition, a firm with relatively higher net sales will have larger AUDIT. We posit that a firm with a larger AUDIT has a higher probability of being selected for audit by the tax office-in-charge, and that tax officials will scrutinize its tax return more closely. Therefore, AUDIT will be positively associated with the amount of tax evasion detected by the tax office.
Based on the prospect theory10 proposed by Kahneman and Tversky (1979), Chang and Schultz (1990) analyzed the 1982 TCMP data and found that differential tax noncompliance existed between taxpayers with additional tax due (under-withheld) at filing time and taxpayers who are due to receive tax refunds (over-withheld). More recently, Yaniv (1999) also developed a theoretical model based on the prospect theory to demonstrate mathematically that withholding status would affect the decision to evade tax. Following Chang and Schultz (1990), this study examines whetherafirm’swithholding
9
According to the business income tax returns data provided by the Data Processing Center of the Ministry of Finance, we cannot use firms’code numbers to combine the reported and assessed files of accumulated retained earnings with other tax files (such as tax files of income statement and balance sheet). Therefore, the definition of tax evasion in this paper doesn’t consider the amount of additional 10% surtax on undistributed earnings.
10
Prospect theory maintains that people are not rational decision-makers as posited by expected utility theory. Depending on their expectation of gains or losses, people will adopt different preference toward risk. If they expect a future profit, they will opt for risk-avoiding behavior. On the other hand, if they expect a loss, they will opt for a risk-seeking behavior.
position (WITHHOLD) at filing time has an impact on business income tax evasion. In addition, a firm’s financial positions may also affect its tax noncompliance behavior. A firm with a higher quick ratio had more funds available and less cash outflow pressure in the short term; therefore, it might have a lower propensity to evade tax (Lin 2000). Moreover, a firm with financial difficulty may use noncompliance as a means of increasing cash flow (Bradley 1994). This study, following prior literature, also adds quick ratio (QUICK) and debt ratio (DEBT) into our empirical model.
Chan and Mo (2000) provided empirical evidence that a firm’s tax-holiday position affects its noncompliance. They found that firms with tax credits had less incentive to underreport their taxable income because tax credits reduce their tax burden. In Taiwan, the Statute for Upgrading Industries and several other tax laws have promulgated that a company can enjoy investment tax credits and R&D credits to reduce its tax burden. Therefore, a tax credit status variable, CREDIT, is used as an explanatory variable for tax noncompliance. We posit that a firm with tax credit will be less inclined toward noncompliance.
Though many studies have investigated tax noncompliance in the context of constant prices, Fishburn (1981) developed a theoretical model of tax evasion that incorporated the general price level. With inflation, real disposable income falls if nominal disposable income remains unchanged. According to Fishburn (1981), one possible strategy for taxpayers facing inflation is to decrease tax payments to increase disposable income. In other words, tax noncompliance increases with inflation. Crane and Nourzad (1986) empirically analyzed the effect of inflation on aggregate tax evasion in the United States over the 1947-1981 period. They found that tax evasion in both absolute and relative terms was positively related to the inflation rate. Following Crane and Nourzad (1986), this study also uses the rate of change of the Consumer Price Index (CPI) as the measure of the inflation rate. Finally, two sets of dummy variables, DISTRICT1,…,
DISTRICT5 and IND1,…, IND7, are used to control for the regional effects and industry
effects.
V. ANALYSIS OF EMIRICAL RESULTS
Descriptive Statistics
Table 3 and Table 4 report descriptive statistics for all the variables used in this study. Forty three percents of the sample returns are CPA attested tax returns, while the remaining fifty seven percents are non-CPA attested tax returns.11
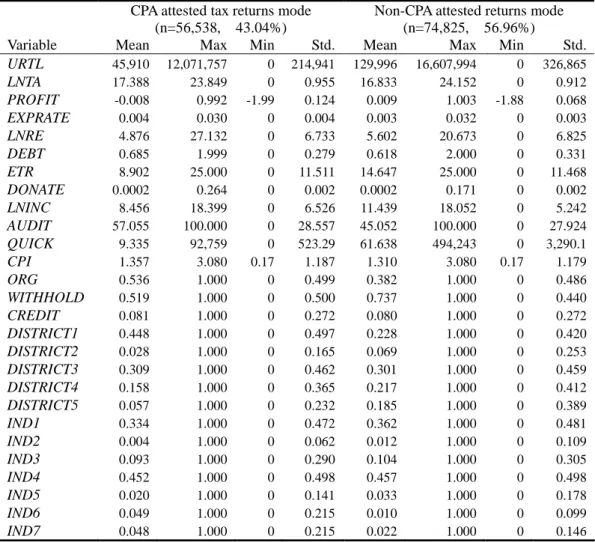
The summary statistics in Table 3 suggest some basic differences between these two filing modes. Firms filing CPA attested tax returns are, on average, larger in size (LNTA) than those filing non-CPA attested tax returns. The means of entertainment expenses ratio (EXPRATE), debt ratio (DEBT), and audit risk (AUDIT) are also larger for the CPA attested tax returns than for the non-CPA attested tax returns. Meanwhile, the CPA attested tax returns have higher percentage of limited-by-shares corporations (ORG), and are more likely to enjoy tax credits (CREDIT). However, they have lower profit rate
11
Note that our sample consists of firms with total receipts between NT$30 million and NT$100 million only.
(PROFIT), effective tax rate (ETR), retained earnings (LNRE), and percentage of firms with tax balance due (WITHHOLD=1) than non-CPA attested tax returns. More importantly, Table 3 shows that the average tax noncompliance (URTL) of CPA attested tax returns is $45,910, much smaller than the $129,996 average of non-CPA attested tax returns.
Table 3: Descriptive Statistics by Tax Filing Modes (n=131,363)
Table 4 presents descriptive statistics of variables for both pre- and post-implementation periods of the integrated income tax system. It reveals the effective tax rates (ETR) for both tax filing modes increase post implementation. In addition, Table 4 shows that URTL declines post implementation for both tax filing modes. We further use t-test and Kruskal-Wallis nonparametric test to test the differences between the pre-and post-implementation means. As revealed in Table 5, we find that the means of ETR and URTL differ significantly between the two periods for both tax filing modes.
CPA attested tax returns mode Non-CPA attested returns mode
(n=56,538, 43.04%) (n=74,825, 56.96%)
Variable Mean Max Min Std. Mean Max Min Std.
URTL 45,910 12,071,757 0 214,941 129,996 16,607,994 0 326,865 LNTA 17.388 23.849 0 0.955 16.833 24.152 0 0.912 PROFIT -0.008 0.992 -1.99 0.124 0.009 1.003 -1.88 0.068 EXPRATE 0.004 0.030 0 0.004 0.003 0.032 0 0.003 LNRE 4.876 27.132 0 6.733 5.602 20.673 0 6.825 DEBT 0.685 1.999 0 0.279 0.618 2.000 0 0.331 ETR 8.902 25.000 0 11.511 14.647 25.000 0 11.468 DONATE 0.0002 0.264 0 0.002 0.0002 0.171 0 0.002 LNINC 8.456 18.399 0 6.526 11.439 18.052 0 5.242 AUDIT 57.055 100.000 0 28.557 45.052 100.000 0 27.924 QUICK 9.335 92,759 0 523.29 61.638 494,243 0 3,290.1 CPI 1.357 3.080 0.17 1.187 1.310 3.080 0.17 1.179 ORG 0.536 1.000 0 0.499 0.382 1.000 0 0.486 WITHHOLD 0.519 1.000 0 0.500 0.737 1.000 0 0.440 CREDIT 0.081 1.000 0 0.272 0.080 1.000 0 0.272 DISTRICT1 0.448 1.000 0 0.497 0.228 1.000 0 0.420 DISTRICT2 0.028 1.000 0 0.165 0.069 1.000 0 0.253 DISTRICT3 0.309 1.000 0 0.462 0.301 1.000 0 0.459 DISTRICT4 0.158 1.000 0 0.365 0.217 1.000 0 0.412 DISTRICT5 0.057 1.000 0 0.232 0.185 1.000 0 0.389 IND1 0.334 1.000 0 0.472 0.362 1.000 0 0.481 IND2 0.004 1.000 0 0.062 0.012 1.000 0 0.109 IND3 0.093 1.000 0 0.290 0.104 1.000 0 0.305 IND4 0.452 1.000 0 0.498 0.457 1.000 0 0.498 IND5 0.020 1.000 0 0.141 0.033 1.000 0 0.178 IND6 0.049 1.000 0 0.215 0.010 1.000 0 0.099 IND7 0.048 1.000 0 0.215 0.022 1.000 0 0.146
Table 5: Tests of the Difference between the Pre- and Post-Implementation Means Panel A: Test of the difference between the two means of URTL
CPA attested tax returns mode Non-CPA attested returns mode
X
post 35,650X
pre
52,446X
post
125,741X
pre
132,689H0:
post
pre H0:
post
pre test statistic p-value test statistic p-valuet-test -9.07 <0.0001 -2.83 0.0046
Kruskal-Wallis test 586.16 <0.0001 19.05 <0.0001
Panel B: Test of the difference between the two means of ETR
CPA attested tax returns mode Non-CPA attested returns mode
X
post 11.342X
pre
7.347X
post
17.708X
pre
12.710H0:
post
pre H0:
post
pre test statistic p-value test statistic p-valuet-test 40.82 <0.0001 59.44 <0.0001
Kruskal-Wallis test 1,132.88 <0.0001 58.66 <0.0001
Determinants of Selecting Tax Filing Modes
Table 6 presents the coefficient estimates for the probit choice model of tax filing modes for the pre-implementation period, while Table 7 presents the results for the post-implementation period. As the two tables demonstrate, our tax filing choice model is significant at the 0.01 level, both pre-and post-implementation. It also has good prediction accuracy, with 70.04% and 72.06% of all returns are correctly classified for pre- and post-implementation periods, respectively.
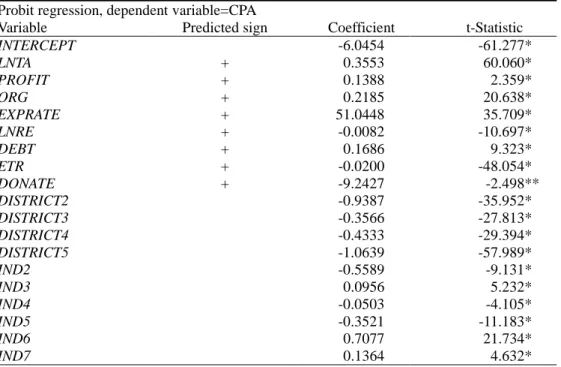
Consistent with Huang (1999) and Lin (2002), from Table 6 and Table 7, we find that firms with larger size (LNTA), higher profit rate (PROFIT), higher entertainment expenses ratio (EXPRATE), higher debt ratio (DEBT) and legal form of limited-by-shares corporation (ORG) are more likely to use CPA attested tax returns. Thus, it would be incorrect to assume that the sample firms in both tax filing modes are randomly selected from a homogeneous population. This suggests the endogenous switching regression (ESR) model may be necessary for our analysis.
One surprising finding is that the effective tax rate (ETR) is negatively associated with CPA attested tax returns. A possible explanation is that the effective tax rate is influenced by CPA’s effective tax planning service (Erard 1997). Also, in contrast with our prediction, retained earnings (LNRE) and donation rate (DONATE) are significantly negatively associated with using CPA attested tax return. We conjecture that retained earnings and donation rates are not good proxy variables for the complexities of tax returns.
Table 6: Estimates for the Probit Choice Model of Tax Filing Modes (Pre-Implementation period, 1996-1997)
Probit regression, dependent variable=CPA
Variable Predicted sign Coefficient t-Statistic
INTERCEPT -6.0454 -61.277* LNTA + 0.3553 60.060* PROFIT + 0.1388 2.359* ORG + 0.2185 20.638* EXPRATE + 51.0448 35.709* LNRE + -0.0082 -10.697* DEBT + 0.1686 9.323* ETR + -0.0200 -48.054* DONATE + -9.2427 -2.498** DISTRICT2 -0.9387 -35.952* DISTRICT3 -0.3566 -27.813* DISTRICT4 -0.4333 -29.394* DISTRICT5 -1.0639 -57.989* IND2 -0.5589 -9.131* IND3 0.0956 5.232* IND4 -0.0503 -4.105* IND5 -0.3521 -11.183* IND6 0.7077 21.734* IND7 0.1364 4.632* Log-likelihood = -45,845.62, n=80,361 Restricted Log-L. = -54,906.72
2 = 18,122.21 df = 18, p<0.01Returns correctly classified as CPA attested returns: 20,261 (n= 34,537) Returns correctly classified as non-CPA attested tax returns: 36,027 (n=45,824) The overall classification accuracy is 70.04%
Notes: * Significant at the 1 percent level, ** Significant at the 5 percent level.
The Effect of Tax Filing Modes on Tax Noncompliance
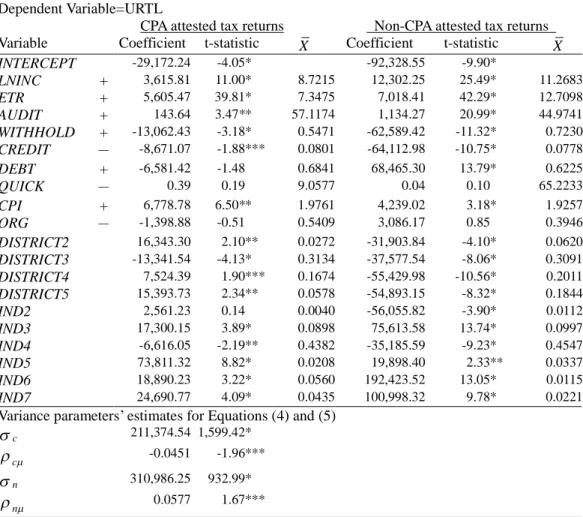
Table 8 and Table 9 report the estimates of the endogenous switching regression models for the pre- and post-implementation periods. The estimates have been derived using
ciand
niin Equations (4) and (5) as the self-selection bias adjustment variables.From Table 8 and Table 9, we find that the coefficients of the selection-adjustment variables (
ciand
ni),
c
cand
n
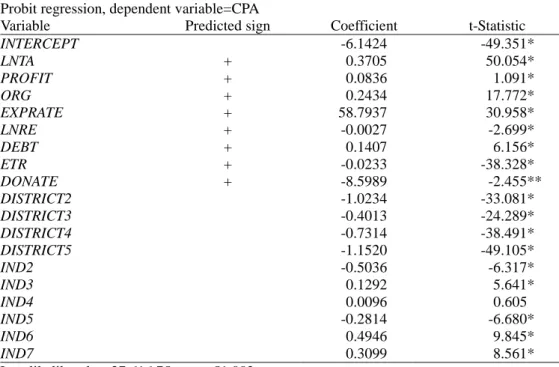
n, are significant for both two modes. This result further proves that firms selecting different filing modes possess different characteristics. Therefore, correcting for the self-selection bias is necessary during the estimation of the tax noncompliance models.Table 7: Estimates for the Probit Choice Model of Tax Filing Modes (Post-Implementation period, 1999-2000)
Probit regression, dependent variable=CPA
Variable Predicted sign Coefficient t-Statistic
INTERCEPT -6.1424 -49.351* LNTA + 0.3705 50.054* PROFIT + 0.0836 1.091* ORG + 0.2434 17.772* EXPRATE + 58.7937 30.958* LNRE + -0.0027 -2.699* DEBT + 0.1407 6.156* ETR + -0.0233 -38.328* DONATE + -8.5989 -2.455** DISTRICT2 -1.0234 -33.081* DISTRICT3 -0.4013 -24.289* DISTRICT4 -0.7314 -38.491* DISTRICT5 -1.1520 -49.105* IND2 -0.5036 -6.317* IND3 0.1292 5.641* IND4 0.0096 0.605 IND5 -0.2814 -6.680* IND6 0.4946 9.845* IND7 0.3099 8.561* Log-likelihood = -27,616.75, n = 51,002 Restricted Log-L. = -34,870.00
2 = 14,506.50 df = 18, p<0.01Returns correctly classified as CPA attested returns: 13,818 (n= 22,001) Returns correctly classified as non-CPA attested tax returns: 22,935 (n=29,001) The overall classification accuracy is 72.06%
Notes: * Significant at the 1 percent level, ** Significant at the 5 percent level.
The major interest of this study is to determine the effects on noncompliance of tax return filing modes and implementation of the integrated tax system. To conduct the analysis, we use the resultant models to estimate the under-reported tax liabilities (URTL) for both tax filing modes before and after the integrated income tax system. Table 10 presents the estimated values and their comparisons.12 The ESR model predicts that the average CPA attested tax return evades about NT$52,795 and NT$44,718 for pre- and post-implementation periods, respectively. However, it would have evaded about NT$130,454 and NT$127,817 respectively if it had been filed as a non-CPA attested tax return. In other words, tax evasion would have increased by about 147% and 186% pre-and post-implementation if the average CPA attested return had been filed as non-CPA-attested. Similarly, the predicted amounts of tax evasion committed by the
12
Though the comparisons can be calculated for any pertinent value of the regressors, this paper conducts the comparisons using the means of the regressors (XcandXn). Note that we don’t need to include any selectivity terms in the procedures to estimate the predicted values of URTL (Maddala 1991, 801).
average non-CPA attested tax return are about NT$149,436 and NT$138,340 pre- and post-implementation, respectively. However, it would have evaded only about NT$90,825 and NT$76,700 if it had been filed as a CPA attested return. In other words, tax evasion would have decreased by about 39.2% and 44.6% pre- and post-implementation respectively. This suggests that CPA attested tax returns, on average, are more compliant than non-CPA attested tax returns for both the pre- and post-implementation periods.
Table 8: Estimates for the Tax Noncompliance Models (Pre-Implementation, 1996-1997)
Dependent Variable=URTL
CPA attested tax returns Non-CPA attested tax returns
Variable Coefficient t-statistic X Coefficient t-statistic X
INTERCEPT -29,172.24 -4.05* -92,328.55 -9.90* LNINC + 3,615.81 11.00* 8.7215 12,302.25 25.49* 11.2683 ETR + 5,605.47 39.81* 7.3475 7,018.41 42.29* 12.7098 AUDIT + 143.64 3.47** 57.1174 1,134.27 20.99* 44.9741 WITHHOLD + -13,062.43 -3.18* 0.5471 -62,589.42 -11.32* 0.7230 CREDIT - -8,671.07 -1.88*** 0.0801 -64,112.98 -10.75* 0.0778 DEBT + -6,581.42 -1.48 0.6841 68,465.30 13.79* 0.6225 QUICK - 0.39 0.19 9.0577 0.04 0.10 65.2233 CPI + 6,778.78 6.50** 1.9761 4,239.02 3.18* 1.9257 ORG - -1,398.88 -0.51 0.5409 3,086.17 0.85 0.3946 DISTRICT2 16,343.30 2.10** 0.0272 -31,903.84 -4.10* 0.0620 DISTRICT3 -13,341.54 -4.13* 0.3134 -37,577.54 -8.06* 0.3091 DISTRICT4 7,524.39 1.90*** 0.1674 -55,429.98 -10.56* 0.2011 DISTRICT5 15,393.73 2.34** 0.0578 -54,893.15 -8.32* 0.1844 IND2 2,561.23 0.14 0.0040 -56,055.82 -3.90* 0.0112 IND3 17,300.15 3.89* 0.0898 75,613.58 13.74* 0.0997 IND4 -6,616.05 -2.19** 0.4382 -35,185.59 -9.23* 0.4547 IND5 73,811.32 8.82* 0.0208 19,898.40 2.33** 0.0337 IND6 18,890.23 3.22* 0.0560 192,423.52 13.05* 0.0115 IND7 24,690.77 4.09* 0.0435 100,998.32 9.78* 0.0221
Variance parameters’estimates for Equations (4) and (5) c 211,374.54 1,599.42* c -0.0451 -1.96*** n 310,986.25 932.99* n 0.0577 1.67***
Notes: * Significant at the 1 percent level, ** Significant at the 5 percent level, *** Significant at the 10 percent level.
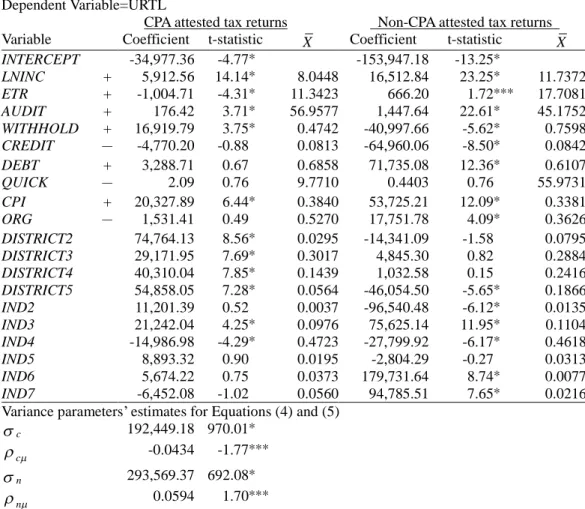
Table 9: Estimates for the Tax Noncompliance Models (Post-Implementation, 1999-2000)
Dependent Variable=URTL
CPA attested tax returns Non-CPA attested tax returns
Variable Coefficient t-statistic X Coefficient t-statistic X
INTERCEPT -34,977.36 -4.77* -153,947.18 -13.25* LNINC + 5,912.56 14.14* 8.0448 16,512.84 23.25* 11.7372 ETR + -1,004.71 -4.31* 11.3423 666.20 1.72*** 17.7081 AUDIT + 176.42 3.71* 56.9577 1,447.64 22.61* 45.1752 WITHHOLD + 16,919.79 3.75* 0.4742 -40,997.66 -5.62* 0.7598 CREDIT - -4,770.20 -0.88 0.0813 -64,960.06 -8.50* 0.0842 DEBT + 3,288.71 0.67 0.6858 71,735.08 12.36* 0.6107 QUICK - 2.09 0.76 9.7710 0.4403 0.76 55.9731 CPI + 20,327.89 6.44* 0.3840 53,725.21 12.09* 0.3381 ORG - 1,531.41 0.49 0.5270 17,751.78 4.09* 0.3626 DISTRICT2 74,764.13 8.56* 0.0295 -14,341.09 -1.58 0.0795 DISTRICT3 29,171.95 7.69* 0.3017 4,845.30 0.82 0.2884 DISTRICT4 40,310.04 7.85* 0.1439 1,032.58 0.15 0.2416 DISTRICT5 54,858.05 7.28* 0.0564 -46,054.50 -5.65* 0.1866 IND2 11,201.39 0.52 0.0037 -96,540.48 -6.12* 0.0135 IND3 21,242.04 4.25* 0.0976 75,625.14 11.95* 0.1104 IND4 -14,986.98 -4.29* 0.4723 -27,799.92 -6.17* 0.4618 IND5 8,893.32 0.90 0.0195 -2,804.29 -0.27 0.0313 IND6 5,674.22 0.75 0.0373 179,731.64 8.74* 0.0077 IND7 -6,452.08 -1.02 0.0560 94,785.51 7.65* 0.0216
Variance parameters’estimates for Equations (4) and (5) c 192,449.18 970.01* c -0.0434 -1.77*** n 293,569.37 692.08* n 0.0594 1.70***
Notes: * Significant at the 1 percent level, ** Significant at the 5 percent level, *** Significant at the 10 percent level.
The Effect of the Implementation of the Integrated Tax System on Tax
Noncompliance
Table 11 shows that, on average, CPA attested tax returns and non-CPA attested tax returns evade about NT$44,718 and NT$138,340 after the income tax integration, respectively. However, they would have evaded about NT$62,637 and NT$177,616 if they had been filed in the pre-implementation respectively. The percentages of noncompliance increase (40.07% and 28.39%) are substantial. Therefore, we can conclude that, on average, tax noncompliance has decreased substantially for both tax filing modes after the income tax integration.
Table 10: Comparisons of Noncompliance between CPA Attested and Non-CPA Attested Tax Returns
Note: The subscripts ‘0’and ‘1’represent pre- and post-implementation, and ‘c’and ‘n’represent CPA attested and non-CPA attested tax returns, respectively.
The Effect of Firms’Characteristics on Tax Noncompliance
Turning to the comparisons of the ESR estimated coefficients between both tax filing modes before and after the income tax integration, we find that the coefficients of the regressors are substantially different between the two filing modes in both Table 8 and Table 9. Therefore, our results provide broad support that the tax filing mode choice affects taxpayer’s tax noncompliance.13
For the pre-implementation period (1996-1997), from Table 8, we find that firm’s income level (LNINC) has a significant positive effect on tax noncompliance in both tax filing modes. This positive relationship confirms our proposition that firms with higher income tend to commit more noncompliance. The coefficients of both ETR and AUDIT are also significantly positive for both filing modes. This indicates that the higher the effective tax rates, the more inclination to underreport tax liability. It also supports that a
13
This indicates the ESR model that allows for full interactions between the regressors and the tax filing modes is a better specification than a model that just uses a dummy variable to account for the effect of tax filing mode. See Greene (2000, 933-934) for a discussion.
Panel A: pre-implementation of the integrated income tax system
CPA attested tax returns Non-CPA attested tax returns
X c c 0 0 ˆ ˆ0nX0c Difference ˆ0nX0n ˆ0cX0n Difference pre-implementation 52,795 130,454 77,659 (↑147%) 149,436 90,825 -58,611 (↓39.2%)
Panel B: post-implementation of the integrated income tax system
CPA attested tax returns Non-CPA attested tax returns
X c c 1 1 ˆ ˆ1nX1c Difference ˆ1nX1n ˆ1cX1n Difference post-implementation 44,718 127,817 83,099 (↑186%) 138,340 76,700 -61,640 (↓44.6%) ˆ jc jcX
j=0,1 : The estimated value of under-reported tax liabilities (URTL) for the average CPA attested tax return, where ˆ
jc
is the vector of the estimated coefficients of the tax noncompliance equation for CPA attested tax returns sample of period j, i.e., Equation (4).
ˆ
jc jnX
j=0,1 : The estimated value of URTL would have been if the average CPA attested tax return had been filed as a non-CPA attested tax return, where is the vector of the estimatedˆjn coefficients of the tax noncompliance equation for non-CPA attested tax returns sample of period j, i.e., Equation (5).
ˆ
jn jnX
j=0,1 : The estimated value of URTL for the average non-CPA attested tax return. ˆ jn
jcX
j=0,1 : The estimated value of URTL would have been if the average non-CPA attested tax return had been filed as a CPA attested tax return.
firm with a higher rank of size in each tax office-in-charge has a higher probability of being selected for audit, and the tax office will scrutinize its tax return more closely to uncover more noncompliance.
Table11: Comparisons of the Average Post-Implementation Noncompliance and the Pre-Implementation Would-be Noncompliance
CPA attested tax returns Non-CPA attested returns Xpost post ˆ 44,718 138,340 Xpost pre ˆ 62,637 177,616 Difference 17,919 (↑40.07%) 39,276 (↑28.39%) Xpost post
ˆ = The estimated value of under-reported tax liabilities (URTL) for the average tax return after the implementation of the integrated income tax system, whereˆpostis the vector of the estimated coefficients of the tax noncompliance equation for post-implementation subsample.
Xpost pre
ˆ = The estimated value of URTL would have been if the post-implementation average tax return had been filed in the period of pre-implementation of the integrated income tax system, where ˆ
preis the vector of the estimated coefficients of the tax noncompliance equation for pre-implementation subsample.
Somewhat surprisingly, the coefficients of WITHHOLD are significantly negative for both filing modes. This result is contrary to the evidence documented by Chang and Schultz (1990) in the case of U.S. individual income taxes. Therefore, the prospect theory (Kahneman and Tversky 1979) does not apply to the withholding status of Taiwan’s business income tax. Consistent with Chan and Mo (2000), we find the coefficients of CREDIT for both filing modes are significantly negative. This implies that firms with tax credits are more compliant than others.
With respect to the effect of firm’s financial positions, for the non-CPA attested tax returns, the coefficient of DEBT (debt ratio) is significantly positive, which is consistent with our prediction. However, for the CPA attested tax returns, the coefficient of DEBT is negative but insignificant. For both filing modes, the coefficients of QUICK (quick ratio) are positive but insignificant. Therefore, there is insufficient evidence to support that firms with higher liquidity have a lower propensity to evade tax. Moreover, since CPI is found to be positively related to tax evasion for both filing modes, we conclude that firms facing inflation may underreport their tax to increase disposable income.
The coefficients of ORG are insignificant; therefore, we do not have sufficient evidence to support that limited-by-shares corporations are more refrained from committing noncompliance. Finally, the coefficients of the two sets of control variables,
DISTRICTiand INDi, indicate that tax evasion varies among different tax jurisdictions and
industries.
Table 9 presents the estimated results for the post-implementation period. Similar to Table 8, Table 9 also shows that LNINC, AUDIT and CPI have significant positive effects
on tax noncompliance for both tax filing modes. In addition, the effects of firm’s financial positions (i.e. DEBT and QUICK) are similar to the results of the pre-implementation period. That is, only DEBT for the non-CPA attested tax returns has significant positive association with tax noncompliance.
However, some of the estimated coefficients in Table 9 are different from those in Table 8. First, we find that the coefficient of the effective tax rate (ETR) is significantly negative for CPA attested tax returns mode. This result indicates that the influence of ETR on noncompliance has reversed after the implementation of the integrated income tax system.
In addition, the coefficient of WITHHOLD is significantly positive only for CPA attested tax returns. Therefore, the prospect theory can apply to the reporting of Taiwan’s CPA attested tax returns in post-implementation period only. With respective to CREDIT, only the coefficient of CREDIT of the non-CPA attested tax returns is significantly negative. That is, after the implementation of the integrated income tax system, we only have evidence to support that, in the non-CPA attested tax returns mode, firms with tax credits are more compliant than others.
In summary, for many of the explanatory variables, the signs and the magnitudes of the estimated coefficients are different between tax filing modes and between the pre- and post-implementation periods. This highlights the importance of controlling for tax filing mode in tax noncompliance studies and shows that the implementation of the integrated income tax system has changed firms’tax evasion behavior.
VI. CONCLUSIONS
In this study, we have applied an endogenous switching regression model to analyze the effect of CPA tax attestation on Taiwan’s business income tax noncompliance, and to investigate whether tax noncompliance behavior has changed after the implementation of the integrated income tax system. The results show that CPA’s tax attestation service results in lower tax evasion both before and after the implementation of the integrated income tax system. In addition, we find that firms’tax noncompliance has decreased after Taiwan adopted the integrated income tax system. Moreover, the estimation of the endogenous switching regression model provides evidence that self-selection bias indeed exists in firms’choice of tax return filing modes. Therefore, it is necessary to correct for this self-selection bias to obtain consistent and efficient estimates.
Since CPA’s tax attestation service is found to result in lower tax evasion, this study justifies the current government policy of offering tax incentives to those companies opting for CPA attested tax returns. On the other hand, the results also imply that tax authorities can uncover more tax noncompliance if they transfer some of the audit effort from CPA attested tax returns to non-CPA attested tax returns.
How companies will react to implementation of the integrated income tax system is undoubtedly a major concern for countries that plan to adopt such a system. Therefore, our empirical evidence in Taiwan may help the policymakers of these countries understand various factors associated with tax noncompliance, and help their tax authorities plan more effective and efficient tax audits.
Corroborating with some important findings by prior foreign studies, we also find that several firms’characteristics, such as their tax rates, tax credit status, and income
levels, are significantly related to business income tax evasion in Taiwan. The revealed fact that firms with tax credits are more compliant than others affirms the effectiveness of various tax credits granted by the Taiwan government. Furthermore, while some economists argue that inflation is a non-legislated tax increase that can generate more government tax revenues, the positive relationship between tax evasion and inflation rate implies that the net effect of inflation on tax revenues increase is not as significant as generally believed.
(Submitted Feb 2005; Accepted Apr 2005)
REFERENCES
Allingham, M. G., and A. Sandmo. 1972. Income tax evasion: a theoretical analysis.
Journal of Public Economics 1, 323-338.
Alm, J., R. Bahl, and M. N. Murray. 1993. Audit selection and income tax underreporting in the tax compliance game. Journal of Development Economics 42, 1-33.
Barnow, B. S., G. S. Chain, and A. S. Goldberger. 1981. Issues in the analysis of selectivity bias. Evaluation Studies Review Annual 5, 43-59.
Beck, P. J., and W. Jung. 1989. Taxpayers’reporting decisions and auditing under information asymmetry. Accounting Review 64, 468-487.
Bradley, C. F. 1994. An empirical investigation of factors affecting corporate tax compliance behavior. Ph. D. dissertation, University of Alabama.
Chan, K. H., and P. L. Mo. 2000. Tax holidays and tax noncompliance: an empirical study of corporate tax audits in China’s developing economy. The Accounting Review 75, 469-484.
Chang, O. H., and J. J. Schultz. 1990. The income tax withholding phenomenon: evidence from TCMP data. The Journal of the American Taxation Association 12, 88-93.
Chen, L. W. 1987. Imputation of the tax evasion of business income tax from Taiwan’s underground economic activities. Masters thesis, Graduate Institute of Public Finance, National Chengchi University. (in Chinese)
Chen, M. C., S. Lin, and W. Lin. 2002. The fairness of prescribed limits on entertainment expense in the Taiwan Income Tax Law. The International Journal of Accounting
Studies 35, 31-59. (in Chinese)
Christian, C. W., S. Gupta, and S. Lin. 1993. Determinants of tax preparer usage: evidence from panel data. National Tax Journal 46, 487-503.
Chu, C. Y. 1988. Causes and indicators of business income tax evasion in Taiwan: an application of the MIMIC model. Taiwan Economic Review 16, 481-489. (in Chinese)
Clotfelter, C. T. 1983. Tax evasion and tax rates: an analysis of individual returns. Review
of Economics and Statistics 65, 363-373.
Crane, S.E., and F. Nourzad. 1986. Inflation and tax evasion: an empirical analysis. The
Review of Economics and Statistics 68, 217-223.
Dubin, J. A., M. J. Graetz, M. A. Udell, and L. L. Wilde. 1992. The demand for tax return preparation services. The Review of Economics and Statistics 74, 75-82.