國 立 交 通 大 學
機 械 工 程 學 系
碩 士 論 文
Preliminary Study of Gliding Arc Plasma Assisted Catalytic Ethanol
Steam Reforming
利用滑動電弧電漿輔助觸媒將含乙醇水氣重組之初步研究
研究生:徐暐能
指導教授:吳宗信 博士
利用滑動電弧電漿輔助觸媒將含乙醇水氣重組之初步研究
Preliminary Study of Gliding Arc Plasma Assisted Catalytic Ethanol
Steam Reforming
研 究 生:徐暐能
Student:Wei-Neng Hsu
指導教授:吳宗信 博士
Advisor:Dr. Jong-Shinn Wu
國 立 交 通 大 學
機 械 工 程 學 系
碩 士 論 文
A Thesis
Submitted to Department of Mechanical Engineering
College of Engineering
National Chiao Tung University
in Partial Fulfillment of the Requirements
for the degree of
Master in
Mechanical Engineering
July 2011
Hsinchu, Taiwan
I
利用滑動電弧電漿輔助觸媒將含乙醇水氣重組之初步研究
學生: 徐暐能 指導教授: 吳宗信 博士
國立交通大學機械工程學系
摘要
本實驗係探討利用大氣電漿輔助觸媒經過自熱反應的方式重組原料並進行產生氫 氣之研究。利用脈衝電漿產生滑動電弧電漿,電漿氣體為空氣、水和乙醇的混合,並 操作在一大氣壓的條件下產生電漿。期望以電漿氣體高能量的特性,幫助前處理重組 燃料,以提高利用觸媒產生氫氣的效率。本實驗首先分開探討觸媒產氫與滑動電弧產 氫。在觸媒產氫的實驗之中,透過交通大學應用化學研究所李積琛老師及其學生協助 觸媒(5 wt% Rh/CeO2)的製備,並著手探討實驗參數對效率之影響。藉由調整實驗參數 達到效果最佳化,其中在低空氣流量 1.0 SLM、0.7 碳氧原子比、反應氣體溫度 160 ℃ 之條件下,最佳化的氫氣選擇比 115.03%,一氧化碳選擇比 66.02%,轉換率 100%而 效率為 63%,另外,在滑動電弧電漿產氫研究中,藉由調整空氣流量、碳氧原子比和 輸入功率,來達到產氫效率最佳化。滑動電弧產氫的最佳效率及其參數如下:在較高 空氣流量 1.5 SLM、0.7 碳氧原子比、反應氣體溫度 160 ℃和 223 瓦功率輸入之下可 達到氫氣選擇比 42.50%,一氧化碳選擇比 68.79%,轉換率 39%而效率為 8%。 最後結合電漿輔助觸媒(5 wt% Rh/CeO2)產氫,在高流量下電漿可確實提升產氫效II 果(在空氣流量 1.5 SLM、0.7 碳氧原子比、反應氣體溫度 160 ℃之條件下,之下,觸 媒產氫的效果降低許多: 氫氣選擇比 78.65%,一氧化碳選擇比 61.27%,轉換率 97% 而效率為 48%),電漿輔助觸媒在 1.5 SLM 空氣流量、0.7 碳氧原子比、反應氣體溫度 160 ℃、223 瓦的功率輸出之下可達到 111.20%氫氣選擇比、65.52%一氧化碳選擇比、 100%轉換率,效率為 58%。由以上實驗研究可知,大氣滑動電弧電漿輔助觸媒產氫相 當有潛力。
III
Preliminary Study of Gliding Arc Plasma Assisted Catalytic Ethanol
Steam Reforming
Student:Wei-Neng Hsu
Advisor:Dr. Jong-Shinn Wu
Department of Mechanical Engineering
National Chiao Tung University
Abstract
In this study, the gliding arc non-thermal plasma would assist catalyst reforming
ethanol into hydrogen through auto-thermal reaction. The plasma discharge gas containing
high energy state ions and metastable species which may break the fuel into smaller gas
molecular to assist catalyst reforming. At first, catalyst reforming and gliding arc plasma
have been separately studied. On one hand, 5 wt% Rh/CeO2 catalyst reforming has
optimized 115.03 % hydrogen selectivity, 66.02 % carbon monoxide selectivity, 100 %
conversion rate and 63 % efficiency under 1.0 SLM air flow rate, C/O ratio 0.7 and gas
temperature 160 ℃. On the other hand, the optimized plasma-alone reforming results were
42.50 % hydrogen selectivity, 68.79 % carbon monoxide selectivity, 39 % conversion rate
and 8 % reforming efficiency under 1.5 SLM air flow rate, C/O ratio 0.7, gas temperature
IV
Finally, the PAC reforming experiments were conducted at 1.5 SLM air flow rate
(Under 1.5 SLM air flow rate, C/O ratio 0.7 and gas temperature 160 ℃, the catalyst
reforming was 78.65 % hydrogen selectivity, 61.27 % carbon monoxide selectivity, 97 %
conversion rate and 48 % efficiency), C/O 0.7, plasma absorption power 223 W and gas
temperature 160 ℃ and reforming results were 111.20 % hydrogen selectivity, 65.52 %
carbon monoxide selectivity, 100 % conversion rate and 58 % efficiency. In summary, the
gliding arc plasma assisted catalyst (5 wt% Rh/CeO2) reforming is regarding as a promising
V
誌謝
在交通大學學習的這兩年過程中,有很多人提供幫忙,不管是實驗上還是生活上。 特別感謝指導教授吳宗信教授,有吳教授的指導在這兩年所遭遇到的困難都有所解 決。另外也感謝交通大學應用化學系的李積琛老師和其學生在化學領域方面的指導, 讓我們在跨領域的題目中有了幫助。 此外實驗室的學長姐、學弟妹也都有在研究過程中提供協助,非常感謝。有了他 們的幫助,才能在歡樂又認真的氣氛中學習、成長。 另外也感謝我大學同學們的同儕,這兩年的生活,大家互相幫助,互相勉勵,一 起為研究與生活相互勉勵。 最後,感謝家人們的照顧,總是在回家的時候讓我有最溫暖的感覺。 暐能 2011/07/28 于新竹VI
Table of Contents
摘要 ... I ABSTRACT ... III 誌謝 ... V TABLE OF CONTENTS ... VI LIST OF TABLES ... VIII LIST OF FIGURES ... IX NOMENCLATURE ... XICHAPTER 1 INTRODUCTION ... 1
1.1BACKGROUND AND MOTIVATION ... 1
1.1.1 Advantages of Hydrogen Energy ... 1
1.1.2 Disadvantages of Traditional Reforming Technologies ... 2
1.1.3 Plasma Assisted Reforming Technologies ... 4
1.1.4 Classification of Plasma Sources ... 5
1.1.5 Comparison between Methane and Ethanol as the Reforming Fuel ... 7
1.1.6 Literature Surveys of Gliding Arc ... 9
1.1.6.1 Plasma Power Input Types ... 9
1.1.6.2 Geometry and Electrode Design Consideration ... 9
1.1.6.3 Experimental Measurements ... 10
1.1.6.4 Conversion Rate and Efficiency ... 11
1.2SPECIFIC OBJECTIVES OF THE THESIS ... 13
CHAPTER 2 RESEARCH METHODS AND PROCEDURES ... 15
2.1EXPERIMENTAL FACILITY AND INSTRUMENTS ... 15
2.1.1 Plasma Reactor ... 15
2.1.2 AC Power Supply ... 15
2.1.3 Fuel Feeding System ... 16
2.1.4 Heating System ... 16
2.1.5 Catalyst Preparation ... 17
2.1.6 Experimental Instrumentations ... 18
VII
2.2.1 Experimental Methods ... 19
2.2.2 Test Conditions ... 20
CHAPTER 3 RESULTS AND DISCUSSION ... 21
3.1CATALYST REFORMING ... 21
3.2PLASMA REFORMING ... 22
3.2.1 Visual Observation of Gliding Arc ... 22
3.2.2Electrical Characterization of Gliding Arc ... 24
3.2.3Plasma Reforming Efficiency ... 25
3.2.3.1 Effect of Gas Flow Rate ... 26
3.2.3.2 Effect of Carbon to Oxygen Ratio ... 27
3.2.3.3 Effect of Residence Time ... 28
3.2.3.4 Effect of Input Plasma Power ... 29
3.3PLASMA ASSISTED CATALYST (PAC)REFORMING ... 30
3.3.1 Comparison between Plasma, Catalyst and PAC Reforming ... 30
CHAPTER 4 CONCLUSION AND FUTURE WORK ... 32
4.1SUMMARY ... 32
4.2RECOMMENDATION OF FUTURE WORK ... 33
VIII
List of Tables
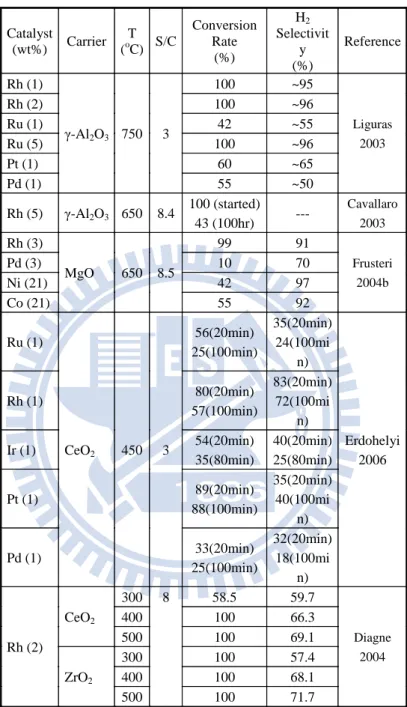
TABLE 1.1 PROPERTIES OF ETHANOL STEAM REFORMING WITH DIFFERENT NOBEL METAL
CATALYSTS. ... 40
TABLE 1.2 PROPERTIES OF ETHANOL STEAM REFORMING WITH DIFFERENT NON-NOBEL METAL CATALYSTS. ... 41
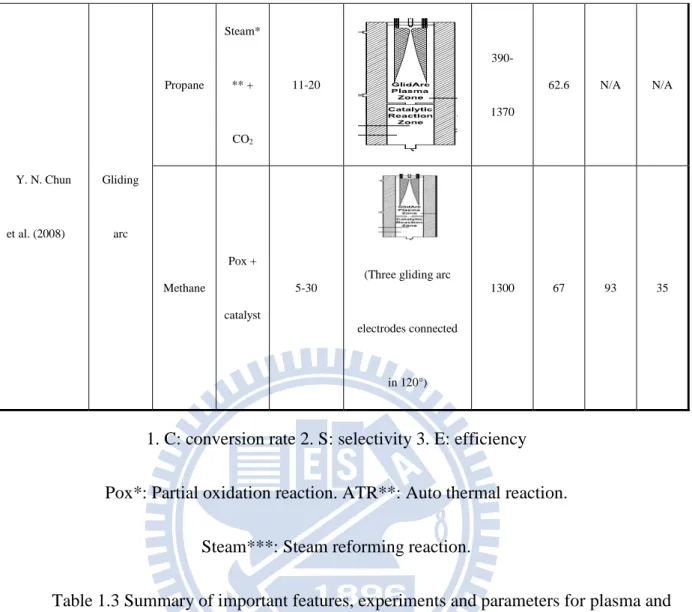
TABLE 1.3 SUMMARY OF IMPORTANT FEATURES, EXPERIMENTS AND PARAMETERS FOR PLASMA AND PAC REFORMING. ... 43
TABLE 1.4 SUMMARY OF PLASMA POWER INPUT TYPE. ... 44
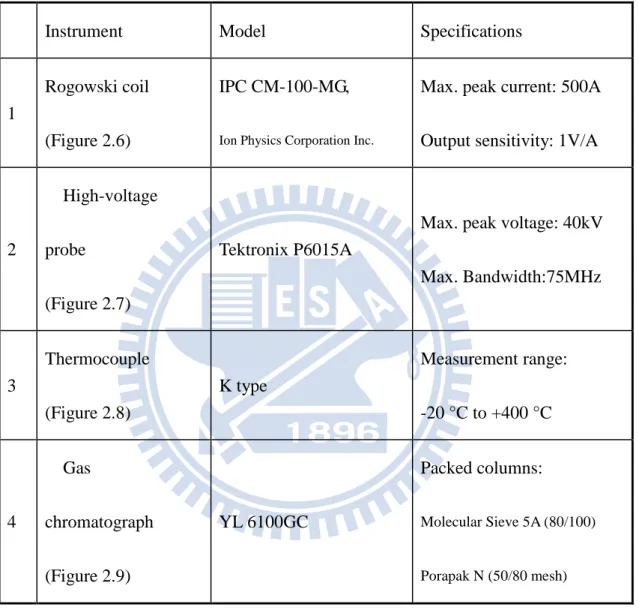
TABLE 2.1 EXPERIMENTAL INSTRUMENTS. ... 45
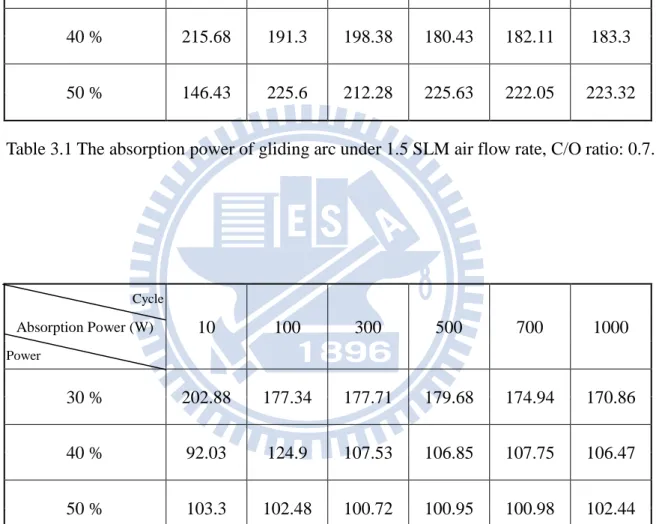
TABLE 3.1 THE ABSORPTION POWER OF GLIDING ARC UNDER 1.5 SLM AIR FLOW RATE, C/O RATIO: 0.7. ... 46
TABLE 3.2 THE ABSORPTION POWER OF GLIDING ARC UNDER AIR FLOW RATE 1.5 SLM. ... 46
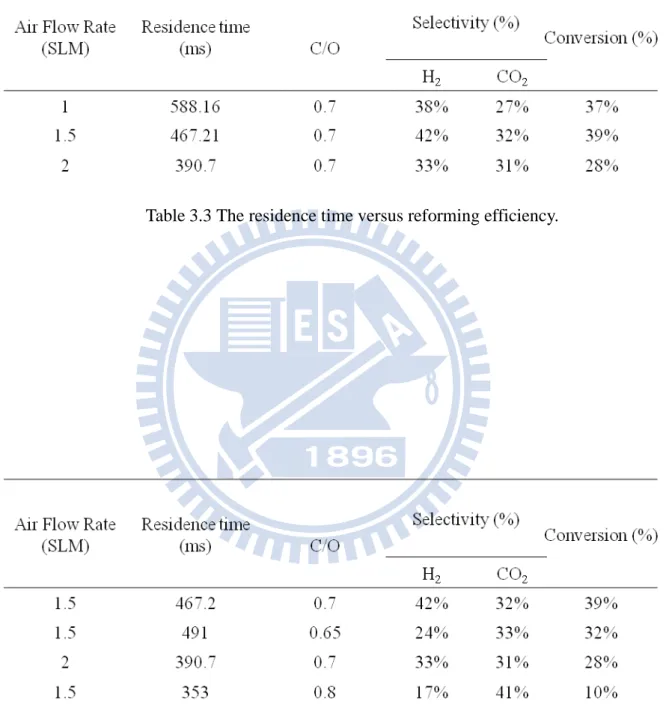
TABLE 3.3 THE RESIDENCE TIME VERSUS REFORMING EFFICIENCY. ... 47
TABLE 3.4 THE C/O RATIO VERSUS REFORMING EFFICIENCY. ... 47
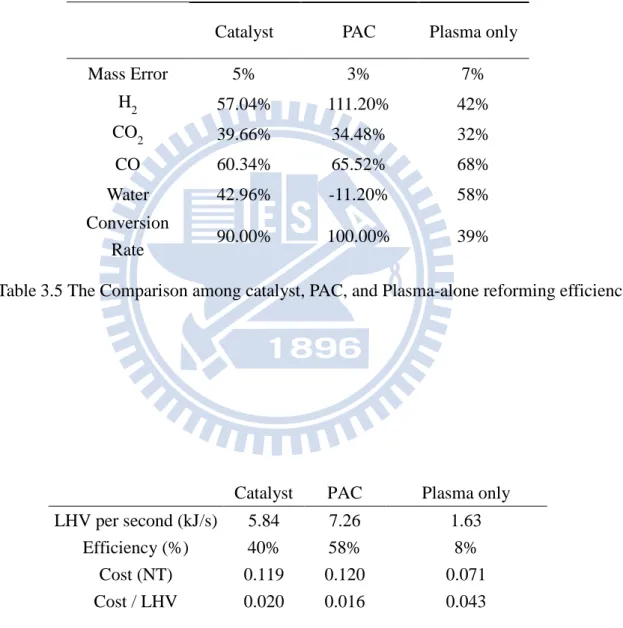
TABLE 3.5 THE COMPARISON AMONG CATALYST, PAC, AND PLASMA-ALONE REFORMING EFFICIENCY. ... 48
IX
List of Figures
FIGURE 1.1 SKETCH OF THE TYPICAL TEST ARRANGEMENT FOR ETHANOL REFORMER (LEFT)
AND THE SOFC (RIGHT) AT CGET OF NCTU. ... 49
FIGURE 1.2 THE BASIC REACTION OF ETHANOL STEAM REFORMING [VIZCAINO ET AL., 2007]. . 49
FIGURE 1.3 THE COMPARISON BETWEEN DIFFERENT PLASMA REACTORS [G. PETIPAS, ET AL., 2007]... 50
FIGURE 1.4 AN ENERGY DIAGRAM INDICATING THE STANDARD ENTHALPY (△H°) AND FREE ENERGY CHANGES (△G°) IN KJ/MOL FOR THE REACTIONS IN A RENEWABLE ENERGY CYCLE OPERATING BETWEEN CO2 AND BIOMASS [L. D. SCHMIDT, ET AL., 2004]. ... 50
FIGURE 1.5 INflUENCE OF ELECTRODE GAP (A) AND VERTICAL DISTANCE BETWEEN ELECTRODE THROAT AND NOZZLE OULET (B) ON N-BUTANE AND TOLUENE DECOMPOSITION RATE [Z. BO ET AL., 2007]... 51
FIGURE 1.6. TYPICAL ARRANGEMENT OF INSTRUMENTATION FOR PAC SYSTEM [Y. C. YANG ET AL., 2009]. ... 51
FIGURE 2.1 THE SELF-DESIGNED GLIDING ARC REACTOR... 52
FIGURE 2.2 THE POWER SUPPLY (PVM500 PLASMA DRIVER). ... 52
FIGURE 2.3 THE FUEL FEEDING NOZZLE. ... 53
FIGURE 2.4 THE MFC AND THE LIQUID PUMP. ... 53
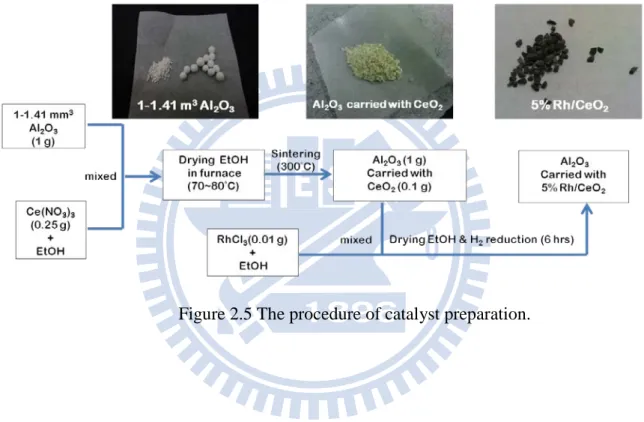
FIGURE 2.5 THE PROCEDURE OF CATALYST PREPARATION. ... 54
FIGURE 2.6 ROGOWSKI COIL. ... 55
FIGURE 2.7 HIGH-VOLTAGE PROBE. ... 55
FIGURE 2.8 THERMOCOUPLE. ... 56
FIGURE 2.9 GAS CHROMATOGRAPH. ... 56
FIGURE 2.10 THE EXPERIMENTAL INSTRUMENTATION OF PAC SYSTEM. ... 57
FIGURE 3.1 THE SELECTIVITY OF HYDROGEN, WATER, CARBON DIOXIDE AND CARBON MONOXIDE OVER FURNACE TEMPERATURE. ... 58
FIGURE 3.2 THE CONVERSION RATE, HYDROGEN AND CARBON DIOXIDE SELECTIVITIES OVER AIR FLOW RATE. ... 58
FIGURE 3.3 SCHEMATIC OF THE ELECTRICSCHEME [A. FRIDMAN ET AL., 2000]. ... 59
FIGURE 3.4 (A) CURRENT-TOTAL POWER OF THE GLIDING ARC; (B) DISCHARGE LENGTH-VOLTAGE OF THE GLIDING ARC IN (A) [A. FRIDMAN ET AL., 2000]. ... 59
FIGURE 3.5 IMAGE OF GLIDING ARC UNDER POWER 30%, AIR FLOW RATE CONSTANT AT 1.5 SLM AND (A) WITHOUT AND (B) WITH THE ETHANOL-WATER SOLUTION AT C/O RATIO 0.7. ... 60
FIGURE 3.6 IMAGE OF GLIDING ARC UNDER POWER 40 %, AIR FLOW RATE CONSTANT AT 1.5 SLM AND (A) WITHOUT AND (B) WITH THE ETHANOL-WATER SOLUTION AT C/O RATIO 0.7. ... 60
X
FIGURE 3.7 IMAGE OF GLIDING ARC UNDER POWER 50 %, AIR FLOW RATE CONSTANT AT 1.5
SLM AND (A) WITHOUT AND (B) WITH THE ETHANOL-WATER SOLUTION AT C/O RATIO 0.7. ... 61
FIGURE 3.8 THE ARC COLUMN MOTION WHEN PLASMA POWER INPUT 50 %, 1.5 SLM AIR FLOW RATE. (1200 FRAMES PER SECOND) ... 61
FIGURE 3.9 THE ARC COLUMN MOTION WHEN PLASMA POWER INPUT 50 %, 1.5 SLM AIR FLOW RATE. (1200 FRAMES PER SECOND) ... 62
FIGURE 3.10 THE ARC COLUMN MOTION WHEN PLASMA POWER INPUT 50 %, 1.5 SLM AIR FLOW RATE. (1200 FRAMES PER SECOND) ... 62
FIGURE 3.11 ELECTRICAL PROPERTIES FOR GLIDING ARC WHEN 30% APPLIED POWER. ... 63
FIGURE 3.12 ELECTRICAL PROPERTIES FOR GLIDING ARC WHEN 40% APPLIED POWER. ... 63
FIGURE 3.13 ELECTRICAL PROPERTIES FOR GLIDING ARC WHEN 50% APPLIED POWER. ... 64
FIGURE 3.14 CONVERSION RATE, SH2 AND SCO2 VERSUS AIR FLOW RATE. ... 65
FIGURE 3.15 SH2, SH2O AND SCH4 VERSUS AIR FLOW RATE. ... 65
FIGURE 3.16 SCO2, SCO AND SCH4 VERSUS AIR FLOW RATE. ... 66
FIGURE 3.17 CONVERSION RATE, SH2 AND SCO2 VERSUS C/O RATIO. ... 66
FIGURE 3.18 SH2, SH2O AND SCH4 VERSUS C/O RATIO. ... 67
FIGURE 3.19 SCO2, SCO AND SCH4 VERSUS C/O RATIO. ... 67
XI
Nomenclature
P Input power V Measuring voltage I Measuring current SH2 Selectivity of hydrogenSCO2 Selectivity of carbon dioxide
SCO Selectivity of carbon monoxide
1
Chapter 1 Introduction
1.1 Background and Motivation1.1.1 Advantages of Hydrogen Energy
Nowadays, environmental pollutions have become a serious problem due to human
activities. Therefore, there is a need to develop alternative clean energy. In many kinds of
alternative clean energy, hydrogen energy processes many advantages. Hydrogen gas (H2)
burns cleanly and produces none of any environmental pollutants [Fields S et al., 2003].
Besides, hydrogen gas can be extracted from many sources, including water or fossil fuels
(hydrocarbons) such as natural gas or coal. Furthermore, H2 is definitely a clean energy
source and possesses the highest energy content per unit of weight (i.e, 120.7 kJ/g), compared
to any of the known fuels. Having these advantages, hydrogen energy has been used for a
variety of applications. These applications include providing fuel as the fuel cell used in
vehicular propulsion, such as refueling stations for hydrogen powered vehicles. In this
context, the hydrogen as a clean fuel appears to be the best future solution for fuel cells and
automotive applications [Fouhy K., et al, 1996; Cohn DR., et al, 1997].
High-temperature solid oxide fuel cell (SOFC) has become a potential alternative to
hydrocarbon fuel based electricity source, especially for decentralized power system, mainly
due to its high thermal efficiency as compared to traditional combustion engines. In addition,
2
comparably lower bonding energy of CO, while it is considered a very poisonous species for
low-temperature proton exchange membrane FC (PEM-FC). Ethanol (heating value of
28.865 kJ/kg) is a green energy which can be produced unlimitedly from corns easily at low
cost. Thus, the Center for Green Energy Technology (CGET) of NCTU has started to develop
an integrated SOFC system using ethanol as the fuel since 2008 (see Figure 1.1 for the typical
test configuration).
1.1.2 Disadvantages of Traditional Reforming Technologies
Hydrogen production from ethanol steam reforming is an endothermic reaction. It
requires much heat to maintain the system temperature for thermal equilibrium. Thus,
traditional method to produce hydrogen needs power to generate heat and needs space to
provide heat generator to process endothermic steam reforming. Moreover, the reaction from
ethanol to reform hydrogen needs catalyst to assist reaction pathways perform. Followed are
introduction to traditional reforming technologies. There are many reaction pathways which
include a number of dehydrogenation and dehydration path [Vizcaino et al., 2007] in process,
as shown in figure 1.2.
On one hand, the traditional method derived acetaldehyde from dehydrogenation of
ethanol such as (2), and then methane and carbon monoxide would be produced through
decarbonylation (3). Finally, it produced hydrogen and carbon monoxide from methane steam
3
CH3CH2OH ↔ CH3CHO + H2 (2)
CH3CHO ↔ CH4 + CO (3)
CH4 + H2O ↔ CO + 3H2 (4)
On the other hand, ethylene would be produced from ethanol dehydration reaction (5), followed by dehydrogenation reaction (6) which produce carbon accumulation that deactivate the catalyst. As mentioned above, ethanol steam reforming should avoid it [Vizcaino et al., 2007]. CH3CH2OH ↔ C2H4 +H2O (5)
C2H4↔ 2C + 2H2 (6)
C2H4 + H2O ↔ CO + 4H2 (7)
CO + H2O ↔ CO2 + H2 (8)
In order to increase the yield of hydrogen, water gas shift, (8), reaction should also
involve in total reaction. Thus, the catalyst plays an important role in ethanol steam reforming.
The catalyst can be divided into nobel metal and non-nobel metal described as followed:
1. Nobel metal catalyst
The advantage of noel metal catalyst is highly active, such as Ruthenium (Ru), Rhodium
(Rh), Palladium (Pd) and Platinum (Pt). Table 1.1 shows properties of ethanol steam reforming
with different nobel metal catalysts.
4
Some non-nobel metals can also be used as hydrogen reforming catalyst which include
nickel (Ni), copper (Cu), zinc (Zn) and cobalt (Co). Table 1.2 shows detailed performances of
ethanol steam reforming using different non-nobel metal catalysts. In table 1.2, the results of
nickel assist reforming is the most effective catalyst among the others; the ethanol in the
reforming process break the carbon bond and produce hydrogen easily. Furthermore, nickel is
not only the most effective catalyst but also the easiest and cheapest element to prepare among
the others, which is the most common catalyst for ethanol steam reforming.
Ethanol fuel is first steamed and then flows through a catalytic reformer, which is made of
rare earth metal oxide consisting of Ce. Although tests at the CGET of NCTU and previous
studies in the literature showed very promising hydrogen conversion efficiency (>100%,
excluding the hydrogen coming from water vapor), it suffers some potential disadvantages,
which include: 1) very high cost of the rare earth material, and 2) short durability of the catalyst.
These two factors may eventually prevent the ethanol SOFC system from real applications in
the future. Thus, how to resolve the above two major shortcomings of the catalytic reformer or
find an alternative reformer is among one of the top priorities of the team. In this thesis, we
found an alternative reformer, plasma assisted catalyst reformer, which is discussed later.
1.1.3 Plasma Assisted Reforming Technologies
Plasma is an ionized gas whose energy state is high, also characterized by a high electrical
5
has been gradually attracted attention due to plasma has following characteristics: fast
ignition, the compatibility for a broad range of hydrocarbons, the high energetic density.
However, using plasma only to conduct reforming, the H2 selectivity is generally lower than
that achieved with the traditional catalytic reforming process [B. Pietruzk, et al., 2004].
Recently, a new technology has been developed, plasma-assisted catalyst (PAC), which is
constructed by integrating plasma and thermal catalysis. The PAC can be applied in
hydrocarbon reforming for hydrogen production and gaseous pollutant removal. For the first
application, one review paper has been published [M.B. Chang, et al., 2008]. For the latter
application, two review papers have also been published [H.H. Ki, et al., 2004; J.V. Durme,
et al., 2008].
On the basis of environmental protection, green energy technologies are important.
Overall, using PAC to reform hydrogen can combine the advantages of reforming using
plasma-alone and using catalyst-alone, in other words PAC reforming has such advantages:
rapid startup, fast response time, and fuel flexibility. We expect using PAC could increase
the lifetime of the catalyst, reforming performance and H2 selectivity. 1.1.4 Classification of Plasma Sources
Plasma state is usually classified as the high temperature (or thermal) plasma and the
cold (or non-thermal or non-equilibrium) plasma depending on energy level, temperature
6
equilibrium thus the temperature can reach to 5000-50,000K, causing the reaction in
thermal plasma lacks of chemical reaction selectivity. Those two characters results in very
little control over chemical processes inside plasma. Non-thermal plasmas are
non-equilibrium in gas temperature and electron temperature, low power requirement and
capable to induce physical and chemical reactions within gases at relatively low
temperatures. Combining these characters, non-thermal plasma has been applied for fuel gas
treatment and has been considered very promising for organic synthesis. A review paper
about non-thermal plasma assisted reforming technologies has been published [G. Petipas,
et al., 2007]. In the article, it mentioned various kinds of plasma sources as PAC reforming
technologies, which are listed in the figure 1.3 and it pointed out the most efficiency plasma
sources are gliding arc (GA) and gliding arc in tornado (GAT) by A. Fridman. Plasma
generated by the gliding arc discharge which has thermal and non-thermal properties
depending on the system parameters such as power input and gas flow rate [A. Fridman, et
al., 1999]. Having both thermal and non-thermal properties, gliding arc plasma is possible to
obtain the transition regimes of the discharges. In other words, gliding arc plasma can provide
non-equilibrium plasma but with higher power levels. These kinds of plasma having both
thermal plasma and non-thermal plasma characters are called “intermediate plasma.” On the
basis of high efficiency hydrogen reforming and the advantages of intermediate plasma, we
7
1.1.5 Comparison between Methane and Ethanol as the Reforming Fuel
Nowadays PAC reforming commonly uses methane as reforming fuel because it can be
easily obtained from fossil fuels. However, human-caused global warming is one of the greatest
and the most urgent challenges that human need to deal with it on earth today. The main culprit
is the enormous amount of the potent greenhouse gas carbon dioxide (CO2) released into the
atmosphere by burning fossil fuels. So far, most of methane was made by fossil fuels (over
80%). In other words, using methane to generate hydrogen as clean fuel could still generate
extra carbon dioxide. However, using ethanol instead as methane to generate hydrogen can
achieve carbon-nurture. If ethanol can be produced from plants that can consume the
greenhouse gasses-CO2 to produce by photosynthesis in fermentation, the carbon neutral can be
achieved. When reforming ethanol into hydrogen, carbon dioxide would be released back to the
atmosphere. But the net amount of CO2 in the atmosphere stays the same [Figure 1.4, L. D.
Schmidt, et al., 2004]. Activities that don't disrupt carbon balance in atmosphere are described
as carbon-neutral. So, using ethanol as fuel does not raise the level of CO2 and does not increase
global warming.
Hydrogen is difficult to store and transport. Nevertheless, ethanol can solve these
problems. Therefore, they can be chosen as the hydrogen carrier for storage and
transportation. In comparison of methane and ethanol, the energy storage ability for ethanol is
8
procedure which is much safer and easier to store and transport than methane. On the basis of
the advantages of using ethanol as reforming fuel, we shall emphasize on ethanol reforming.
Nowadays, in the industrial procedure to use ethanol to reform hydrogen is ‘‘steam
reforming’’ which is widely used all over the world, however the main drawback of this
procedure is that it needs an external heat source to support reforming reaction. Furthermore,
there was another hydrogen procedure, partial oxidation, had been developed.
In partial oxidation reaction, ethanol reacting with insufficient oxygen generates a
slightly endothermic reaction to reform ethanol into hydrogen. However, using this method
lowers the performance and brings soot left caused poison of catalyst [A. Fridman et al.,
2004].
For the sake of solving these problems, combine steam reforming, water gas shift
reaction and partial oxidation. Ethanol can be reformed in an ‘‘auto-thermal’’ [J.H. Wang et
al.,2009] process kept both advantages. The chemical reaction showed as followed: Steam Reforming:
C2H5OH(g) + H2O(g) → 2CO + 4H2, ΔH298= 254.7 kJ/mol (9)
Partial Oxidation:
C2H5OH(g) + 1⁄2O2 → 2CO + 3H2, ΔH298 = 12.9 kJ/mol (10)
Water gas shift (WGS)
9
Auto-thermal Reforming:
C2H5OH(g) + 2H2O(g) + 1⁄2O2 → 2CO2 + 5H2, ΔH298 = -69.4 kJ/mol (12)
1.1.6 Literature Surveys of Gliding Arc
Since we are interested in developing a PAC system to reform hydrogen, all the
following literature surveys are restricted along this line. Table 1.3 summarizes several
important features, experiments and parameters in the literature for gliding arc and GAT
reforming hydrogen, in which we are interested. Several discussions later are based on the
contents of this table.
1.1.6.1 Plasma Power Input Types
Form literature surveys, plasma power input could be divided into AC power supply
[Y. Kusano et al., 2008, Z. Bo et al., 2008], DC power supply [A. Fridman et al., 2005], and
pulse power supply [H. Shiki et al., 2008]. Table 1.3 summarizes several power input
parameters for plasma reactor, and more details are presented in Table 1.4. In the plasma
system, gliding arc and GAT, input power could affect plasma characters dramatically,
which could also cause synergistic effects on PAC system to change reforming results.
However, there has been no systematic work in seriously studying the effects of plasma
power to discharge for the same gliding arc and GAT plasma reactor.
10
For gliding arc plasma reactor, the evolution of gliding arc plasma starts at the shortest
distance (usually 2-5 mm) [A. Fridman et al., 2005, Z. Bo et al., 2007] between two diverging
electrodes when applied voltage reaches the breakdown voltage value. Immediately after
breakdown, the spark channel is formed crossing the gap between the blades. Once the spark
channel is formed, gas flow drags the column downstream and the length of the plasma
column increases. Therefore the diverging electrodes and gas flow rate which lead the column
moving might also change plasma character. There has been a research discussed increasing
electrode gap or decreasing vertical distance between electrode throat and nozzle outlet will
increase higher VOCs decomposition rate [Fig. 1.5, Z. Bo et al., 2007]. However for
hydrogen reforming, discussing how different geometry and electrode design change the
process of reforming is still a critical issue to be resolved.
1.1.6.3 Experimental Measurements
In general, there are two types of measurement regarding plasma system. The first type
is about the electrical properties of the discharge, while the other is about the plasma
diagnostics of the discharge. Typical arrangement of the instrumentation is shown in figure
1.6 [Y. C. Yang et al., 2009] for reference. In the measurement of electrical properties part,
the current and voltage (IV) probe were used to measure time-dependent current and
voltage wave forms. This information can then be used to decide the voltage-current curve,
11
the information about the magnitude of the resistive component of the discharge.
In the plasma diagnostics parts, it is generally very difficult to measure the discharge
properties inside the discharged volume. Thus, most measurements were made in the
post-discharge region. They include plasma-parameter measurements using Langmuir-probe
technique [Chaudhary et al., 2003] or gas temperature measurements using a thermocouple
[Babayan et al., 2001; Wang et al., 2003; Li et al., 2006; Zhu et al.,2005], the product gas
components were analysis using gas chromatograph [Y. C. Yang et al., 2009; Y. N. Chun et
al., 2008; M. B. Chang., et al., 2008], and discharge arc column motion using high speed
camera [A. Fridman et al., 2000; Z. Bo et al., 2007 ]. However in our literature survey, there
is no article discussed about OES measurement in hydrogen reforming using gliding arc and
GAT. We shall also conduct measuring species concentration (ions and radicals) by using
optical emission spectrometry (OES) [M. Kraus et al., 2002; C. Alves et al., 2009].
1.1.6.4 Conversion Rate and Efficiency
From the previous part of survey, the experimental parameters and conditions which could
affect PAC system performance have been mentioned. Moreover, in this part of literature
survey some parameters that described the performance of reforming hydrogen have been
summarized. Conversion rate, efficiency, and selectivity are three important factors to
represent the reforming performance. Each of them represents different meanings about
12
The fuel conversion rate means how much percentage of fuel that were injected into the PAC
system have been reformed into other kinds of product; the hydrogen selectivity means how
much percentage of hydrogen were formed among all the formed product that contains H
atoms. (Similarly, CO selectivity and CO2 selectivity represent same idea, if there were other
formed product gases); the reformer thermal efficiency represents the proportion of the lower
heating value (LHV) of formed hydrogen to the input energy, that is the summation of the
electrical energy of the plasma and the LHV of the hydrocarbon injected [G. Petitpas et al.,
2009].
The methods of data analysis are shown as following Equations.
From literature survey, the conversion rate ranges from 62.6% - 87 % [L. Bromberg et
13
2008; G. Petipas et al., 2007]. The thermal efficiency range from 35% - 75.81% [L. Bromberg
et al., 2006; A. Fridman et al., 2002, 2005; Y. N. Chun et al., 2008, 2008; M. B. Chang et al.,
2008; G. Petipas et al., 2007].
In our research, we shall find optimum conditions for producing hydrogen from
ethanol in our PAC system, for advanced we shall focus on discussing how other
parameters influence conversion rate, selectivity, and thermal efficiency.
1.2 Specific Objectives of the Thesis
Motivated by the technical advantages and tremendous advantages of PAC reforming
as compared to the traditional reforming, also based on the understanding of the present
development in this field, the objectives of this thesis are summarized as followed:
The gliding arc reactor was designed based on literature review and its characters were diagnosed, including electrical properties and arc column motion.
The catalyst reforming was studied by adjusting several parameters and the results were compared to the literature. By comparing the efficiency with literature,
making sure that self-designed reforming system is ready to conduct plasma
assisted catalyst reforming.
The plasma reforming and catalyst reforming were conducted in different experimental conditions. In the end of the thesis, the PAC reforming system were
14
also preliminary conducted to reforming hydrogen and comparing with previous
15
Chapter 2 Research Methods and Procedures
2.1 Experimental Facility and InstrumentsIn this section, the introduction of using PAC system to reform hydrogen is proposed.
There are two parts, one is experimental facility including power supply, fuel feeding
system, plasma reactor, catalyst preparation, and heating system. The other part is
experimental instrument including OES, GC, etc.
2.1.1 Plasma Reactor
In this study, all experiments are conducted at air flow rate ranges from 0.5-2 SLM and
to meet for this purpose a small gliding arc reactor was designed. The following figure 2.1
describes the gliding arc reactor dimensions. GA reactor mainly consists of two 30 mm long,
7 mm wide and 2 mm thick knife-shaped electrodes fixed on a Peak bed plate, which can
sustain at heat deflection temperature at 315℃ and long term property evaluations at 250℃.
For latter on using high-speed camera observation of the arc column motion, a quartz tube
with inner diameter 22 mm and 55 mm long is well designed in sealing with Peak bed plate.
2.1.2 AC Power Supply
Gliding arc reactor is supplied with a power supply (PVM500 plasma driver). It has
independent voltage control ranges from zero to maximum 20 kV peak-to-peak. And
frequency ranges from 20-70 kHz. Though, this power supply is relatively unstable compare
16
power magnitude on electrical character and reforming efficiency was studied in detail.
2.1.3 Fuel Feeding System
In this study, the fuel feeding system controls several experimental parameters: C/O
(mole) ratio, air flow rate, and ethanol/water mole ratio. C/O (mole) ratio represents the
proportion of input C atoms in the ethanol and O atoms in the air and the ethanol. Ethanol and
water mole percentage also is an important parameter that would effects the experiment
results dramatically. To control accurate parameters, MFC (Multi-gas
MFC,MC-100SCCM-D, Alicat Scientific, 100sccm for max) and gradient pump (930d-1428,
Young Lin Instrument, 0.0005 to 1 slm) were used to control the flow rate of dry air pumped
from compressor though a dehydration process and ethanol-mixed-water solution. Moreover,
high purity (99%) ethanol that contains few impurity and DI water were used as fuel, and they
were mixed together using ultrasonic wave producer.
As for the fuel feeding system, a controllable nozzle was connected to a stainless steel
tube which inside has special design to step up the gasification effect and also has a
thermocouple to measure the fuel temperature. The automatic valve was controlled by an
adjustable frequency signal at 12 volt voltage and the duty cycle of the frequency was set at
a constant cycle: 10/500 to control the valve on and off.
2.1.4 Heating System
17
be heated in everywhere along the reaction pipeline, started at fuel injection tube to GC
analysis ended. Especially, there are two parts of pipeline need to be heated for specific
temperature control, gasification and catalyst reaction. The heating system consisted of two
heating furnace, each of it is 30 cm long and can control temperature through a thermal
controller. The gasification furnace supplies the heat to heat up the reactant, and the
experiment results indicate the reactant temperature has an optimum setup for reforming
efficiency.
2.1.5 Catalyst Preparation
In this study, 5% Rh/CeO2 was used as reforming catalyst, especially thanks to
Department of Applied Chemistry, NCTU for sharing the chemicals and skills. In the catalyst
preparation, at first, 1 g porous Al2O3 balls used as carrier were pound to small pieces,
1.00-1.41 mm3, mixed with ethanol solution which dissolved 0.125 g Ce(NO3)3 and then
heated to 50℃ to evaporate ethanol. Thereafter, the Al2O3 carrier loaded with Ce(NO3)3 were
sintering in 300℃ for 5 hours, meanwhile 0.01g RhCl3 ethanol solution was prepared to mix
with 10 % Ce-Al2O3 after sintering. Follow the same procedure to evaporate ethanol, the 10
% Ce-Al2O3 loaded with 5% RhCl3 were put into the 600℃ furnace and access 200 sccm
hydrogen gas to proceed reduction reaction within 6 hours to produce 1 g porous Al2O3
18
2.1.6 Experimental Instrumentations
In this section, the experimental facility and instrumentation for the study are listed
below in detail.
The experimental instrumentation includes voltage and current probe for electrical
measurements, thermocouple for temperature measurements, optical emission spectral for
radical concentration measurements and gas chromatograph for gas composition analyses.
The most common electrical diagnostic consists of the measurement of the voltage applied to
the electrodes and the resultant discharge current. It is also common to use a capacitor
connected in series to ground; the voltage across the series capacitor is then proportional to
the charge stored on the electrodes. All the above-mentioned parameters were recorded with a
Rogowski coil (IPC CM-100-MG, Ion Physics Corporation Inc.) and a high-voltage probe
(Tektronix P6015A), respectively, through a digital oscilloscope (Tektronix TDS1012B).
The thermocouple (K type) connected to a thermometer will be used to measure the gas
temperature distribution in the afterglow region. The optical emission spectral intensity of
the GA is measured using a monochromator (PI Acton SP 2500) with a Photomultiplier tube
(Hamamatsu R928). It was used to measure the concentration distribution in the
post-discharge region to characterize the capability of generating radicals by the system. In
addition, hydrogen, carbon monoxide, carbon dioxide and other hydrocarbon were quantified
19
packed column of Molecular Sieve 5A (80/100 mesh) and Porapak N (50/80 mesh) ) by using
the calibration curves separately prepared. The standard gases for calibration were prepared
in bulbs. Moreover, the gas would access through the gas purifier to condense moisture and
remove impurity before analyzing and calibrating.
2.2 Experimental Methods and Test Conditions
Research steps for the PAC reforming are summarized as followed:
2.2.1 Experimental Methods
The self-designed PAC system is show in figure 2.10. The preliminary experimental
methods are separated in two parts, reforming efficiency and gliding arc plasma character
study.
In the reforming efficiency study, ethanol and water were supplied by liquid pump and
dry air from compressor was controlled by MFC. In pre-heat zone, the ethanol and water
were gasified and heated to specific reactant temperature. After that, the reactant flow into
the plasma reactor. And following is the catalyst reactor where 5 wt% Rh/CeO2 catalyst was
kept processing reforming reaction. The catalyst reactor temperature was controlled at
constant temperature 380℃. After reforming, the product gas including moisture and
non-converted ethanol were sampled into GC by a 2 m long heating pipeline. Products were
analyzed by gas chromatography, with mass balances closing to within 10 %. As for the
20
were discussed in the next chapter.
In the gliding arc plasma character study, electrodes were connected to power supply
system which provides the plasma reactor with bipolar voltage pulses to discharge the gas,
air or ethanol-steaming-added air, with different flow rate. Meanwhile, plasma voltage and
current were measured and recorded with oscilloscope; arc column motion was recorded
with high speed camera. The preliminary results were discussed in the next chapter, also.
2.2.2 Test Conditions
In the catalysis ethanol auto-thermal reforming experiment, air was controlled at
0.5-1.5 SLM; input fuel C/O mole ration was fixed at 0.7; ethanol and DI water proportion
was 33.33 mol%; catalyst reactor was maintained at 380℃; Catalyst, 5 wt% Rh/CeO2, was
used. The influence of furnace temperature and air flow rate on selectivity and conversion
rate were studied.
In the gliding arc character research, air was controlled at 1.5 SLM. Two kinds of
discharge gas were applied, air and ethanol-steaming-added air. C/O ratio was constant at
0.7. The different plasma power were applied to observe the electrical character and the
plasma appearance.
In the gliding arc reforming, the influences of air flow rate, C/O ratio and plasma
power input to the reforming results were studied. Later on, the optimize conditions of
21
Chapter 3 Results and Discussion
3.1 Catalyst ReformingIn the catalysis ethanol auto-thermal reforming experiments, the influence of reactant
fuel temperature on selectivity and conversion rate has been done. Selectivities of H2, H2O,
CO and CO2 are plotted as the function of furnace temperature in figure 3-1. The reforming
conditions were fixed at 0.1 SLM, 0.7 C / O ratio, 33.33 % ethanol / water mole ratio and
catalyst was 5 wt% Rh / CeO2 (residence time: 12.9 millisecond). The results show none of
the minor products are produced and all of ethanol was converted into products, therefore
the conversion rate in this experiment was 100%. H2 selectivity peaks at ~117 % at ~270 ℃
furnace temperature. Due to water gas shift reaction, the added water also converted into H2
and CO2; namely, H2 selectivity exceeded 100% and H2O selectivity was negative. However,
the results show that if furnace temperature was heated over 270 ℃, the H2 selectivity
decreased and the CO2 selectivity increased. According to the literature survey [L. D.
Schmidt et al., 2004], the water gas shift reaction (WGS) would not process in the high
temperature, namely, water would not reform into hydrogen causing hydrogen selectivity
decreased. Moreover, in the lack of WGS reaction, the heat that used to release from WGS
reaction would not provide into total reaction causing the steam reforming which is a strong
endothermic reaction would not process. In theory, the CO2 content would increase and H2O
22
Figure 3.2 showed that the reforming efficiency over different air flow rate at C/O ratio
0.7. At 1.0 SLM air flow rate, the SH2 were over 100 %, and the conversion rate was 98 %.
However, when the flow rate increased to 1.5 SLM, the reforming efficiency was poor
compared with low flow rate. Conversion rate and SH2 both decreased dramatically. Later on,
the PAC reforming experiments were focused at 1.5 SLM air flow rate, hoping that the
plasma assisted catalyst reforming could improve the reforming results.
3.2 Plasma Reforming
In the section 3.2, the research was focused on gliding arc reforming. First, the visual
observation and electrical character measurement were brought out. Later, the plasma-alone
reforming was studied through adjusting various parameters.
3.2.1 Visual Observation of Gliding Arc
In section 3.2.1, the physical phenomenon of gliding arc were brought out, including
the basic idea of gliding arc, image of gliding arc using air or reforming fuel added air as
working gas and arc column motion recorded by high speed camera.
The gliding arc electrode is composed as a couple of separated electrodes supplied with a power generator to discharge gas becoming plasma type. The arc starts at the
smallest gap between two electrodes when the electrode field reaches breakdown conditions,
23
needs 9.6 kV to breakdown the gas, air, forming arc. After the arc starts, the arc current
increases very fast, and the voltage of the arc drops. The arc is forced to move to the
downstream along electrodes if the gas flow is strong enough. Once the arc moves, it may
follow the electrodes’ curvature and the arc elongates. In order to sustain the growing arc,
the power dissipation increases till the maximum power that can be transferred to the arc
from the power supply. When the maximum power is transferred, the arc still continuous
growing by the gas flow forced and the energy lost is greater than the power gained. The arc
cools down and finally extinguishes. The next cycle starts immediately after the breakdown
conditions reached. A typical repetition rate of the arc is in the range from 10 to 100 Hz and
changes with the gas flow rate: the higher the flow rate, the higher the frequency [A.
Fridman et al., 2002]. There have been some experiments, which the total power and plasma
voltage were measured as functions of electrical current and plasma length [A. Fridman et
al., 2000]. Figure 3.3 is the experimental electrical circuit. And figure 3.4 showed that when
the power of the arc reached maximum value, the arc would not extinguish as fast as it was
expected. Instead, the power began to smoothly decrease and plasma channel was still
visible for considerable time.
The gliding arc has been called “intermediate” plasma, having both thermal plasma
and non-thermal plasma character, which offers greater energy density to perform hydrogen
24
From the visual observation, the color of the gliding arc changed from white to
blue-violet after the ethanol-water solution injected, moreover the area of the discharge
were also increased (Figure 3.5 to 3.7). The changed of the working gas changed the
composition of the plasma casuing the color and discharge area different. In figure 3.5, the
visual observation of the gliding arc are more arc-like and longer comparing to figure 3.6
and figure 3.7 which seems more uniform and flame-like. In the section 3.2.2, the elctrical
character under these conditions were mentioned.
In figure 3.8 to 3.10 the arc column motion was captured by high speed camera with
1200 frames per second (Casio, EX-F1) and from (a) to (d) are within a cycle and ordered in
time. White dot line in the figure represents a pair of electrodes’ location. And the input
plasma power parameter was the same in figure 3.8 to 3.10 (The power were set at 50%). In
figure 3.8 and figure 3.9, the arc column motion did perform unstable in moving distance.
In figure 3.10, two arcs were ignited at the same time. In other words, the new arc ignited
before the previous arc exterminated.
3.2.2 Electrical Characterization of Gliding Arc
In the gliding arc electrical characters research, air flow rate was controlled at 1.5 SLM.
Three different input power were applied to gliding arc electrode. By integrating plasma
voltage and current which were measured by oscilloscope, the plasma absorption power was
25
3.1 showed the plasma absorption power calculated in various numbers of cycles in
different input power. From the results, the short period electrical characters of gliding arc
were uncertain, in other words the absorption power needs to integrate at least 500 cycles.
The table showed that at 30 % of power supply input, the absorption power had maximum
values regardless of using air or ethanol steaming added air. Also from the visual
observation at 30% of power supply input, the gliding arc plasma was arc-like different
from 40 % and 50 % of power supply input which were flame-like. And how the input
power affects the hydrogen reforming results were discussed in the following section. In
table 3.1 and 3.2, the ethanol steaming added gliding arc plasma had better power
absorption efficiency than air-only gliding arc plasma. Comparing to the previous section,
visual observation of gliding arc, did find out that ethanol steaming added has longer
plasma arc elongations.
Figure 3.11 to 3.13 showed voltage waveform and current waveform versus time
under different input power and the voltage pulsed on every 50 µs (20 kHz). In figure 3.11 to 3.13, the peaks of current raised differently in every cycle. The probable reason causing
unstable peak current was that the arc column motion may move differently in every cycle.
Moreover, same unstable phenomenon was also observed by using high speed camera.
3.2.3 Plasma Reforming Efficiency
26
was calculated. Through adjusting gas flow rate, carbon to oxygen ratio and input power,
the study summarized the optimum parameters setting. The optimum settings for plasma
reforming were at 1.5 SLM air flow rate, 0.7C/O ratio and 50% of plasma power input
(absorption power: 223 W). And the reforming results were 39 % conversion rate, 43 %
hydrogen selectivity and 32 % carbon dioxide selectivity.
3.2.3.1 Effect of Gas Flow Rate
The reactant gas flow rate is one of the parameters that affect the plasma reforming
efficiency dramatically. As high as the flow rate, the residence time in the plasma area
decrease. Residence time theoretically affects the dissociation and ionization of reactant.
Preliminary results of how the gas flow rate and reactant residence time were brought out in
section 3.2.3.1 and 3.2.3.3.
In the following figure 3.14 to 3.16, the reforming results were showed. Figure 3.14
represented the conversion rate, hydrogen selectivity and carbon dioxide selectivity versus
the gas flow rate at same reactant temperature 160 ℃, 0.7 C/O ratio and the same plasma
power 50 % input (absorption power: 223 W). As the flow rate increased from 1.0 SLM to
1.5 SLM, the conversion rate slightly increased, however as the flow rate raised to 2.0 SLM
the conversion rate decreased dramatically. And the same trend also appeared on the
selectivity of hydrogen. Through the experiment, the 1.5 SLM flow rate condition was
27
highest among other conditions. As flow rate rose up, the conversion rate went down. The
probable reason may because the residence time in discharge area was too short to let the
reactant reforming well.
In the figure 3.15, the H-selectivity were showed against air flow rate. There was few
CH4 produced barely nothing. The main products that contained H atoms were hydrogen
and steaming. The highest hydrogen selectivity was 43 % at 1.5 SLM air flow rate and the
H2O selectivity was about 57 %.
In the figure 3.16, the C-selectivity were showed against air flow rate. There was few
CH4 produced barely nothing. The main products that contained C atoms were carbon
dioxide and carbon monoxide. The highest carbon monoxide selectivity was around 75 % at
1.0 SLM air flow rate and the CO2 selectivity was about 25 %.
3.2.3.2 Effect of Carbon to Oxygen Ratio
C/O ratio is the ratio of C atoms versus the ratio of O atoms in the reforming reactant.
(C/O ratio= 2* mole number of ethanol/ (mole number of ethanol+ oxygen)). According to
the literature survey [L. D. Schmidt et al., 2004], the C/O ratio is another parameter that
affect reforming efficiency dramatically. Figure 3.17 shows that how conversion rate, H2
selectivity and CO2 selectivity changed by C/O ratio at 1.5 SLM air flow rate, 160℃
reactant temperature and 50 % of plasma input power (absorption power: 223 W). When
28
lowest. When C/O ratio rose to 0.7, the H2 selectivity was the highest 43 % and conversion
rate was 35 % which was the best reforming results compare to other C/O ratios. This result
also matched the optimum conditions of Rh catalyst reforming [L.D. Schmidt et al., 2004].
Hopefully, the plasma assisted catalyst at C/O ratio 0.7 could have the best efficiency. For
this reason, the preliminary experiments of PAC were conducted at C/O ratio 0.7 and the
results were discussed in the section of 3.3.
In the figure 3.18, the H-selectivity were showed as function of C/O ratio. There was
few CH4 produced barely nothing. However, when C/O ratio was 0.7, the CH4 selectivity
was around 3 %. The main products that contained H atoms were hydrogen and steam. The
highest hydrogen selectivity was around 43 % at C/O ratio 0.7 and the H2O selectivity was
almost 57 %.
In the figure 3.19, the C-selectivity were showed against C/O ratio. There was few CH4
produced barely nothing. However, when C/O ratio was 0.7, the CH4 selectivity was around
3 %. The main products that contained C atoms were carbon dioxide and carbon monoxide.
The highest carbon monoxide selectivity was around 85 % at C/O ratio 0.7 and the CO2
selectivity was about 10 %.
3.2.3.3 Effect of Residence Time
In this section, the effect of residence time that reactant passed through the discharge
29
air flow rate and the C/O ratio. In fact, it’s hard to study whether the residence time or C/O
ratio influence the reforming results stronger. Following table 3.3 shows the reforming
results in different flow rate which causing different residence time. The table content was
based on figure 3.14. According to the table, when the air flow rate rose from 1 SLM to 2
SLM, the residence time decreased from 588 ms to 390 ms. The selectivity of hydrogen
were the best at 467 ms (1.5 SLM) and conversion rate were 39%. Dramatically changed of
residence time seemed to affect conversion rate stronger.
The table 3.4 were listed to discuss how C/O ratio affects the reforming efficiency. The
first two rows were constant at air flow rate 1.5 SLM, and C/O ratio were set at 0.7 and 0.65
(residence time changed from 467.2 ms to 491 ms which were slightly different). The
selectivity of hydrogen changed intensively when C/O ratio different from 0.7 to 0.65. By
comparing these two tables, the results inferred that the residence time did affect the
reforming efficiency, however the C/O ratio affects efficiency stronger.
3.2.3.4 Effect of Input Plasma Power
Figure 3.20 discussed that conversion rate and H2, CO2 selectivity as function of the
plasma power input. The air flow rate was constant at 1.5 SLM, reactant temperature was
160℃, and C/O ratio was set at 0.7.
In the section of visual observation of gliding arc, the different plasma type were
30
power was 263 W at plasma power 30 % input, 183 W at plasma power 40 % input and 223
W at plasma power 50 % input. In figure 3.20, when plasma power 50 % input, the SH2 was
the highest, 43 %, and conversion rate was 37 %. Interesting, the plasma power 30 % and
40 % input were very different from 50 % plasma power input.
3.3 Plasma Assisted Catalyst (PAC) Reforming
In section 3.3, the preliminary results of plasma assisted catalyst reforming were
discussed. The PAC reforming conditions were set at air flow rate 1.5 SLM, gas temperature
160℃ and C/O ratio 0.7 which is the optimize settings.
3.3.1 Comparison between Plasma, Catalyst and PAC Reforming
In the catalyst reforming experiment, the rose of air flow rate decreased the reforming
efficiency dramatically. In this section, the gliding arc plasma was set up to promote the
catalyst reforming. The experimental conditions were 1.5 SLM air flow rate, C/O ratio 0.7,
and gas temperature 160℃. The results were listed as table 3.5. The PAC reforming had 100
% conversion rate and 111.2 % hydrogen selectivity. Comparing to catalyst reforming and
plasma-alone reforming, the PAC reforming efficiency was improved a lot. The study of
PAC reforming at this stage was rough, in the future, the systematic study of PAC need to
be done.
Table 3.6 showed the efficiency and LHV produced per second in catalyst, PAC and
31
summation of the carbon monoxide and hydrogen gas. And efficiency means the LHV of
product (H2 plus CO) divided by the LHV of inputted ethanol. The electrical power
consumption and the fuel and the catalyst cost were calculated into the total cost. Still, the
PAC produced the most of LHV per second and its efficiency reached over 50 %. Though, it
needed more cost than catalyst and plasma reforming, PAC reforming still was the most
32
Chapter 4 Conclusion and Future Work
4.1 SummaryIn this study, the plasma reactor, gliding arc plasma, was self-designed. The basic
plasma characters, electrical characters and plasma appearance, were diagnosed.
Furthermore, the reforming system which contains plasma reactor, heating reactor,
reforming fuel injection system, GC and catalyst preparation was setup well. By comparing
the preliminary experiment results with the literature survey, the self-designed catalyst
reforming system has been proven well function.
In the catalyst reforming experiment, there was an optimum furnace temperature, 270
℃, for heating reactant to conduct reforming reaction. And the highest hydrogen selectivity
peaks at ~117%.
How the Gliding arc plasma reforming affect by various parameters were studied. The
parameters contain air gas glow rate, C/O ratio, residence time, and plasma power input.
Under optimized settings, 1.5 SLM air flow rate, C/O ratio 0.7, 160 ℃ reactant
temperature and 50% plasma power input, the conversion rate was 31 %, SH2 was 42 % and
SCO2 was 42 %.
Finally, the plasma assisted catalyst reforming was conducted under 1.5 SLM air flow
rate, C/O ratio 0.7, 160 ℃ reactant temperature and 50% plasma power input. The
33
plasma and catalyst reforming.The efficiency of PAC reforming was 58%.
4.2 Recommendation of Future Work
The future work of this study are suggested as followed:
1. To compare different mole ratio of ethanol and steam injected.
2. PAC reforming should study in detail and different catalyst should apply to PAC
system.
3. The optical emission spectral analysis of gliding arc should be done to understand how
the plasma assists injected fuel reform into hydrogen.
4. To compare different reforming fuel such as methane or propane reforming.
5. We shall develop gliding arc in tornado plasma which promises to have longer
34
REFERENCES
[1] Batista, M.S., Santos, R.K.S., Assaf, E.M., Assaf, J.M., and Ticianelli, E.A., ‘‘High efficiency steam reforming of ethanol by cobalt-based catalysts’’, Journal of Power
Sources, 134, 27-32, 2004.
[2] Bo, Z., Yan, J.H., Li, X.D., Chi, Y., and Cen, K.F., ‘‘Scale-up analysis and development of gliding arc discharge facility for volatile organic compounds decomposition’’,
JOURNAL OF HAZARDOUS MATERIALS,Vol.155, No.3, pp.494-501.
[3] Bo, Z., Yan, J.H., Li, X.D., Chi, Y., Cheron, B., and Cen, K.F., ‘‘The dependence of gliding are gas discharge characteristics on reactor geometrical configuration’’,
PLASMA CHEMISTRY AND PLASMA PROCESSING, Vol.27, No.6, pp.691-700,
2007.
[4] Bo, Z., Yan, J.H., Li, X.D., et al. ‘‘Plasma assisted dry methane reforming using gliding arc gas discharge: Effect of feed gases proportion’’, INTERNATIONAL JOURNAL OF
HYDROGEN ENERGY, Vol.33, No.20, pp.5545-5553, 2008.
[5] Cavallaro, S., Chiodo, V., Freni, S., Mondello, N., and Frusteri, F., ‘‘Performance of Rh/Al2O3 catalyst in the steam reforming of ethanol: H2 production for MCFC’’,
Applied Catalysis A: General, 249, 119-128, 2003.
35
oxidation of methane with plasma-assisted catalysis’’, INTERNATIONAL JOURNAL
OF HYDROGEN ENERGY, Vol.33, No.2, pp.644-671, 2008.
[7] Chen, H.L., Lee, H.M., Chen, S.H., et al., ‘‘ Review of plasma catalysis on hydrocarbon reforming for hydrogen production-Interaction, integration, and prospects’’, APPLIED
CATALYSIS B-ENVIRONMENTAL,Vol.85, No.1-2, pp.1-9, 2008.
[8] Cohn, D.R., Rabinovich, A., Titus, C.H., and Bromberg, L., Int. J. Hydrogen Energy, 22, 715–723, 1997.
[9] Comas, J., Mariño, F., Laborde, M., and Amadeo, N., ‘‘Bio-ethanol steam reforming on Ni/Al2O3 catalyst’’, Chem Eng Journal, 98, 61-68, 2004.
[10] Diagne, C., Idriss, H., and Kiennemann, A., ‘‘Hydrogen production by ethanol reforming over Rh/CeO2–ZrO2 catalysts, Catalysis Communications’’, 3, 565-571,
2002.
[11] Erdohelyi, A., Raskó, J., Kecskés, T., Tóth, M., Dömök, M., and Baán, K., ‘‘Hydrogen formation in ethanol reforming o n supported noble metal catalysts’’, Catalysis Today,
116, 367-376, 2006.
[12] Fatsikostas, A.N., et al., ‘‘Reaction network of steam reforming of ethanol over Ni-based catalysts’’, Journal of Catalysis, 225, pp. 439-452, 2004.
36
Perspect., 111 (1), A38-A41, 2003.
[14] Fouhy, K., and Ondrey, G., Chem Eng, 103, 46–47, 1996.
[15] Frusteri, F., Freni, S., Chiodo, V., Spadaro, L., Di Blasi, O., Bonura, G., and Cavallaro, S., ‘‘Steam reforming of bio-ethanol on alkali-doped Ni/MgO catalysts: hydrogen
production for MC fuel cell’’, Applied Catalysis A: General, 270, 1-7, 2004.
[16] Frusteri, F., Freni, S., Spadaro, L., Chiodo, V., Bonura, G., Donato, S., and Cavallaro, S., ‘‘H2 production for MC fuel cell by steam reforming of ethanol over MgO
supported Pd, Rh, Ni and Co catalysts”, Catalysis Communications, 5, 611-615, 2004.
[17] G. Petitpas, J.D. Rollier, A. Darmon, J. Gonzalez-Aguilar, R. Metkemeijer, and L.Fulcheri, ‘‘A comparative study of non-thermal plasma assisted reforming
technologies’’, International Journal of Hydrogen Energy, Vol. 32, No.14,
pp.2848-2867, 2007.
[18] Kalra, C.S., Cho, Y.I., Gutsol, A., Fridman, A., and Rufael, T.S., ‘‘Gliding arc in tornado using a reverse vortex flow’’, REVIEW OF SCIENTIFIC INSTRUMENTS, Vol. 99,
No.2, 025110, 2005.
[19] Kalra, C.S., Cho, Y.I., Gutsol, A., Fridman, A., and Rufael, T.S., ‘‘Non-Thermal Plasma Catalytic Conversion of Methane to Syn-Gas’’, ABSTRACTS OF PAPERS OF THE
AMERICAN CHEMICAL SOCIETY, Vol.228, No.1, pp.U687-U687, 2004.
37
Fridman, A., Electronic Proceedings of the 16th International Symposium on Plasma
Chemistry, Taormina, Italy, pp.22–27, 2003.
[21] Kalra, C.S., Gutsol, A.F., and Fridman, A.A., ‘‘Gliding arc discharges as a source of intermediate plasma for methane partial oxidation’’, IEEE TRANSACTIONS ON
PLASMA SCIENCE, Vol.33, No.1, pp.32-4, 2005.
[22] Kusano, Y., Teodoru, S., Leipold, F., et al., ‘‘Gliding arc discharge - Application for adhesion improvement of fibre reinforced polyester composites’’, SURFACE &
COATINGS TECHNOLOGY, Vol.202, No.22-23, pp.5579-5582, 2008.
[23] Kuznetsova I.V., Kalashnikov N.Y., Gutsol A.F., Fridman A.A., and Kennedy L.A. ‘‘Effect of "overshooting" in the transitional regimes of the low-current gliding arc
discharge’’, JOURNAL OF APPLIED PHYSICS, Vol.92, No.8, pp.4231-4237, 2002.
[24] L. Bromberg, D.R. Cohn, A. Rabinovich, N. Alexeev, A. Samokhin, K. Hadidi, J. Palaia, and N. Margarit-Bel, ‘‘Onboard Plasmatron Hydrogen Production for Improved
Vehicles’’, PSFC JA-06-3, 2006.
[25] Liguras, D.K., Kondarides, D.I., and Verykios, X.E., ‘‘Production of hydrogen for fuel cells by steam reforming of ethanol over supported noble metal catalysts’’, Applied
Catalysis B: Environmental, 43, 345-354, 2003.
[26] Llorca, J., Homs, N., Sales, J., Fierro, J.L.G., and Piscina, P.R., ‘‘Effect of sodium addition on the performance of Co–ZnO-based catalysts for hydrogen production from
38
bioethanol’’, Journal of Catalysis, 222, 470-480, 2004.
[27] Llorca, J., Piscina, P.R., Dalmon, J.A., Sales, J., and Homs, N., ‘‘CO-free hydrogen from steam-reforming of bioethanol over ZnO-supported cobalt catalysts: Effect of the
metallic precursor’’, Applied Catalysis B: Environmental, 43, 355-369, 2003.
[28] Mutaf-Yardimci, O., Saveliev, A.V., Fridman, A.A., and Kennedy, L.A., ‘‘Thermal and non-thermal regimes of gliding arc discharge in air flow’’, JOURNAL OF APPLIED
PHYSICS, Vol.87, No.4, pp.1632-1641, 2000.
[29] Shiki, H., Motoki, J., Ito, Y., et al. ‘‘Development of split gliding arc for surface treatment of conductive material’’, THIN SOLID FILMS, Vol.516, No.11,
pp.3684-3689, 2008.
[30] Sun, J., Qiu, X.P., Wu, F., and Zhu, W.T., ‘‘H2 from steam reforming of ethanol at low
temperature over Ni/Y2O3, Ni/La2O3 and Ni/Al2O3 catalysts for fuel-cell application’’,
Int. J. Hydrogen Energy , 30, 437-445, 2005.
[31] Vizcaino, A.J., Carrero, A., and Calles, J.A., ‘‘Hydrogen production by ethanol steam reforming over Cu–Ni supported catalysts’’, Int. J. Hydrogen Energy, 32, 1450-1461,
2007.
[32] Wang, J.H., Lee, C.S., and Lin, M.C., ‘‘Mechanism of Ethanol Reforming: Theoretical Foundations’’, JOURNAL OF PHYSICAL CHEMISTRY C, Vol.113, No.16, pp.
39
6681-6688, 2009.
[33] Yang Y.C., Lee B.J., and Chun Y.N., ‘‘Characteristics of methane reforming using gliding arc reactor’’, ENERGY, Vol.34, No. 2, pp. 172-177, 2009.
[34] Yang, Y., Ma, J., and Wu, F., ‘‘Production of hydrogen by steam reforming of ethanol over a Ni/ZnO catalyst’’, Int. J. Hydrogen Energy, 31, 877-882, 2006.
40 Tables Catalyst (wt%) Carrier T (oC) S/C Conversion Rate (%) H2 Selectivit y (%) Reference Rh (1) γ-Al2O3 750 3 100 ~95 Liguras 2003 Rh (2) 100 ~96 Ru (1) 42 ~55 Ru (5) 100 ~96 Pt (1) 60 ~65 Pd (1) 55 ~50 Rh (5) γ-Al2O3 650 8.4 100 (started) 43 (100hr) --- Cavallaro 2003 Rh (3) MgO 650 8.5 99 91 Frusteri 2004b Pd (3) 10 70 Ni (21) 42 97 Co (21) 55 92 Ru (1) CeO2 450 3 56(20min) 25(100min) 35(20min) 24(100mi n) Erdohelyi 2006 Rh (1) 80(20min) 57(100min) 83(20min) 72(100mi n) Ir (1) 54(20min) 35(80min) 40(20min) 25(80min) Pt (1) 89(20min) 88(100min) 35(20min) 40(100mi n) Pd (1) 33(20min) 25(100min) 32(20min) 18(100mi n) Rh (2) CeO2 300 8 58.5 59.7 Diagne 2004 400 100 66.3 500 100 69.1 ZrO2 300 100 57.4 400 100 68.1 500 100 71.7
S/C:Mole ratio with water and ethanol
41 Catalyst (wt%) Carrier T (℃) S/C Conversion Rate (%) H2 Selectivity (%) Reference Ni (20) La2O3 773 3 35 70 Fatsikostas 2004 1073 ~100 95 γ-Al2O3 973 77 87 1073 100 96 Ni (20.6) Y2O3 593 3 93 50 (60hr) Sun 2005 Ni (16.1) γ-Al2O3 89 44.4(60hr) Ni (15.3) La2O3 100 62.3(60hr) Ni (35) γ-Al2O3 773 6 100 91 Comas 2006 Ni (10) γ-Al2O3 923 8 100 78.2 Yang 2006 MgO 100 82.2 La2O3 100 89.3 ZnO 100 89.1 Ni (21) MgO 923 8.5 45(20hr) 95(20hr) Frusteri 2004 K(1)-Ni(21) 59(20hr) 93(20hr) Na(1)-Ni(21) 55(20hr) 95(20hr) Li(1)-Ni(21) 83(20hr) 91(20hr) Cu(2)-Ni(14) SiO2 873 3.7 100 71.5 Vizcaíno 2007 Cu(2)-Ni(14) Al2O3 99.2 50.1 Co (10) ZnO 623 13 100(75hr) 73.4 Llorca 2003 Co(10)-Na(0.06) ZnO 673 13 100 72.1 Llorca 2004b Co(10)-Na(0.23) 100 73.4 Co(10)-Na(0.78) 100 74.2 Co(10)-Na(0.06) 723 100 73.1 Co(10)-Na(0.23) 100 73.7 Co(10)-Na(0.78) 100 74.0 Co (10) Al2O3 673 3 74 60-70 Batista 2004 Co (10) 99 63-70 Co (10) SiO2 89 62-70 Co (10) 97 69-72
S/C:Mole ratio with water and ethanol
42
Author Reactor Fuel
Reform ing process
Flow rate (slm)
Plasma reactor Performance Electrodes Design Power (w) C1 (%) S2 (%) E3 (%) A. Fridman et al. (2005) Gliding arc Methane Pox* 2-10 50 87 N/A 75.81 Isooctane ATR** + catalyst 4 75 N/A 48.78
GAT Methane Pox N/A 200 80 N/A 74
L. Bromberg et al. (MIT 2006) GEN 2 Methane ATR + catalyst 30-50 210 103.9 N/A 63.59 GEN 3 Ethanol Pox + catalyst 20 200 N/A N/A 43.5
43 Y. N. Chun et al. (2008) Gliding arc Propane Steam* ** + CO2 11-20 390- 1370 62.6 N/A N/A Methane Pox + catalyst 5-30
(Three gliding arc electrodes connected
in 120°)
1300 67 93 35
1. C: conversion rate 2. S: selectivity 3. E: efficiency
Pox*: Partial oxidation reaction. ATR**: Auto thermal reaction.
Steam***: Steam reforming reaction.
Table 1.3 Summary of important features, experiments and parameters for plasma and
44
Author Phase Power generator Power input
Y. Kusano et al. (2008)
AC
Power supply (Generator 6030. SOFTAL Electronic GmbH, Germany). Input power: 1.6-2.2 kW Frequency: 33-40 kHz B. Zheng et al. (2008) AC Input voltage: 10 kV Frequency: 50 Hz A.Fridman et al. (2005)
DC Power supply (Universal Voltronics, Inc.)
Input voltage: 10 kV Input current: 0.05-0.15 A H. Shiki et al. (2008) Pulse
Pulse modulator (Kurita Seisakusho Co., Ltd., 6 kW) Slide regulator (Matsunaga Seisakusho, S3-2413, 5.2 kVA)
High-voltage transformer (Kurita Seisakusho Co., Ltd., 250/12 kV)
Input power: 300 W Pulse frequency: 15-20 kHz Pulse width: 1.6-2.8 μs
45
Instrument Model Specifications
1
Rogowski coil
(Figure 2.6)
IPC CM-100-MG,
Ion Physics Corporation Inc.
Max. peak current: 500A
Output sensitivity: 1V/A
2
High-voltage
probe
(Figure 2.7)
Tektronix P6015A
Max. peak voltage: 40kV
Max. Bandwidth:75MHz 3 Thermocouple (Figure 2.8) K type Measurement range: -20 °C to +400 °C 4 Gas chromatograph (Figure 2.9) YL 6100GC Packed columns: Molecular Sieve 5A (80/100) Porapak N (50/80 mesh)