Th
Mot
he Role
tivation
V
Ad
Co
Gr
Co
M
e of Or
n of Em
Vung A
dvisor
o-Advise
raduate S
ollege o
I-Sho
MAST
rganiza
mploye
Ang Jo
er
Student
J
of Man
u Univ
ER T
ational
ees - A
oint Sto
: Dr.
: Dr.
: Ngu
July 201
nageme
versity
THESI
l Cultu
A case s
ock Co
Wang C
Truong
uyen Ca
15
ent
IS
ure on W
study o
mpany
Ching C
g An Qu
anh Kh
Workin
of
Viet-y
Chang
uoc
ang
ng
-Lao
i
ACKNOWLEDGEMENT
My graduation thesis would not have been possible without the support of many people.I would like to express my special appreciation and thanks to my supervisor Dr. Wang Ching Chang, she has been a tremendous mentor for me. I would like to thank her for encouraging my thesis, for her brilliant comments and for valuable assistance.
I would like to express my deepest thanks to Prof. Truong An Quoc for his enthusiastic and professional instructions, all the useful and prompt advice that help me complete my graduation thesis successfully
I would like to thank all staffs working in Viet –Lao Vung Ang Port Joint Stock Company, who have created favorable conditions for me during my internship and provided me with enjoyable moment.
Special thanks also to my classmates and my best friends for always being by my side.I wish to express my gratitude to my family, who supported me and fostered me to strive
towards my goal.
ii
ABSTRACT
Within 5 main chapters, the thesis “The Roles of Organizational Culture on working motivation of Employees – A case study of Viet –Lao Vung Ang Joint Stock Company” has obtained the following results. In chapter 1, the author presents about research background, research purpose, contribution of the thesis and structure of this thesis. Chapter 2 is all about literature review. In this chapter, the author systematizes theory about organizational culture, working motivation, relationship between organizational culture and working motivation of employees. This chapter also builds research and develop models with fake research theory. The next chapter is about methodology - methods to test outlined research hypotheses. This chapter includes study design, the sources of data, design sample – sampling, methods and tools to collect information, data processing method. Chapter 4 is results and discussion. The purpose of this chapter is to present the research results that are obtained through analysis and testing research models. The author point out how theculture inViet –Lao Vung Ang Joint Stock Company affect the labor motivation in this company. The last chapter – chapter 5, is conclusions. In this part, the author makes summary about main results of the study, the implications of research for administrators as well as the limitations of the thesis and suggestions for further research in the future.
iii
TABLE OF CONTENTS
ACKNOWLEDGEMENT ... ii
ABSTRACT ... ii
TABLE OF CONTENTS ... iii
LISTS OF TABLES ... vi
LISTS OF FIGURES ... vii
CHAPTER 1: INTRODUCTION ... 1
1.1. Research background ... 1
1.2. Research purpose ... 3
1.3. Task of research ... 3
1.4 Subject and scope of research ... 3
1.5. Research Method ... 4
1.6. Contribution of the thesis ... 4
CHAPTER 2: LITERATURE REVIEW ... 5
2.1. The theory of organizational culture ... 5
2.1.1. The definition of culture ... 5
2.1.2. Organizational culture ... 5
2.1.3. The roles of organizational culture ... 7
2.2. The theory of labor motivation and the need to motivate employees ... 8
2.2.1. The basic definitions ... 8
2.2.1.1. Demand and incentive ... 8
2.2.1.2. What is motivation? ... 8
2.2.1.3. What is to motivate? ... 8
2.2.2. The necessary to motivate employees ... 9
iv
2.2.2.2. The necessary of creating motivation for employees ... 9
2.2.3. Factors affecting labor motivation ... 9
2.2.3.1. Personal factors of employees ... 9
2.2.3.2. Factors of business environment ... 9
2.2.3.3. The factors belong to the content and nature of work ... 9
2.2.4. Theories about motivation ... 10
2.2.4.1. Maslow's hierarchy of needs ... 10
2.2.4.2. Stacy Adams’ equity theory ... 11
2.2.4.3. Positive reinforcement of Skinner ... 11
2.2.4.4. Vroom's expectancy theory ... 11
2.2.4.5. Two factor theory of Herzberg ... 11
2.2.4.6. The Goal Setting Theory of Edwin Locke ... 11
2.2.4.7. ERG theory of Relatedness by Rowth ... 11
2.2.4.8. The job characteristics model of Hackman - Oldham ... 11
2.3. The relationship between organizational culture and motivating employees ... 12
2.4. Research model ... 13 CHAPTER 3: METHODOLOGY ... 15 3.1. Study design ... 15 3.2 Sources of data ... 15 3.2.1 Primary data ... 15 3.2.2 Secondary data ... 15 3.3 Sampling ... 15
3.4 Methods and tools of collecting data ... 16
3.4.1 Methods of data collection ... 16
3.4.2 Tools of collecting data ... 16
v
CHAPTER 4: RESULTS AND DISCUSSION ... 20
4.1 Introduction ... 20
4.2 Clean and describe obtained sample ... 20
4.3 Analysis and assess measuring tools ... 21
4.3.1 Crobach’s Alpha coefficient ... 23
4.3.1.1 The scale of organizational culture ... 23
4.3.1.2 The scale of working motivation ... 27
4.3.2 Factors Analysis ... 27
4.3.2.1 The scale of organizational culture ... 27
4.3.2.2 The scale of working motivation ... 29
4.4 RESEARCH HYPOTHESIS TESTING ... 30
4.4.1 Analysis of the relationship between the variables ... 30
4.4.2 Analysis of multiple linear regression ... 32
4.5 Discussion ... 33
CHAPTER 5: CONCLUSIONS ... 35
REFERENCE ... 38
vi
LISTS OF TABLES
Table 3.1: Summary the structure of questionnaire for official study ... 17
Table 4.1: The demographic information of the object responses ... 21
Table 4.2: Coefficient of Cronbach's Alpha reliability of the scale of the cultural aspects of organizations ... 25
Table 4.3: Statistics of observed variables and Crobach’s Alpha coefficient of the scale organizational culture ... 26
Table 4.4: Cronbach's Alpha coefficient of working motivation scale(n = 150) ... 27
Table 4.5: KMO and Barllet's inspection –the scale of organizational culture ... 28
Table 4.6: Results of factor analysis - scale aspects of organizational culture ... 28
Table 4.7: KMO and Barllet's inspection - the scale of working motivation ... 29
Table 4.8: Factors analysis- the scale of working motivation ... 29
Table 4.9: The correlation between organizational culture and working motivation of employees ... 31
Table 4.10: The determining factor model (model 1) ... 32
Table 4.11: Statistical analysis of the regression coefficients (model 1) ... 32
Table 4.12: The coefficient determining model (model 2) ... 33
vii
LISTS OF FIGURES
Figure 2.1 Maslow's hierarchy of needs ... 10 Figure 2.2 Framework Research ... 13 Figure 4.1: Results of linear correlation of the components in the model study ... 33
1
CHAPTER 1: INTRODUCTION
1.1. Research background
Human Resource plays an important role in operation of a company or an organization. An organization can achieve high labor productivity when it has members who work hard and creatively. It depends mostly on the ways and methods that managers use to motivate the staffs. Besides, mentioning to human means talking about culture, because the entire cultural values make the quality and spirit capability of the human. Culture is an internal resource that can create a breakthrough development and sustainability for an organization when that organization exploit and apply the cultural elements into its operations.
In Vietnam, Resolution in 5th Conference of the Party Central Committee defined that: “Culture is the spiritual foundation of society, it is the goal and the force that promote economic - social development”, we need to make culture permeate into all aspects of life. Especially, as Vietnam jointed WTO since 2007, domestic corporations were put into an environment of fierce competition in the global field. To maintain and develop, the company must bring into internal resources, search and admit external resources. The theory and reality have shown that: “Corporate culture is seen as an internal resource, it directly promote the sustainable development of corporate and contribute in the success of the industrialization and modernization of the country”.
Vung Ang Economic Zone has an area of 22.781 hecta. It is one of five coastal key economic zones, which are in top priority to be invested in period from the year of 2013 to 2015. The government is planning the development of pillar industries which have national strategic significance, include: Iron and steel refining complex zone with capacity of 22 million tons per year (Formosa); Thermal Power Centre 6.300 MW ; Deepwater Port with capacity of 50 million tones per year by 2015 and 82 million tons per year by 2020; Petrochemical center with capacity of 16 million tons per year; Petroleum and liquefied gas depot serving the North Central region of Vietnam and Lao People's Democratic Republic. Vung Ang - Son Duong Deepwater port is built for ship with a tonnage of 300,000 ton; the planning of the port includes 59 berths that were constructed and 18 berths are begun to go into operation. International maritime route is easy from Vung Ang - Son Duong to South Asia, North America, Europe and other countries worldwide.
2
Vung Ang Economic Zone is developed with over 350 enterprises with a capital of 16 billion USD. Currently, the Zone is constructing major projects in steel, thermal power, deep-water port system. Investment in steel products, the mechanical engineering industry, molds and products serving consumer and home office; after petrochemical refinery in Vung Ang Economic Zone supporting industry will have many advantages to develop because of having raw materials, electricity and water on site. Reasonable transportation costs and Vung Ang - Son Duong deep-water port will also create convenient condition for the import and export of commodities and raw materials… Vung Ang Economic Zone will become a center of heavy industry in Vietnam with branches: the biggest Steel, largest Electricity, deepest water port and most ports.
In recent years with rate high in investment, the projects are implemented on schedule; Vung Ang Economic Zone has become a place that attracts effective investment. Besides, projects were put into operation as the commitment, gave high economic value to the enterprise, created jobs for local workers and contributed to the budget of Ha Tinh. Moreover, the investment in infrastructure construction in Vung Ang Economic Zone was concerned and strongly deployed by Management Board of Economic Zone in Ha Tinh, which is the basis for the call for investment promotion projects and fields in accordant with planning and development goals of Vung Ang Economic Zone. The call for investment in Vung Ang Economic Zone focuses on fields such as steel rolling, steel logistics industry, petrochemical industry, ports and maritime transport, commercial-services center, tourism linked to efficient exploitation of landscapes and beautiful beaches in Vung Ang Economic Zone. With the effective planning management, synchronous and modern infrastructure investment, Vung Ang Economic Zone is eligible to attract investment harmoniously between the fields, coordinated and sustainable development.
The current situation is that there are many foreign companies invest in Vung Ang Economic Zone; especially Formosa Group of Taiwan, the role of organizational culture is increasingly respected and appreciated. Especially under the trend that the interest of the employees in the organization not only includes salary, working condition, but also the organizational culture, especially qualified and skillful staffs. Because it is one of the factors that affect their motivation to be enthusiasm and working hard for organizations.
From the reality, being aware the importance and the necessity of corporate culture in promoting motivation of staff, I choose: “The roles of Corporate Culture to working
3
motivation of staffs in Viet - Lao Vung Ang Port Joint - Stock Company” as my graduation thesis.
Literature suggests that corporate culture on employee commitment to the organization is important in improving the level of employee commitment to the organization, not all corporate cultural measures have impacts on employee commitment (Nongo & Ikyanyon, 2012), the influence of organizational culture, organizational commitment to job satisfaction and employee performance (Svauta, Roena, Setiawan & Solimun, 2012), the relationship between employee motivation, job satisfaction and corporate culture (Roos &Eeden, 2005).
1.2. Research purpose
The aim of this thesis is to make comments and recommendation to improve working motivation of staffs in Vietnamese companies.
The thesis points out the current situation of working motivation of staffs in Vietnamese companies in general and in Viet - Lao Vung Ang Port Joint - Stock Company in particular.
Pushing the development of the company through promoting working motivation of staffs by learning roles of corporate culture in Viet - Lao Vung Ang Port Joint - Stock Company.
To achieve the above objective, the thesis focuses on testing the relationship between organizational culture and working motivation of employees.
1.3. Task of research
The tasks of the research include:
- Systematize theoretical basis of organizational culture and working motivation for employees.
- Study the current situation of working motivation of employeesin Viet - Lao Vung Ang Port Joint - Stock Company
1.4 Subject and scope of research
Subject: Theoretical and real issues related to the roles of organizational culture to working motivation of staffs in Viet - Lao Vung Ang Port Joint - Stock Company
4
Scope: Study the roles of corporate culture on working motivation of staffs in Viet - Lao Vung Ang Port Joint - Stock Company.
1.5.Research Method
The thesis uses the quantitative study. After data collected from all respondents, SPSS software is used for data analysis.
1.6. Contribution of the thesis
The thesis will assess the roles of corporate culture on working motivation of staffs in Viet - Lao Vung Ang Port Joint - Stock Company. In this thesis, the author also proposes some solutions to improve corporate culture in Viet - Lao Vung Ang Port Joint - Stock Company.
5
CHAPTER 2: LITERATURE REVIEW
2.1. The theory of organizational culture
2.1.1. The definition of culture
First, culture is the best things of the nation, is the motivation to maintain cultural traditions through the generations and is the common thought of all peoples in the world (Kottak &Gezon, 2013). Culture is understood in very different ways and there are many different definitions of culture.
Culture in a narrow sense is usually identified with the elite culture. Elite culture is a small culture including values that meet the high demands of the people. The general rule is that the farer the value meeting the needs from physical and temporary, the more valuable and civilized it is. Therefore, this value brings more essence of culture. In this sense, culture is often identified with the arts or literatures.
Culture in narrow sense is identical with behavior culture. In broad sense, culture is defined in scientific studying about culture. In this sense, the definition of culture varies. For example, the first definition of culture of Edward B. Tylorin 1871 was as "one complex includes knowledge, belief, art, morals, law, custom and any other capabilities and habits which people as a member of the society has been achieved ". Dr. Federico Mayor(1999) - Director General of UNESCO, considered "culture includes everything that makes this nation different from another nation.”
According to Heriot(1954): "What's left over when all other things are ignored, that is culture."According to Unesco(2009), "Culture represents and reflects generally and lively on all aspects of life (of each individual and each community), which took place in the past, as well as happening in the present, through constant for centuries, it has constituted a system of values, traditions, beauty and lifestyle, and based on that each nation asserts its own identity."
In summary, culture can be understood as "Culture is a system of values that had been created and accumulated through practical activities, in relation with the natural and social environment."
2.1.2. Organizational culture
Organizational culture is routine, traditional ways of thinking and ways of working in the organization that are shared by all members of the organization (Jaques, 1952)
6
Organizational culture is the system of common sense, which is widely accepted by the workers in a certain time (Pettgrew, 1979)
“When mentioning to organizational culture or culture of an organization, we talk about standards, value, beliefs and behavior ... shown by the members who are associated together to work (Eldrige &Crombie, 1974). Characteristic of a particular organization is represented in its history with the influence of the old system, the old leadership in building people. This proves the difference between following the old and routines, rules and ideologies, as well as choosing the strategic for organizations (Furnham, 1997).
According to Louis (1980), organizational culture is the system of common conceptions of the members in the organization. These conceptions are largely understood by members and they are only suitable for their own organizations. These notions then will be transmitted to new members (Louis, 1980), Organizational culture can be described as a common set of beliefs, routine, value system, behavior standards and individual activities of each organization (Tunstall, 1983). These surfaces define the operating model of the organization and behavior of the members of that organization.
Organizational culture is also understood as the sum of perceptions, beliefs, and values - the factors that members of the organization share and convey through: "What to do? How to do? And who does? (Farmar, 1990). According to Hofstede and his associates (1990), organizational culture has entered the field of academic research in the United States since 1979 and it appears popularly in recent years. In this case, culture is the value system that is accepted and made public; it operates in a certain group in a certain time.
Organizational culture is a common sense system held by members of the organization, which may distinguish this organization with other organizations (Robbins, 2000). Moreover, organizational culture is also defined by Schein (2004) as the skills handed down, including special abilities that are shown by the team members in accomplishing the specific job, the ability to do specific things, are transmitted from this generation to other generations without explicitly written.
Recently, Wu (2008) also believed that organizational culture is the individual choice that is crystallized in a group of people over time. Accordingly, organizational culture is seen as a development process in which the people of an organizational learn from repeat selection. These definitions make the conception of organizational culture, which in reality is expressed with each type of professional institutions such as: corporate culture, school
7
culture, community culture or culture of a certain organization. From the above definitions, we can bring out the common concept of organizational culture: "Organizational culture is all of cultural elements that are selected, created, used by actors (institutions) and expressed during operation process, thereby creating its own identity of the organization."
2.1.3. The roles of organizational culture
Organizational culture performs several roles within the organization. First, organizational culture determines the boundaries, which means culture make the difference between this organization and other organizations. Secondly, culture has spread function for members of the organization. Thirdly, culture increases the stability of the social system in the organization. Fourthly, culture promotes employees to commit to the common goal of the organization (Edgar H. Schein, 2010). Culture is an adhesive, which helps bind the organization through bringing appropriate standards for employees to know what to do and say (Corvin, 2008). Finally, culture helps control to orient and form the attitudes and behavior of employees. The last function has a special meaning for us.
Culture has the role to raise the commitment and increase consistency of workers in the behavior. These things obviously bring real benefits for the organization. From the perspectives of employees, the culture has value because it significantly reduces the ambiguity. It shows the staffs how everything was conducted and what the most important things are.
In contrast, culture can also be a burden when shared values of that organization are not suitable. This situation often happens when the environment of organization is very dynamic. When the environment of the organization is undergoing a rapid change, the old culture of the organization can barely fit anymore (Feldman, 2004). Consistency in behavior is an asset of the organization in a stable environment. However, it can also be a burden for the organization and hind the ability of the organization to adapt to changes in the environment. Furthermore, culture also creates barriers to change, the diversity of human resources within the organization. Labor himself has his own system of values and beliefs. When working in an environment with strong culture background, they must comply with the regulations and common value system of the organization (Schein, 2010). Thus, strengths and advantages of each employee can make advantages of employees be restricted.
8
2.2. The theory of labor motivation and the need to
motivate employees
2.2.1. The basic definitions
2.2.1.1. Demand and incentive
Incentive is meant to be willing, determine to attempt at a high level to achieve the objectives of the organization. Demand can be understood as a psychological state of the people when they feel dissatisfied, lack of something.
2.2.1.2. What is motivation?
An organization can only achieve high productivity when it has members working hard and creatively. That depends largely on the manner and method by which managers use to motivate employees. Therefore, according to organizational behavior "labor motivation is the desire and willing of the employees to strengthen efforts towards achieving goals of organization."
Demand and benefit are closely related to each other. There is no demand, there is no benefit; the benefit is an expression of the demand or it is the demand that is the content of benefit. The bigger the benefits are, the more motivation people have to act for the greater benefit and they may sacrifice this benefit to obtain greater benefits. When there is still a gap between demand and benefit, there is a motivation.
2.2.1.3. What is to motivate?
To motivate employees effectively, it depends greatly on the ability of managers. Therefore, to motivate employees can be understood as all measures of managers apply to employees in order to create incentives for employees in their work (Griffin, 2009). Motivating employees is the responsibility and objectives of managers. Once employees are motivated to work, they will create the potential ability to improve productivity and work efficiency.
Therefore, it is necessary to implement measures that are consistent with the conditions of the organization, as well as the environment in which the organization operate. As Vietnam joined WTO, the urgency and sensitivity make employees fell always fully stretched. Therefore, to relieve the tension in the work of the employees is a necessary condition that the organization must do well and care most. When the company creates the the
9
attractiveness of jobs, salary, bonuses and working condition, the employees will be engrossed in their work.
2.2.2. The necessary to motivate employees
2.2.2.1. Current situation of motivating employees
The fact shows that the majority of Vietnamese companies do not have a proper way regarding for motivating employees.
2.2.2.2. The necessary of creating motivation for employees
* The roles of labor motivation:The roles of labor motivation considering in three aspects: employees, the company and society.
* The necessary to build motivation in the company
In the company, motivation is a very determinant factor that makes employees to work well, devote themselves for the company, and it is related closely to the existence and development of the company. There is no company can endure and develop without the contribution of effort and intelligence of the enthusiastic people. Therefore, it is necessary for the company to create motivation for employees.
2.2.3. Factors affecting labor motivation
2.2.3.1. Personal factors of employees
Personal factors of employees that affect labor motivation include: - The demands and benefits of employees
- Personal goals
- Attitude, personal characteristic - Ability - personal capacity - Seniority, working experience
2.2.3.2. Factors of business environment
In term of business environment, there are some factors affect labor motivation as follow - Corporate culture
- The managers and policy system to manage human resource - Working conditions
2.2.3.3. The factors belong to the content and nature of work
- The at - Differ - The co - Ability - Relatio
2.2.4.
L There a as the fo2.2.4.1
M motivat are, the motivat ttractiveness ent levels o omplexity o y to promot onships at wTheorie
Labor moti are many theollowing:
1. Maslow
Maslow's h te employee ereby givin tion and me s of work of duty, resp of tasks te in work workes about
ivation is on eories as ww's hierarc
hierarchy of es, it is imp g the right et the goals Figu (So ponsibilitymotivat
ne of the pr ell as the dchy of nee
f needs has portant to un t solution f set by the c ure 2.1 Ma ource: Orga10
tion
roblems tha discussions aeds
s a subtext nderstand th for bringing company. aslow's hier anizational B at many ma around this t. If the com he level of g the satis rarchy of n Behavior [2 anagers and concept. T mpany wan needs at w faction for eeds 21]) d scientists The author s nt to know hich the em employees concern. summary how to mployees s, create11
2.2.4.2. Stacy Adams’ equity theory
Equity is a factor that is particularly concerned by the workers, they always compare what they have contributed to the company with what they receive from the company, and they also compare what they receive with what the others receive.
2.2.4.3. Positive reinforcement of Skinner
This theory aims at changing people's behavior through the impact of the reinforcement. According to this theory, the rewarded behavior tends to be repeated and those acts are not rewarded or penalized will naturally limited. The shorter the time between the moment of reward and punish is, the earlier the behavior changes.
2.2.4.4. Vroom's expectancy theory
This theory believes that motivation depends on the expectations of the employees about their capacity to perform their duties and about their chances to receive desired rewards. This theory is not only interested in determining the type of needs, but also concerned about the process for individuals to receive the reward.
2.2.4.5. Two factor theory of Herzberg
American theorists - Mr. Frederick Herzberg divided thefactorcreating motivationfor employees into two categories: maintaining factors - belong to the satisfaction outside, and pushingfactors - internal satisfaction.
2.2.4.6. The Goal Setting Theory of Edwin Locke
Edwin Locke showed that the specific objectives and challenges would lead to better job performance; the intention to work towards the goal is the major source of labor motivation [3, 13]. Thus, the specific objectives and challenges will lead to better job performance. Setting aims need to be combined with providing feedback.
2.2.4.7. ERG theory of Relatedness by Rowth
ERG theory explained why the employees always search for higher salaries and better working conditions, even if these conditions were good and met the standards of the labor market. When employees do not feel satisfied with the communication needs and current growth need, they will seek the way to be satisfied.
12
The job itself has its essential characteristics. These characteristics can make the job exist an intrinsic motivation, and employees will be stimulated to increase productivity depending on each task itself. Therefore, to increase the significance of the work, the company must:
- To increase the diversity of work and enhance the importance of the job - Turn the tasks into opportunities of workers
- To give autonomy to employees
- To have feedback mechanisms quickly and directly to employees
2.3. The relationship between organizational culture and
motivating employees
First of all, we must affirm that organizational culture is a tool affecting to working motivation of employees. Putting these factors into business is to motivate business and production development. Business process requires its elements with certain quality and quantity, as well as the harmonious combination among these factors. One of those basic elements is human being that always involves two aspects: the social aspect and animal aspect. To create the quality of human, the organization must ensure the comprehensive development of it, in which social aspect can be gained or not mainly depend on the inclusion of cultural factors in all activities of the human, involves the business activities and their most basic activities (Pink, 2011). In social relation like that, cultural elements have become a driving force of production and business development through creating the perfect and ensuring quality of this main production factor.
• Organizational culture is the spiritual and cultural activities.
• Organizational culture is reflected in the arrangement place of work logically and beautifully, expressed in the use of music, color in production.
• Organizational culture presents in the traditional hierarchical and order; respect the old love the young.
• Organizational culture reflects in loyalty, duty, responsibility, dedication to the organization, as well as the policies to maintain and attract talent.
• Organizational culture is reflected in the cultural atmosphere of that organization. • Organizational culture is community will and team spirit.
Within the scope of the enterprise, content of culture is shown in the business organization, the personality of the leader and employees.
13
The content of culture of a business is also reflected in attitudes toward the success or failure in the marketplace: "not to be conceited in victory and discourage by failure."
Organizational culture is knowledge and learning.
2.4. Research model
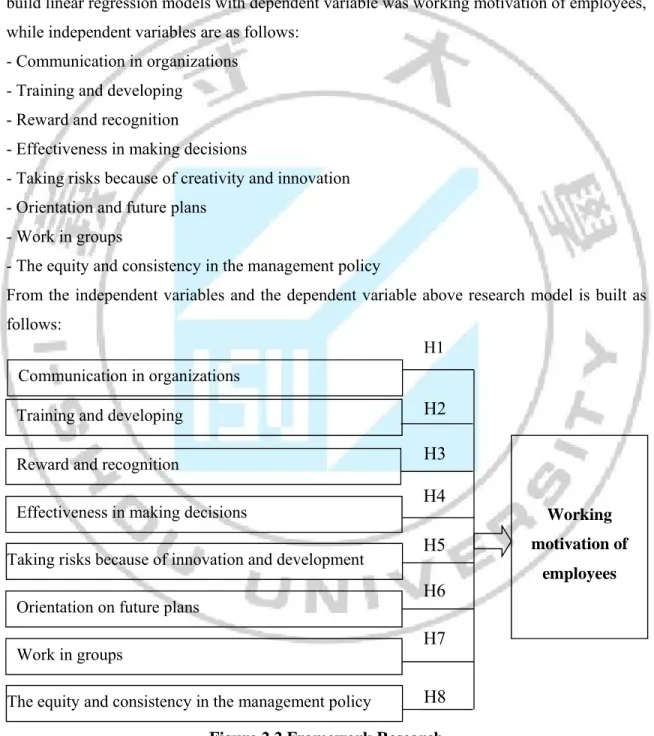
From the base of the theory and related studies, this research project conducted to build linear regression models with dependent variable was working motivation of employees, while independent variables are as follows:
- Communication in organizations - Training and developing
- Reward and recognition
- Effectiveness in making decisions
- Taking risks because of creativity and innovation - Orientation and future plans
- Work in groups
- The equity and consistency in the management policy
From the independent variables and the dependent variable above research model is built as follows:
Figure 2.2 Framework Research
Communication in organizations Training and developing
Reward and recognition
The equity and consistency in the management policy Effectiveness in making decisions
Taking risks because of innovation and development
Orientation on future plans
Work in groups Working motivation of employees
H7
H8
H6
H3
H2
H4
H5
H114
This study was conducted to test the relationship between aspects of organizational culture and working motivation of employees. With research model was constructed as above, the hypothesis built when conducting research is as follows:
H1: Communicate within the organization has positive influence on the motivation of employees
H2: Training and developing have positive influence on the motivation of employees H3: Reward and recognition have positive influence on the motivation of employees
H4: Effectiveness in making decisions has positive influence on the motivation of employees H5: Taking risks because of creativity and innovation has positive influence on the motivation of employees
H6: Orientation and future plans has positive influence on the motivation of employees H7: Working in group has positive influence on the motivation of employees
H8: The equity and consistency in the management policies to positively influence the motivation of staff.
15
CHAPTER 3: METHODOLOGY
Chapter 2 presents the theory and previous studies of other authors involved in the fields of corporate culture and working motivation of employees as well as and builds modeling research and develops hypothesis. Chapter 3 will show issues related to research methods, scales to test the hypotheses proposed. This chapter includes the following sections: (1) study design; (2) The sources of data; (3) Design sample - sampling; (4) Methods and tools to collect information; (5) Data processing method.
3.1. Study design
As mentioned above, research is conducted with the aim of testing the hypothesis about the influence of the cultural aspects of the company on working motivation of employees. With above goal of the research, quantitative research was conducted through sample survey method with the staffs working full time at Ha Tinh Viet - Lao Vung Ang Joint Stock Company. Researched data is used to test the hypotheses in the model. The study was conducted at Viet - Lao Vung Ang Joint Stock Company on 4th May 2015.
3.2 Sources of data
3.2.1 Primary data
Primary data is collected through questionnaire from the staffs of Viet - Lao Vung Ang Joint Stock Company. The author conducted a survey on people who related to organizational culture and work motivation of employees in the company.
3.2.2 Secondary data
Secondary data is reference related to the topic of corporate culture; organizational behavior of researchers, scholars around the world. Secondary data is mainly collected through internet.
3.3 Sampling
Overview: The participants in the study are staffs with much work, in different positions and now work full time in the company. The staffs that do freelance or part-time are excluded from the interviewee.
Size of sample: the selected size of sample will affect the reliability of the information. If the size of sample increases, the reliability of information will increase. However, it also
16
increases time, resources and cost. In contrast, if the size of sample is small, it is beneficial for cost, time to implement but reliability of information cannot be ensured.
Size of sample in this study was estimated at 150. To achieve the size n = 150, 200 questionnaires were sent to related people to collect data.
Sampling Method: Non-Probability and convenient, questionnaires were sent to the employees working in Viet - Lao Vung Ang Joint Stock Company.
3.4 Methods and tools of collecting data
3.4.1 Methods of data collection
Information and data are collected through the survey that based on designed questionnaires sent directly, by email or by friends, colleagues to employees working in Viet - Lao Vung Ang Joint Stock Company.
3.4.2 Tools of collecting data
Tool of collecting data is a questionnaire used to survey opinions of the subject, in which:
Types of questions are structured (closed) questionnaire with all kinds of listed questions and answers and selected people only need to choose, including: for question having two answers, choose one answer; for question having multiple answers, choose one; assess according to the listed marks.
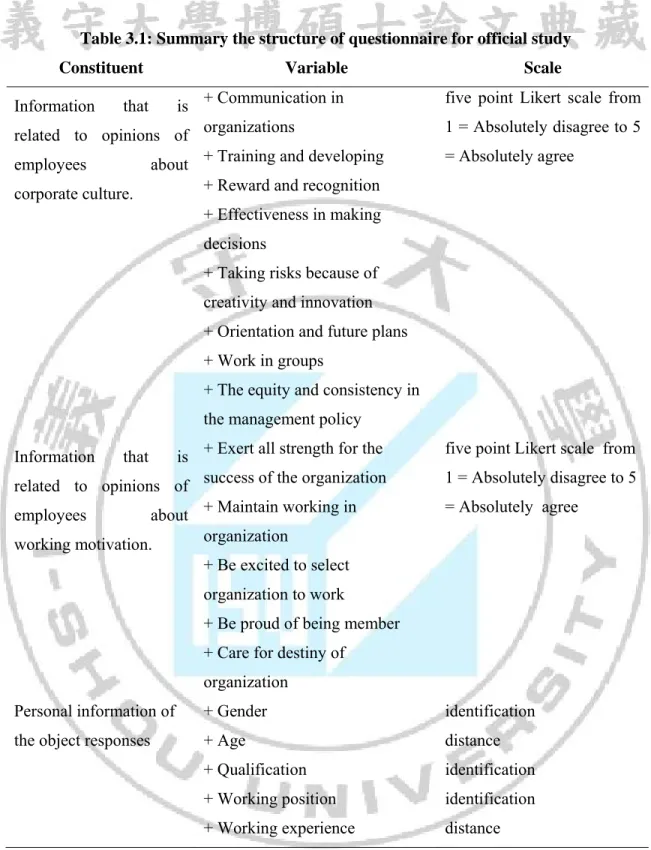
Content of questionnaire consists of three main parts:
Part 1: Designed to collect information that is related to opinions of employees about corporate culture.
Part 2: Designed to collect information that is related to opinions of employees about working motivation.
17
Table 3.1: Summary the structure of questionnaire for official study
Constituent Variable Scale
Information that is related to opinions of employees about corporate culture. + Communication in organizations
+ Training and developing + Reward and recognition + Effectiveness in making decisions
+ Taking risks because of creativity and innovation + Orientation and future plans + Work in groups
+ The equity and consistency in the management policy
five point Likert scale from 1 = Absolutely disagree to 5 = Absolutely agree Information that is related to opinions of employees about working motivation.
+ Exert all strength for the success of the organization + Maintain working in organization
+ Be excited to select organization to work
+ Be proud of being member + Care for destiny of
organization
five point Likert scale from 1 = Absolutely disagree to 5 = Absolutely agree
Personal information of the object responses
+ Gender + Age + Qualification + Working position + Working experience identification distance identification identification distance The stages of designing questionnaire:
The questionnaires were designed and tested through a number of stages to ensure that the collected information is reliable for data analysis process.
Phase 1: Design crude questionnaire based on information need to be collected in theoretical models and related studies.
18
Phase 2: Evaluate content of questionnaires by checking the level of understanding of the question, the assessment was done by sending directly to acquainted colleagues to know how they understand and answer.
Phase 3: Edit the content of the questions and complete the survey questionnaires, then process to send directly and through e-mail address to collect information.
The questions measuring aspects of corporate culture are based on a questionnaire of previous studies related to the field of culture.
The questions measuring working motivation of employees is based on the survey question of previous studies related to the field of working motivation.
3.5. Methods of processing data
Using software SPSS 20.0 to analyze the results of collected data.
For collected data, after completing the filtering, testing, coding, entering and cleaning, some methods for analyzing will be used in the study, as follows:
a) Descriptive analysis:
This analysis is a statistical analysis of the frequency to describe the attributes of the sample group such as: gender, age, education, working experience, working position.
b) Assess the reliability of the scale:
Using Crobach’s Alpha to check the reliability of the estimated parameters in the data packets in term of each element in the model. Variables that can not ensure the reliability will be excluded from the data set.
c) Factor analysis:
After excluding variables that do not ensure the reliability, validity is considered by analyzing EFA, KMO and Bartlett testing. Factor analysis is used to collapse the estimated parameters, identify the factors and prepare for the next analysis.
d) Analysis of the relationship:
To test the relationship between the culture of the company and the working motivation of employees in the research model, the author uses correlation with a correlation coefficient "Pearson correlation coefficient", which is denoted by the letter "r". Values are in the range -1 ≤ r ≤ 1.
I inverse relation T ⌠ ⌠ T linear co If r> 0, it correlation nship. 1: The 0: The The level o ⌠< 5%: fair ⌠< 1%: ver The next st orrelation o expresses c n. The value e relationshi e relationshi f significan rly tight cor ry tight corr tep, using a of the variab covariant co e r = 0 ind ip between ip between nce "sig" of t rrelation relation multiple lin bles in the m
19
orrelation. dicates thatthe two var
the two var the correlat near regress model. On the oth the two va riables is clo riables is we tion coeffici sion to dete her hand, if ariables doe osed eak ient: ermine the s f r <0, it e es not have significance xpresses a linear e and the
20
CHAPTER 4: RESULTS AND DISCUSSION
4.1 Introduction
Chapter 3 presents methods to carry out research and design survey questionnaire. The purpose of this chapter is to present the research results that are obtained through analysis and testing research models. This chapter consists of three parts:
- Clean and describe obtained sample and response rates - Analyze and assess measuring tools
- The results of hypothesis test
4.2 Clean and describe obtained sample
As discussed in Chapter 3, required size of sample is 150. The author sent 200 questionnaires and collected 150 samples; the expected response rate is 75%. In fact, there are 172 grossed questionnaires out of 200 sent questionnaires, so the response rate is 86%. Among 172 grossed questionnaires, there are 22 invalid samples due to lack of information and cannot used for the study. The reliable acquisition results are 150 samples used as research data.
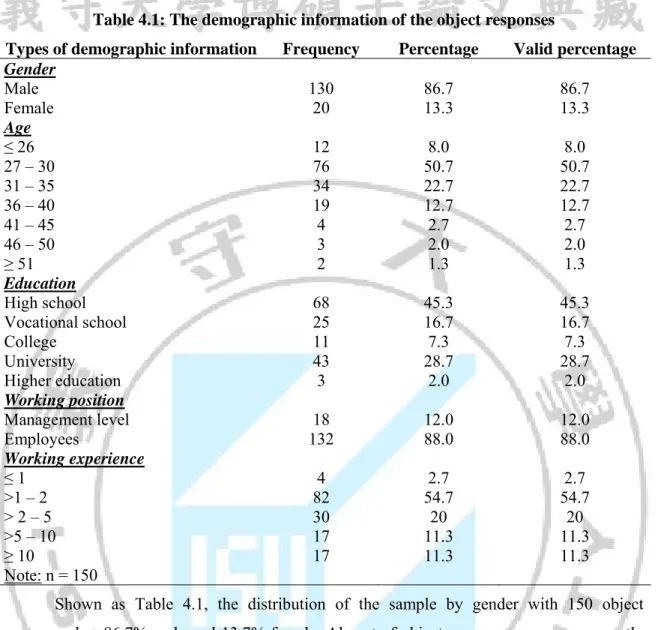
The objectives to collect data for research are all officials and employees working in Viet – Lao Vung Ang Port Join Stock Company. In 150 samples used for research, there are 18 people at the management level (account for 12%) and 132 employees (account for 88%). Table 4.1 describes in detail the demographic information of the object response related to the study based on frequency statistics and value of percentage. The demographic variables used in the study are gender, age, education, working position and working experience.
From the results obtained from using SPSS analysis, demographic information of the object response in the study as follows:
21
Table 4.1: The demographic information of the object responses
Types of demographic information Frequency Percentage Valid percentage
Gender Male 130 86.7 86.7 Female 20 13.3 13.3 Age ≤ 26 12 8.0 8.0 27 – 30 76 50.7 50.7 31 – 35 34 22.7 22.7 36 – 40 19 12.7 12.7 41 – 45 4 2.7 2.7 46 – 50 3 2.0 2.0 ≥ 51 2 1.3 1.3 Education High school 68 45.3 45.3 Vocational school 25 16.7 16.7 College 11 7.3 7.3 University 43 28.7 28.7 Higher education 3 2.0 2.0 Working position Management level 18 12.0 12.0 Employees 132 88.0 88.0 Working experience ≤ 1 4 2.7 2.7 >1 – 2 82 54.7 54.7 > 2 – 5 30 20 20 >5 – 10 17 11.3 11.3 ≥ 10 17 11.3 11.3 Note: n = 150
Shown as Table 4.1, the distribution of the sample by gender with 150 object responses has 86.7% male and 13.7% female. Almost of object responses are young, mostly in age of 27-30 years (account for 50.7%), age of 31-35 years ranks second position with 22.7%. The other level of age do not have high rate. Besides, the object responses do not have high education, majority of them are high school (account for 45.3%), rate of university graduates is 28.7%, rate of vocational school is 16.7%, 7.3% is the rate of college and higher education accounts for 2%. Moreover, in term of working experience, the staffs have work for 1 to 2 years account for 54.7%, the rate of staffs who have work for 2 to 5 years is 20% and the staffs have work for 5 to 10 years and over 10 years account for 11.3%. The rate of staffs working for under one year is small, just 2.7%.
4.3 Analysis and assess measuring tools
According to the research model listed in chapter 2, the organizational culture is defined under 8 aspects and measured as follows:
22
- Communication in organizations is measured by four observed variables, which are denoted from COMOG1 to COMOG4
- Training and developing is measured by four observed variables, which are denoted from Training1 to Training4
- Reward and recognition are measured by four observed variables, which are denoted from Gift1 to Gift4
- Effectiveness in making decisions is measured by four observed variables, which are denoted from Effect1 to Effect4
- Taking risks because of creativity and innovation is measured by four observed variables, which are denoted from Risk1 to Risk4
- Orientation and plans are measured by four observed variables, which are denoted from Plan1 to Plan4
- Work in groups is measured by four observed variables, which are denoted from Workgroup1 to Workgroup4
- The equity and consistency in the management policy are measured by four observed variables, which are denoted from Square1 to Square4
Meanwhile, working motivation is measured by 5 observed variables, which are denoted from Motivation1 to Motivation5.
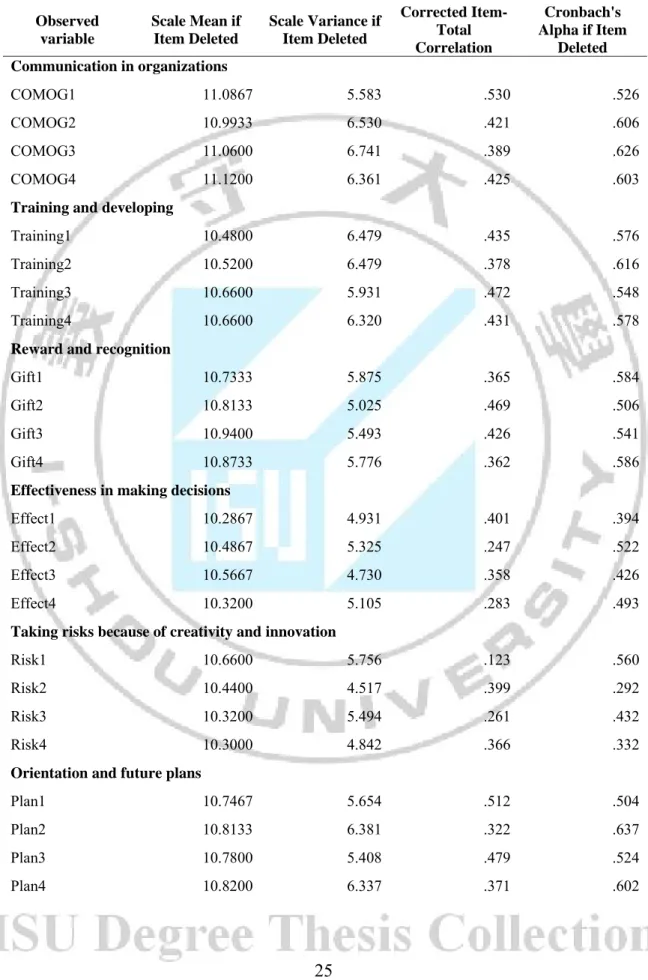
The author use Crobach’s Alpha to test the reliability of the observed variables in the obtained data packet by factor groups in model. This aims to find the correlation between the variables and the correlation coefficient between total scores and variables for a set of observed variables, then retain only variables that are correlated strongly with total points while remove variables that do not ensure the reliability in the scale.
According to Trong and Nguyet (2005), many researchers agree that when Crobach’s Alpha is from 0.8 to nearly 1, the measuring scale is good, from 0.7 to 0.8 is usable. For research, the scale measuring is acceptable when Crobach’s Alpha is 0.6 or higher. Moreover, correlation relationship with total variables is considered, only those variables having coefficient bigger than 0.4 are retained.
After removing variables that do not ensure reliability, implement factor analysis. The extracted coefficient method is extracted factor method with Varimax Procedure rotation and
23
the stop when extract factors having Eigenvalua is 1. The scale is accepted as the total variance equal to or greater than 50% (Gerbing & Anderson, 1988).
4.3.1 Crobach’s Alpha coefficient
4.3.1.1 The scale of organizational culture
Analysis results of Crobach’s Alpha about organizational culture is presented with the results as follows: (See details in Table 4.2)
Communication in organizations has Crobach’s Alpha at 0.66, which is not high. The observed variables in this component have correlation coefficients with total variables higher than 0.4 so this is a good measure.
Crobach’s Alpha of training and developing reaches 0.648. That is not high, the observed variables Training1, Training3 and Training4 have correlation coefficients with total variables higher than 0.4; except Training2 have very weak correlations with total variables (0.378) and when remove this variable out of the scale, Crobach’s Alpha reaches 0.616. So variable Training2 may be acceptable.
Reward and recognition have Crobach’s Alpha not high at 0.626; the observed variables Gift2 and Gift3 both have correlation coefficients with total variables higher than 0.4; while the observed variables Gift1 and Gift4 have correlation coefficients with total variables less than 0.4. If remove 2 observations out of the scale Crobach’s Alpha is only 0.504 less than 0.6. So we can accept variable Gift2 and Gift4 to ensure the Cronbach's Alpha coefficient greater than 0.6.
Effectiveness in making decisions has Crobach’s Alpha at 0.532, which is less than 0.6. Therefore, we remove this scale out of the study.
Taking risks because of creativity and innovation has Crobach’s Alpha reaching 0.485 less than 0.6. Therefore, we remove this scale out of the study.
Crobach’s Alpha of Orientation and plans is 0.639, greater than 0.6. The observed variables Plan1 and Plan3 both have correlation coefficients with total variables greater than 0.4; while the observed variables Plan2 and Plan4 have correlation coefficients with total variables less than 0.4. If remove 2 observations out of the scale Crobach’s Alpha is 0504 less than 0.6. So we can accept 2 observed variables to ensure Cronbach's Alpha coefficient greater than 0.6.
24
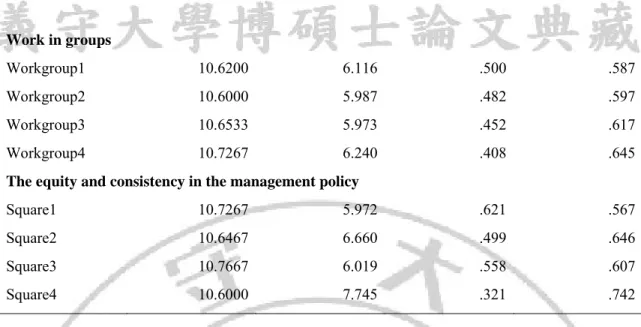
Work in groups has Crobach’s Alpha at 0.678, greater than 0.6. The observed variable in this component have correlation coefficients with total variables from 0.408 to 0.5. Therefore, this scale is acceptable.
The equity and consistency in the management policy has Crobach’s Alpha at a relatively high levels, reaches 0.710. The observed variables Square1, Square2 and Square3 have correlation coefficients with total variables greater than 0.4 turns while observed variable Square4 has correlation coefficients with total variables very weak at 0.321. Thus, when remove this variable from the scale Crobach’s Alpha is improved to reach 0.742. So observed variable Square4 is removed from the scale because it does not ensure reliability.
25
Table 4.2: Coefficient of Cronbach's Alpha reliability of the scale of the cultural aspects of organizations (N = 150) Observed variable Scale Mean if Item Deleted Scale Variance if Item Deleted Corrected Item-Total Correlation Cronbach's Alpha if Item Deleted Communication in organizations COMOG1 11.0867 5.583 .530 .526 COMOG2 10.9933 6.530 .421 .606 COMOG3 11.0600 6.741 .389 .626 COMOG4 11.1200 6.361 .425 .603
Training and developing
Training1 10.4800 6.479 .435 .576
Training2 10.5200 6.479 .378 .616
Training3 10.6600 5.931 .472 .548
Training4 10.6600 6.320 .431 .578
Reward and recognition
Gift1 10.7333 5.875 .365 .584
Gift2 10.8133 5.025 .469 .506
Gift3 10.9400 5.493 .426 .541
Gift4 10.8733 5.776 .362 .586
Effectiveness in making decisions
Effect1 10.2867 4.931 .401 .394
Effect2 10.4867 5.325 .247 .522
Effect3 10.5667 4.730 .358 .426
Effect4 10.3200 5.105 .283 .493
Taking risks because of creativity and innovation
Risk1 10.6600 5.756 .123 .560
Risk2 10.4400 4.517 .399 .292
Risk3 10.3200 5.494 .261 .432
Risk4 10.3000 4.842 .366 .332
Orientation and future plans
Plan1 10.7467 5.654 .512 .504
Plan2 10.8133 6.381 .322 .637
Plan3 10.7800 5.408 .479 .524
26
Work in groups Workgroup1 10.6200 6.116 .500 .587 Workgroup2 10.6000 5.987 .482 .597 Workgroup3 10.6533 5.973 .452 .617 Workgroup4 10.7267 6.240 .408 .645The equity and consistency in the management policy
Square1 10.7267 5.972 .621 .567
Square2 10.6467 6.660 .499 .646
Square3 10.7667 6.019 .558 .607
Square4 10.6000 7.745 .321 .742
Results after analysis Crobach’s Alpha coefficient and remove the variables that do not ensure the reliability, organizational culture is measured by 23 observed variables for 6 aspects of organizational culture (in the beginning it has 32 observed variables for 8 aspects). Number of observed variables and Crobach’s Alpha coefficient of 6 aspects of organizational culture are described in Table 4.3 as follows:
Table 4.3: Statistics of observed variables andCrobach’s Alpha coefficient of the scale organizational culture Aspects of organizational culture Initial observed variables Observed variables after removing InitialCronbach's Alpha Cronbach's Alpha after removing Note Communication in organizations 4 4 0.66 0.660
Training and developing 4 4 0.648 0.648
Reward and recognition 4 4 0.626 0.626
Effectiveness in making
decisions 4 0 0.532
Taking risks because of
creativity and innovation 4 0 0.485
Orientation and future plans 4 4 0.639 0.639
Work in groups 4 4 0.678 0.678
The equity and consistency
in the management policy 4 3 0.710 0.742
Remove Square4 In conclusion, Cronbach's Alpha coefficient of organizational cultures is from 0.626 to 0.742; reliability reaches allowed level (> 0.6) and the scales meet the standards to be used for research.
27
4.3.1.2 The scale of working motivation
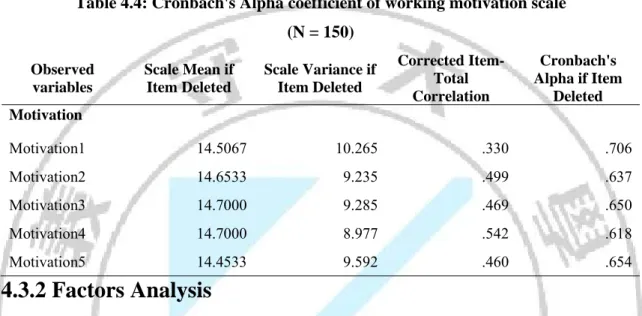
Crobach's Alpha coefficients of working motivation scale reaches 0.703; except variables Motivation1 has coefficient lower 0.4 (0.33), the others are greater than 0.4. So when remove variable Motivation1 out of the scale Cronbach's Alpha coefficient of the scale increases to 0.706. So Motivation1 variables will be excluded from the scale.
Table 4.4: Cronbach's Alpha coefficient of working motivation scale (N = 150) Observed variables Scale Mean if Item Deleted Scale Variance if Item Deleted Corrected Item-Total Correlation Cronbach's Alpha if Item Deleted Motivation Motivation1 14.5067 10.265 .330 .706 Motivation2 14.6533 9.235 .499 .637 Motivation3 14.7000 9.285 .469 .650 Motivation4 14.7000 8.977 .542 .618 Motivation5 14.4533 9.592 .460 .654
4.3.2 Factors Analysis
Factor analysis with Varimax rotation was conducted to identify factors for further analysis.According Hair & CTG (1998) factor analysis is a statistical method used to compact a set of many observed variables into a group so that they have more sense, but still contain most of the information content like the original variable.
According Hair & CTG (1998), Multivariate data analysis: Prentice-Hall International, in analyzing EFA indicators Factor loading having value greater than 0.5 is considered practical significance. KMO is indicator express the relevance of the EFA method, KMO coefficient greater than 0.5 and less than 1 is considered appropriate
4.3.2.1 The scale of organizational culture
After checking the level of reliability by using Cronbach's Alpha analysis, the scale of organizational culture is measured by 23 observed variables with 6 components of the scale. Factor analysis was used to assess the level of convergence of the observed variables follow the components.
H0 hypothesis posed in this analysis is among 23 observed variables in the overall, there is no correlation with each other. KMO and Barllet's inspection in factor analysis show that this hypothesis is rejected (Sig. = 0.000); KMO coefficient is 0.789 (> 0.5). This result
28
indicates that the observed variables in the overall have correlation relationship with each other and factor analysis (EFA) is appropriate.
Table 4.5: KMO and Barllet's inspection –the scale of organizational culture
KMO and Bartlett's Test
Kaiser-Meyer-Olkin Measure of Sampling Adequacy. .789
Bartlett's Test of Sphericity
Approx. Chi-Square 1216.445
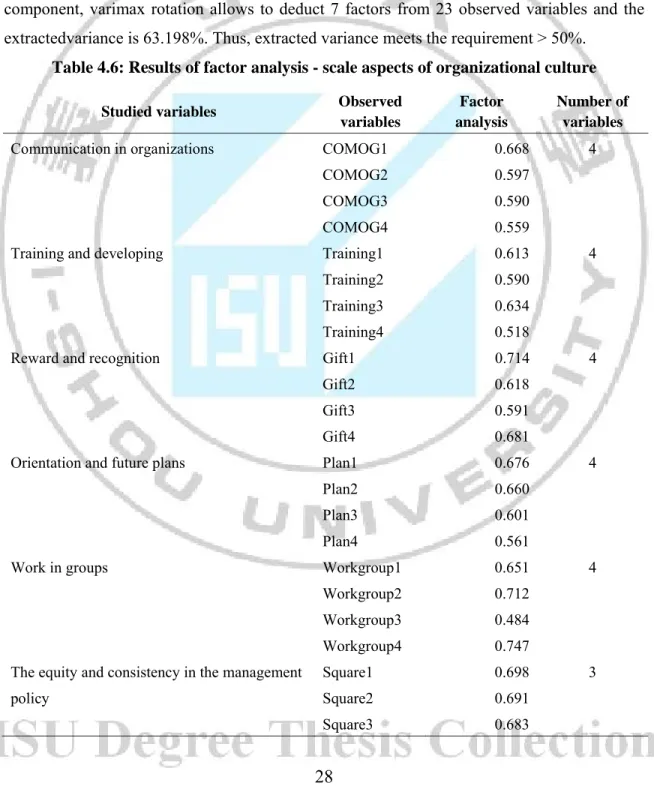
df 253 Sig. .000 Analysis result of EFA shows that at the value Eigenvalue = 1.088 with principal
component, varimax rotation allows to deduct 7 factors from 23 observed variables and the extractedvariance is 63.198%. Thus, extracted variance meets the requirement > 50%.
Table 4.6: Results of factor analysis - scale aspects of organizational culture Studied variables Observed
variables
Factor analysis
Number of variables
Communication in organizations COMOG1 0.668 4
COMOG2 0.597
COMOG3 0.590
COMOG4 0.559
Training and developing Training1 0.613 4
Training2 0.590
Training3 0.634
Training4 0.518
Reward and recognition Gift1 0.714 4
Gift2 0.618
Gift3 0.591
Gift4 0.681
Orientation and future plans Plan1 0.676 4
Plan2 0.660
Plan3 0.601
Plan4 0.561
Work in groups Workgroup1 0.651 4
Workgroup2 0.712
Workgroup3 0.484
Workgroup4 0.747
The equity and consistency in the management Square1 0.698 3
policy Square2 0.691
29
From the results of factor analysis of the scale of organizational culture, six factors are identified as follows: Communication in organizations (4 observed variables); Training and developing (4 observed variables); Reward and recognition (4 observed variables); Orientation and future plans (4 observed variables); Work in groups (4 observed variables); the equity and consistency in the management policy (3 observed variables). Thus, a model with 6 factors is suitable to introduce data.
4.3.2.2 The scale of working motivation
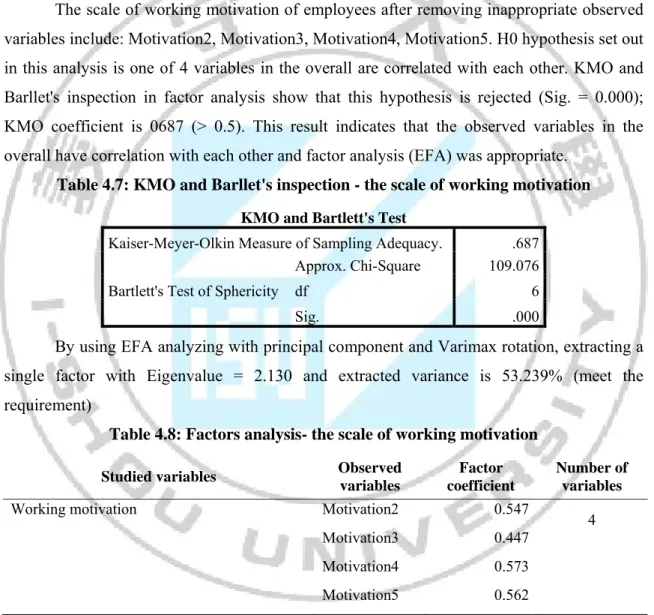
The scale of working motivation of employees after removing inappropriate observed variables include: Motivation2, Motivation3, Motivation4, Motivation5. H0 hypothesis set out in this analysis is one of 4 variables in the overall are correlated with each other. KMO and Barllet's inspection in factor analysis show that this hypothesis is rejected (Sig. = 0.000); KMO coefficient is 0687 (> 0.5). This result indicates that the observed variables in the overall have correlation with each other and factor analysis (EFA) was appropriate.
Table 4.7: KMO and Barllet's inspection - the scale of working motivation KMO and Bartlett's Test
Kaiser-Meyer-Olkin Measure of Sampling Adequacy. .687 Bartlett's Test of Sphericity
Approx. Chi-Square 109.076
df 6 Sig. .000 By using EFA analyzing with principal component and Varimax rotation, extracting a
single factor with Eigenvalue = 2.130 and extracted variance is 53.239% (meet the requirement)
Table 4.8: Factors analysis- the scale of working motivation Studied variables Observed
variables
Factor coefficient
Number of variables
Working motivation Motivation2 0.547
4
Motivation3 0.447
Motivation4 0.573
Motivation5 0.562
The results of factors analysis for the scale of working motivation is there is only one factor derived and designated as work motivation factors (including 4 observed variables).
30
4.4. Research Hypothesis Testing
Correlation analysis and multiple linear regressions were used to test the relationship between the independent variables (communication within the organization, training and developing, rewards and recognition,) and the dependent variable (motivation to work) in research models.
4.4.1. Analysis of the relationship between the variables
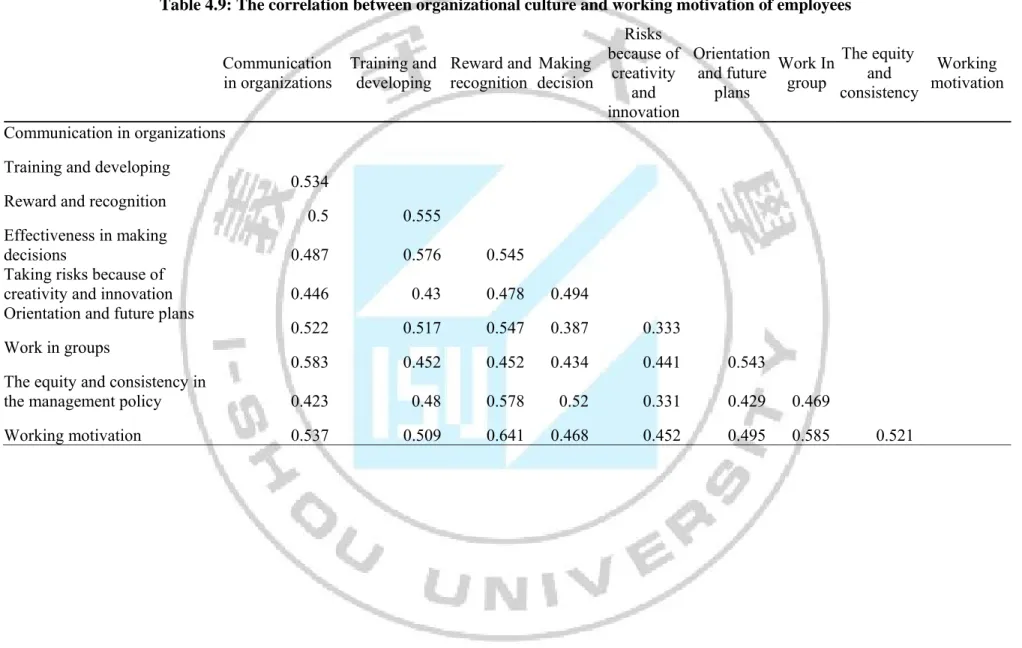
Correlation matrix in table 4.9 presents the Pearson correlation coefficient (r) between the study variables. Coefficient is considered to be significant if it has less than or equal 0.05. With p <0.01 should have correlation between all the independent variables listed in Table 4.9. In 20 covariant correlations, all the coefficients are greater than 0.3 and no correlation exceed 0.9. Thus, multicollinearity cannot be occurs - phenomenon among independent variables having closed correlation; thereby increase the standard deviation of the regression coefficients and reduce the t value in statistical significance tests.
In addition, the analysis also shows that there is correlation between the independent variables – organizational culture and independent variables – Working motivation of employees. First, Reward and recognition have closely covariant correlations with working motivation of employees (r = 0641, p <0.01); Next is working group (r = 0.585, p <0.01); and the covariant correlations at moderate level, specifically including relationships: Communication in organizations - working motivation of employees(r = 0.537, p <0.01), The equity and consistency in the management policy - working motivation of employees(r = 0.521, p <0.01), Training and developing - working motivation of employees(r = 0.509, p <0.01), orientation and Future plans - working motivation of employees(r = 0.495, p <0.01), Effectiveness in making decisions - working motivation of employees (r = 0.468, p <0.01), Taking risks because of creativity and innovation- working motivation of employees (r = 0.452, p <0.01). The results show that the objects responses have awareness that the positive value of organizational culture will positively influence working motivation of employees.
31
Table 4.9: The correlation between organizational culture and working motivation of employees
Communication in organizations Training and developing Reward and recognition Making decision Risks because of creativity and innovation Orientation and future plans Work In group The equity and consistency Working motivation Communication in organizations
Training and developing
0.534
Reward and recognition
0.5 0.555
Effectiveness in making
decisions 0.487 0.576 0.545
Taking risks because of
creativity and innovation 0.446 0.43 0.478 0.494
Orientation and future plans
0.522 0.517 0.547 0.387 0.333
Work in groups
0.583 0.452 0.452 0.434 0.441 0.543
The equity and consistency in
the management policy 0.423 0.48 0.578 0.52 0.331 0.429 0.469
32
4.4.2 Analysis of multiple linear regression
Method to analyze multiple linear regression with all the variables are included in the same time shows that the appropriate regression model is used to test the theoretical model (Sig. F = 0.000) and 52% unexplained differential variables depends - motivation of working motivation of employees (adjusted R2 = 0520)
Table 4.10: The determining factor model (model 1)
Model Summaryb
Model R R Square Adjusted R
Square
Std. Error of the Estimate
1 .739a .546 .520 .51415
a. Predictors: (Constant), Risk, Square, Plan, COMOG, Effect, Workgroup, Training, Gift
b. Dependent Variable: Motivation
Results of regression analysis show that only these elements, including: Reward and recognition, Working in group with significance p <0.05 (the reliability is 95%). Other factors, including communication within the organization, training and developing, Effectiveness in making decisions, The equity and consistency in the management policy, Orientation and future plans, they have no statistical significance in the analysis model (Sig. t> 0.05).
Table 4.11: Statistical analysis of the regression coefficients (model 1)
Coefficientsa
Model Unstandardized Coefficients
Standardized Coefficients
t Sig. Collinearity Statistics
B Std. Error Beta Tolerance VIF
1 (Constant) .369 .276 1.338 .183 COMOG .096 .074 .103 1.304 .194 .519 1.925 Training .064 .074 .069 .865 .389 .511 1.957 Gift .341 .083 .340 4.091 .000 .466 2.145 Plan .017 .074 .018 .231 .818 .544 1.838 Workgroup .246 .074 .258 3.313 .001 .529 1.890 Square .094 .069 .103 1.366 .174 .565 1.770 Effect -.013 .084 -.012 -.156 .876 .517 1.933 Risk .071 .075 .067 .940 .349 .641 1.560
a. Dependent Variable: Motivation
The model after reanalyzing will include 2 aspects: Reward and recognition, work in group. The result shows that the level consistent with the model is 51.40% (adjusted R2 =
33
0.514) and ingredients in models ensure statistical significance of the linear relationship (Sig. F = 0.00)
Table 4.12: The coefficient determining model (model 2)
Model Summaryb
Model R R Square Adjusted R
Square
Std. Error of the Estimate
1 .721a .520 .514 .51761
a. Predictors: (Constant), Workgroup, Gift b. Dependent Variable: Motivation
The regression coefficients of these two aspects of organizational culture are listed in the table 4.13, specifically rewards and recognition ( =0.473, p<0.05); teamwork ( =0.371, p<0.05) made positively influence to the motivation of staff.
Table 4.13: Statistical analysis of the regression coefficients (model 2)
Coefficientsa
Model Unstandardized Coefficients
Standardized Coefficients
t Sig. Collinearity Statistics
B Std. Error Beta Tolerance VIF
1
(Constant) .683 .239 2.862 .005
Gift .475 .064 .473 7.388 .000 .796 1.256
Workgroup .353 .061 .371 5.796 .000 .796 1.256
a. Dependent Variable: Motivation
Based on the results of correlation analysis and multiple linear regression, two aspects of organizational culture influence on linear work motivation of employees in the company are described in the model below
Figure 4.1: Results of linear correlation of the components in the model study
4.5 Discussion
From the analysis results shown in the above contents, the author comes to the following conclusions: the hypothesis H3 and H7 of models are acceptable. This means
Reward and recognition
Work in groups Working motivation of employees 0.473 0.371
34
aspects of organizational culture include reward and recognition and work in group have positive influence on working motivation of employees. When these factors increase, the level of commitments will increase. However, for the hypothesis H1, H2, H4, H5, H6, H8, with the analytical data packets can not have a sufficient basis to prove the relationships in linear model multivariate linear regression. Besides, this also can not say that the remaining elements (Communication within the organization, Training and developing , Effectiveness in making decisions, Taking risks because of creativity and innovation, Orientation and future plans, The equity and consistency in the management policy) has no effect on working motivation of employees or these aspects are not important. It is just simply due to insufficient data so it can not prove linear correlation between the independent variables and the dependent variable.
Therefore, it should be reviewed and compared in another study with many more observations. To explain this result, I think that the object responses are mostly workers with low levels of education, they have low knowledge and work in shift (account for 45.3% - approximately a hafl of sample). Besides, income from wages account for 70 - 80% total income of labors. Wages must be linked with the quantity and quality of labors. It must reflect the dedication of employees for businesses, reflect the real role and position of the employees. Then wages will stimulate employees work energetically with high sense of responsibility. In addition with the salary, the bonus is an important form of encouragement. People often say: "hundred coins of wages is not equal to one coin of bonus". Bonus is not only by material rewards but it can also be spirit rewards by giving compliments, or certificates... Bonus is not much but it is a tool for employers eager the commitment and sense of responsibility, frugality, efficiency and effectiveness. Therefore, the fact that they only appreciate 2 factors: Reward and recognition and work in group is reasonab with the practical situation of the Company as well as the majority of the company's Vietnam.
In conclusion, the research results also bring certain value for further studies related to the field of organizational behavior. Besides, it provides the basis for managers in the Viet-Lao Vung Ang Port Joint Stock Company to promote working motivation for the workers and employees of the Company.