The evolutionary landscape of the Mycobacterium
tuberculosis genome
Tai-Chun Wang1a, Feng-Chi Chen a, b, c*
aDivision of Biostatistics and Bioinformatics, Institute of Population Health Sciences, National Health Research Institutes, 35 Keyen Road, Zhunan, Miaoli County, 350 Taiwan
bDepartment of Biological Science and Technology, National Chiao-Tung University, Hsinchu, 300 Taiwan
cDepartment of Dentistry, China Medical University, Taichung, 404 Taiwan *Corresponding author
Email addresses:
TCW: taichun @ nhri.org.tw
Abstract
Mycobacterium tuberculosis is one of the most deadly human pathogens. The major
mechanism for the adaptations of M. tuberculosis is nucleotide substitution. Previous studies have relied on the nonsynonymous-to-synonymous substitution rate (dN/dS) ratio as a measurement of selective constraint based on the assumed selective
neutrality of synonymous substitutions. However, this assumption has been shown to be untrue in many cases. In this study, we used the substitution rate in intergenic regions (di) of the M. tuberculosis genome as the neutral reference, and conducted a genome-wide profiling for di, dS, and the rate of insertions/deletions (indel rate) as compared with the genome of M. canettii using a 50 Kb sliding window. We demonstrate significant variations in all of the three evolutionary measurements across the M. tuberculosis genome, even for regions in close vicinity. Furthermore, we identified a total of 233 genes with their dS deviating significantly from di within the same window. Interestingly, dS also varies significantly in some of the windows, indicating drastic changes in mutation rate and/or selection pressure within relatively short distances in the M. tuberculosis genome. Importantly, our results indicate that selection on synonymous substitutions is common in the M. tuberculosis genome. Therefore, the dN/dS ratio test must be applied carefully for measuring selection
Keywords: Mycobacterium tuberculosis, selection pressure, nonsynonymous substitution, synonymous substitution, neutral substitution rate
1. Introduction
Mycobacterium tuberculosis (MTB), the causing pathogen of one of the most
deadly diseases, claims millions of lives worldwide each year . The MTB complex (MTBC) belongs to the slow-growing sublineage of Mycobacteria. Based on the geographical characteristics, MTBC can be classified into six clusters, including such species as M. tuberculosis, M. bovis, M. africanum, M. microti, M. pinnipedii, and M.
canettii . Members in MTBC, including M. tuberculosis, M. bovis, M. africanum, and M. canetti, share 99.95% of their genomic sequences and a strictly clonal population
structure . Compared to more ancient species (e.g. M. marinum), MTBC has shorter but more virulent chromosomes .
Although most bacterial species acquire new genetic materials via horizontal gene transfer , it has been reported that this mechanism rarely occurs to MTBC genomes . Therefore, nucleotide substitution is a major mechanism for the emergence of M. tuberculosis pathogenesis. By comparing multiple MTBC genomes , Namouchi and colleagues indicated that MTBC genomes exhibit significant regional variations in the density of single nucleotide polymorphisms (SNPs) . This observation implies that MTBC genes at different genomic positions may be evolving at very different rates. However, the authors did not distinguish between coding and noncoding regions when calculating SNP densities. Their results thus cannot reflect the variations in SNP
density at selectively neutral sites.
Since the majority of the MTB genome is composed of coding sequences, genomic regions of high SNP density may harbor rapidly evolving genes. Some of these genes may be positively selected for their importance in the adaptations of MTBC to the human environments. Meanwhile, extremely conserved genes are likely to be essential for the survival and/or replication of the bacterium. These two groups of genes are good candidates of drug targets. However, an increase in evolutionary rate does not necessarily result from positive selection. An increase in mutation rate or relaxation of selective constraint can lead to the same result. An adequate reference for neutral substitution rate and a good measurement for selection pressure are thus required to infer the driver of the increased evolutionary rates in the genes of interest.
One commonly used test for natural selection is the ratio of nonsynonymous substitution rate (dN) to synonymous substitution rate (dS) (i.e., the dN / dS ratio) . In general, dN/dS > 1 indicates positive selection, and dN/dS < 1 is a sign of negative selection. However, this test is based on the assumption that synonymous substitutions are selectively neutral, which has been questioned particularly in unicellular organisms. It is known that synonymous substitutions may confer fitness effects by affecting the efficiency and/or accuracy of protein translation . An alternative neutral reference is the nucleotide substitution rate of intergenic regions
(di) because intergenic regions are usually free from selection pressure. Therefore, theoretically, by comparing the dS of a gene against the di of the neighboring intergenic region, we can infer whether the synonymous substitutions are selectively neutral or not, and determine whether we should use dN/dS as the measurement of selection. There are three possible scenarios in the comparison between dS and di. Firstly, if dS is approximately equal to di, synonymous substitutions are probably driven mainly by mutation. Alternatively, if dS is significantly lower than di, synonymous substitutions are likely to be negatively selected. Finally, if dS is significantly larger than di, synonymous substitutions are possibly driven by positive selection. In the latter two cases, dN/di should be used instead of dN/dS for measuring selection pressure on the gene of interest.
Here, we examine the variations in evolutionary rates in the genomes of multiple MTB strains and the selection pressures imposed on MTB genes. We would like to address the following questions: (1) how applicable is dN/dS in measuring selection pressure on MTB genes; (2) which MTB genes evolve significantly more rapidly or more slowly than the genome average in terms of, separately, dS, dN, and dN/dS; and (3) what is the major driving force that leads to the variations in evolutionary rates among genes.
insertions/deletions (indels) across the MTB genome, which suggests fluctuations in local mutation rate as a driving force of nucleotide substitutions. Furthermore, we found that synonymous substitutions in hundreds of MTB genes may be subject to negative or positive selection, indicating noticeable inapplicability of the dN/dS ratio test to the MTB genes. The molecular mechanisms and phenotypic consequences of the drastic variations in evolutionary rates in MTB genes are worth further investigations.
2. Materials and Methods
2.1. Datasets
The genomic sequences of thirteen strains of Mycobacteria (Table 1) were downloaded from the National Center for Biotechnology Information (NCBI) at http:// http://www.ncbi.nlm.nih.gov/. Except for M. marinum, all of these strains belong to the MTBC. Here, the genomes of M. marinum and M. canettii were used for comparisons with the other MTBC genomes for the calculation of evolutionary rates. The average G+C content is approximately 65% for all of the analyzed genomes.
2.2. Identification of orthologous genes
The gene annotations of the analyzed bacterial genomes were also retrieved from NCBI. The nucleotide sequences of the annotated genes were conceptually translated into peptide sequences, and input into orthoMCL with default parameters for
identification of orthologous genes between the analyzed species/strains. OrthoMCL identified 2,358 orthologous genes for the 13 analyzed Mycobacterial genomes. The peptide sequences of the identified orthologous genes were then aligned by using MUSCLE with default parameters, and then back-translated to nucleotide sequences for calculations of dN, dS, and the dN/dS ratio.
2.3. Measurements of local evolutionary rates
To analyze di and indel rate, we used Mauve 2.0 to align the nucleotide sequences of the 13 analyzed genomes. The gaps between alignment blocks were discarded. For the comparison between dS and di, we removed all of the noncoding RNAs from intergenic regions with reference to the annotations of SIPHT [16]. A 50-Kb non-overlapping sliding window was then used to delineate the aligned genomic regions for calculations of di and indel rate. Note that a window contains both genic and intergentic regions. The genic and intergenic regions were demarcated according to the NCBI annotations. dN and dS were calculated separately for each gene. The intergenic regions within each window were concatenated for the calculation of di. Therefore, for each window, we could obtain multiple dN and dS values (when there are multiple genes in a window), and a single di value. Of note, the genes that are located at the boundaries between windows were discarded. In addition, we trimmed
50 nucleotides from both ends of each alignment block to avoid potential alignment errors.
The Codeml module of PAML 4 was used to calculate dN and dS. The Baseml module of PAML was applied for the calculation of di. We also calculated the indel rate by analyzing the MAUVE alignment files using an in-house PERL script. The indel rate was defined as the total length of insertions and deletions divided by the length of the alignable sequence.
2.4. Identification of genes with exceptional evolutionary rates
Since M. tuberculosis H37Rv is genetically close to M. canettii, in many of the cases we observe zero values of dN, dS, or dN/dS when comparing orthologous genes between the two species. For each evolutionary measurement (dN, dS, or dN/dS), assume that the probability of a zero value is α. Then the distribution is a α: 1 - α mixture of a point probability mass at 0 and a log-normal distribution, which can be presented as:
where Φ is the function of normal distribution.
Based on this mixture probability distribution, the cut points for determining the outlier evolutionary measurements at 5% error rate should be adjusted by
Average evolutionary rate ± 2* standard deviation * (1-α)
Notably, the standard deviation should be calculated based on the non-zero values. Also note that, for the analysis of dN/dS, the genes with dS = 0 were removed. Hence, the sample size in this analysis was reduced, andαbecomes the proportion of
dN = 0 in this reduced set.
We then defined slow- and fast-evolving genes as those that have their evolutionary rates fall outside of two standard deviations (adjusted forα) from the average. The genes thus identified were then functionally analyzed with reference to the TubercuList (http://genolist.pasteur.fr/TubercuList/) .
2.5. Measurement of codon usage bias
In this study, we used codon adaptation index (CAI) as the measurement of codon usage bias for MTB genes. CAI can be calculated as follows:
, where
Here, fi is the frequency of a codon i and fj is the frequency of the synonymous codons for that amino acid.
3. Results and discussions
3.1. Significant variations in diand indel rate across the MTBC genomes
Genomic regions in close proximity generally have similar substitution rates. Meanwhile, recombination events may divide neighbouring genomic regions into different “linkage blocks”, between which nucleotide substitution rates can differ significantly. However, if recombination events occur frequently at very small intervals (e.g., tens of base pairs), the genome would become “homogenized”, and the linkage blocks would be too small to be meaningful for large-scale studies. For the MTBC genomes, this seems to be the case according to Namouchi et al.’s recent report . By analyzing SNPs in the MTBC genomes, Namouchi and colleagues inferred that the average size of recombination DNA segments in these genomes is about 50~58 Bp in length, and that recombination events occur at one-fifth the frequency of mutations, which is far more frequent than previously known . In other words, the MTBC genomes are frequently “scrambled” so that larger-scale regional variations in nucleotide substitution rates may simply reflect variations in background mutation rate and/or selection pressure. Therefore, by applying an adequate-sized widow to the genomic sequences of MTBC, we can obtain dS, dN, and di for comparison and for inferences of selection pressure on the genes in the window. To this end, we first
aligned eleven MTBC genomes (Table 1) against the M. canettii genome by using MAUVE . We selected M. canettii because it is the closest outgroup species to the major pathogenic strains of M. tuberculosis, M. bovis, and M. africanum (the M.
marinum genome is applied in a latter analysis). We then used a non-overlapping
sliding window to examine the variations in evolutionary rates between M. canettii and each of the eleven MTBC genomes. Of note, a window must be large enough to include sufficient intergenic sequences for the calculation of di. We tested several different sizes (5Kb, 10Kb, 25Kb, 50Kb, 75Kb, and 100Kb), and determined 50 Kb to be the most suitable window size for the purpose of this study. Since the MTBC genomes are approximately 4.4 Mb in length, there are a total of 88 windows for each genome.
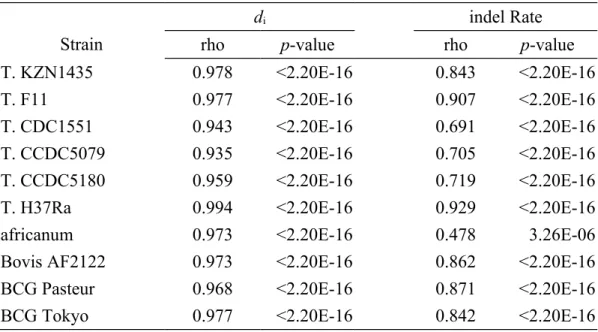
We first examined the variations in di across the MTBC genomes. As shown in Fig. 1, di fluctuates considerably in the MTBC genomes, ranging from zero to ~0.18. Interestingly, the genomic profiles of di are almost identical among the MTBC strains (Table 2), which reflects the shared evolutionary histories and the small genetic distances among the analyzed genomes. Meanwhile, indel rate (defined as the total length of the identified indels divided by the alignable sequence length) also varies dramatically across the MTBC genomes (Fig. 2). Nevertheless, the profiles of indel rates are less similar among the strains as compared with di (Table 2). There are
several potential reasons for the decreased similarity among the profiles of indel rate. One explanation is potential alignment errors, which may have led to false identification of indels. Of note, we actually trimmed 50 Bp from both ends of each alignment block to reduce this possible source of error. Another possibility is genome assembly errors, which may also artificially increase indel rates . The third possible reason is the presence of low-complexity sequences, which might occur at different frequencies in the MTBC genomes, and lead to regional variations in indel rate. Of course, we cannot exclude the possibility that such variations in indel rate have reflected the high frequency of genomic rearrangements in the MTBC genomes, as reported previously .
Next, we are interested in comparing different evolutionary measurements (di, dS, and indel rate) in the same windows, and see whether they exhibit similar genomic profiles. Since the profiles of di are almost identical among different MTBC genomes, for simplicity, we use only the M. tuberculosis H37Rv genome for subsequent analyses.
3.2. Selection on synonymous substitutions in the genome of M. tuberculosis H37Rv
By comparing di, dS, and indel rate in the same windows, we may be able to better understand the driving force of MTB genome evolution. Here d in each
window is used as the neutral reference because intergenic regions should be free from selection pressure in most of the cases. Of note, annotated nocoding RNAs were removed from the intergenic sequences to avoid biased estimations of di in this analysis (see Materials and Methods). Fig. 3 shows the genomic landscape for dS, di and indel rate for the H37Rv strain as compared against the M. canettii genome. Apparently, the profiles of the three evolutionary measurements are similar to one another. For instance, in windows # 19, 22, 63, 68 and 82, dS, di and indel rate all increase remarkably as compared with the neighbouring windows. These windows may harbor recombination hotsopts, which can significantly increase both mutation rate and indel rate. Meanwhile, windows with a relatively high indel rate but low dS and di are also observed (e.g. windows # 49~55). However, the pair-wise Spearman’s correlations between the three evolutionary measurements are statistically insignificant (p-value > 0.05 in all three pair-wise comparisons), indicating non-mutation forces (e.g., selection) may have differentially affected different windows. Also noticeable is that dS, di and indel rate may differ by more than ten folds even for two adjacent windows (e.g. windows # 63 and 64). This is actually consistent with the previous observation that the recombination DNA tracts are fairly short, so that physically close windows may have very different recombination rates (and very different d , d and indel rate). It is thus of interest to use a smaller window size for a
better resolution of the variations in evolutionary rates. However, when we use a 5Kb window size for this purpose, the total length of intergenic region in each window is too short (e.g. shorter than 100 Bp) for a reliable estimation for di.
Of note, in more than half of the windows, the average dS is larger than di. This is unexpected because synonymous substitutions are supposed to be nearly neutral or negatively selected in most of the cases. We then examined whether significant variations in dS exist in the same windows, which can bias the average dS upwards in the presence of exceptionally large dS values. If this is the case, the average dS will be larger than the median dS, which is actually observed in 86% of the 88 windows (Fig. 4). Nevertheless, even if we replace the average dS with the median dS for each of the window, about 40% of all the windows still have their dS larger than di (data not shown). One possible explanation for this observation is that di is underestimated in these windows because the intergenic regions include yet unidentified regulatory elements (although we have removed noncoding RNAs from the intergenic regions). Alternatively, the synonymous substitutions in the high-dS genes may be subject to positive selection for enhancing translational efficiency, or for regulatory reasons related to the secondary structures of mRNAs and/or the binding of noncoding RNAs.
Next, we used the Chi-square test to examine for each gene whether dS is significantly smaller (dS << di) or larger (dS >> di) than di in the same window. We
found a total of 114 and 119 genes, respectively, that have their dS significantly smaller or larger than di. Interestingly, these two types of genes occasionally co-occur in the same window. This observation suggests that dS varies to a large extent even within a relatively small distance (i.e. 50 Kb).
One possible explanation for the deviation of dS from di is to achieve better translational efficiency. Hence, we examined the codon usage biases (measured by the codon adaptation index, CAI) for known (non-hypothetical) genes, and compared the CAIs between dS ~= di genes and dS ≠ di genes. Fig. 5 shows that the median CAI is the highest in the genes with dS << di, followed by genes with dS >> di, and lastly by genes with dS ~= di. However, only the difference between dS << di genes and dS ~= di genes is statistically significant (p-value < 0.05 by Wilcoxon Rank Sum test). Interestingly, if we conducted the same analysis while adding all of the noncoding RNA back to the intergenic regions, all of the pair-wise differences in CAI between different gene groups are statistically significant (Supplementary Fig. 1; p-value < 0.05 by Wilcoxon Rank Sum test). For the genes that have their dS deviate significantly from di, the dN/dS ratio test may be inappropriate for measuring selection pressure. The genes with their dN/dS deviating significantly from dN/di are listed in Supplementary Table 1.
3.3. Identification of conserved and rapidly evolving genes in M. tuberculosis H37Rv
One important issue in the development of tuberculosis therapeutics is the identification of drug target genes. As stated previously, both conserved genes and rapidly evolving genes may be good candidates in this regard. Therefore, we compared the M. tuberculosis H37Rv genes with their one-to-one orthologues (as identified by orthoMCL) in M. canetti and M. marinum, respectively, for the identification of conserved and rapidly evolving genes. A total of 2,761
H37Rv-canettii-marinum orthologous gene sets were thus analyzed. We then define
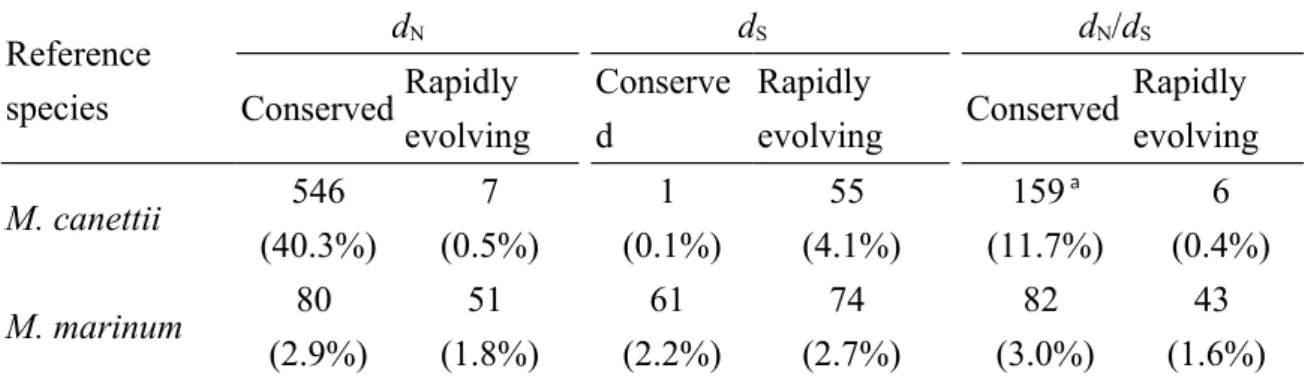
conserved and rapidly evolving genes as those that have their evolutionary rates fall outside of two standard deviations from the average (see Materials and Methods). We conducted this analysis separately for dS, dN, and dN/dS. Since the evolutionary rates may occasionally be zero (especially for dN), we used a mixture distribution of zero and log-normal distribution for each evolutionary measurement for this analysis (see Materials and Methods). It is noteworthy that, for the analysis of dN/dS, we removed those genes whose dS deviates significantly from di of the same window. However, we cannot evaluate the deviation of dS from di in the comparison between M. tuberculosis H37Rv and M. marinum because the alignable intergenic regions are too short and fragmented for reliable estimations of di. Table 3 shows that 40.3%, 0.1%, and 11.7% of M. tuberculosis H37Rv genes have their dN, dS, and dN/dS, respectively,
significantly lower than the genome average when compared against the M. canettii genes. Meanwhile, the corresponding numbers are 2.9%, 2.2%, and 3.0%, respectively, in the comparison against M. marinum genes. The most possible explanation for such differences in the percentage of conserved genes is the short divergence time between M. tuberculosis and M. canettii . This short time span is insufficient for nucleotide substitutions to accumulate, thus leading to low dN and dS values and lack of resolution in this analysis. The low dN and dS values in the
M.tuberculosis–M. canettii comparison also render the estimations of dN/dS unreliable. By comparison, the small percentage (~3%) of genes conserved between M.
tuberculosis and M. marinum are likely to be responsible for fundamental biological
functions of Mycobacteria. These genes thus may serve as candidate drug targets. Meanwhile, we observed fewer rapidly evolving genes than conserved genes in terms of dN/dS in both sets of pair-wise comparisons. These high-dN/dS genes are subject either to positive selection or relaxed negative selection. In the former case, these genes may be related to the adaptations of MTBC to the human environments. While in the latter case, the genes are biologically unimportant for MTBC, and may become pseudogenes afterwards. The gene IDs and the functional categories of the conserved and rapidly evolving genes in the H37Rv-marinum comparison are given in the Supplementary Tables 2 and 3.
3.4. Conclusions
In this study, we conducted a genome-wide analysis of dS, dN, dN/ds,, di, and indel rate for MTB. We discovered significant fluctuations in all of these evolutionary rates, suggesting large variations in regional mutation rate and selection pressure across the MTB genome. We also showed that a considerable proportion of the synonymous substitutions are subject to natural selection, possibly for enhancing translational efficiency or for other regulatory reasons. The large number of genes with their dS deviating from selective neutrality thus calls for caution in the application of the dN/dS ratio as a measurement for selection pressure on M. tuberculosis genes.
Acknowledgement
This study was supported by the National Science Council, Taiwan (under contract number NSC100-3111-B-400-001) and the intramural funding of National Health Research Institutes (PH101-SP-04) to F.-C. Chen. We thank Dr. Pei-Sheng Lin and Dr. Wen-Chang Wang for statistical advice.
References
1. Albers CA, Lunter G, MacArthur DG, McVean G, Ouwehand WH, Durbin R: Dindel: accurate indel calls from short-read data. Genome research 2011, 21(6):961-973.
2. Darling AC, Mau B, Blattner FR, Perna NT: Mauve: multiple alignment of conserved genomic sequence with rearrangements. Genome research 2004, 14(7):1394-1403.
3. Edgar RC: MUSCLE: a multiple sequence alignment method with reduced time and space complexity. BMC bioinformatics 2004, 5:113.
4. Falush D: Toward the use of genomics to study microevolutionary change in bacteria. PLoS genetics 2009, 5(10):e1000627.
5. Filliol I, Motiwala AS, Cavatore M, Qi W, Hazbon MH, Bobadilla del Valle M, Fyfe J, Garcia-Garcia L, Rastogi N, Sola C et al: Global phylogeny of Mycobacterium tuberculosis based on single nucleotide polymorphism (SNP) analysis: insights into tuberculosis evolution, phylogenetic accuracy of other DNA fingerprinting systems, and recommendations for a
minimal standard SNP set. Journal of bacteriology 2006, 188(2):759-772. 6. Gagneux S, DeRiemer K, Van T, Kato-Maeda M, de Jong BC, Narayanan S,
compatibility in Mycobacterium tuberculosis. Proceedings of the National
Academy of Sciences of the United States of America 2006, 103(8):2869-2873.
7. Gutacker MM, Mathema B, Soini H, Shashkina E, Kreiswirth BN, Graviss EA, Musser JM: Single-nucleotide polymorphism-based population genetic analysis of Mycobacterium tuberculosis strains from 4 geographic sites.
The Journal of infectious diseases 2006, 193(1):121-128.
8. Gutierrez MC, Brisse S, Brosch R, Fabre M, Omais B, Marmiesse M, Supply P, Vincent V: Ancient origin and gene mosaicism of the progenitor of Mycobacterium tuberculosis. PLoS pathogens 2005, 1(1):e5.
9. Kryazhimskiy S, Plotkin JB: The population genetics of dN/dS. PLoS
genetics 2008, 4(12):e1000304.
10. Lew JM, Kapopoulou A, Jones LM, Cole ST: TubercuList--10 years after.
Tuberculosis (Edinb) 2011, 91(1):1-7.
11. Li L, Stoeckert CJ, Jr., Roos DS: OrthoMCL: identification of ortholog groups for eukaryotic genomes. Genome research 2003, 13(9):2178-2189. 12. Mokrousov I, Narvskaya O, Limeschenko E, Vyazovaya A, Otten T,
Vyshnevskiy B: Analysis of the allelic diversity of the mycobacterial interspersed repetitive units in Mycobacterium tuberculosis strains of the Beijing family: practical implications and evolutionary considerations.
13. Namouchi A, Didelot X, Schock U, Gicquel B, Rocha EP: After the bottleneck: Genome-wide diversification of the Mycobacterium
tuberculosis complex by mutation, recombination, and natural selection.
Genome research 2012, 22(4):721-734.
14. Schurch AC, van Soolingen D: DNA fingerprinting of Mycobacterium tuberculosis: from phage typing to whole-genome sequencing. Infection,
genetics and evolution : journal of molecular epidemiology and evolutionary genetics in infectious diseases 2012, 12(4):602-609.
15. Sharp PM, Li WH: The codon Adaptation Index--a measure of directional synonymous codon usage bias, and its potential applications. Nucleic acids
research 1987, 15(3):1281-1295.
16. SIPHT Web Interface: http://newbio.cs.wisc.edu/sRNA/. Accessed on September 2012.
17. Smith NH, Hewinson RG, Kremer K, Brosch R, Gordon SV: Myths and misconceptions: the origin and evolution of Mycobacterium tuberculosis.
Nature reviews Microbiology 2009, 7(7):537-544.
18. Thomas CM, Nielsen KM: Mechanisms of, and barriers to, horizontal gene transfer between bacteria. Nature reviews Microbiology 2005, 3(9):711-721.
19. Toll-Riera M, Laurie S, Alba MM: Lineage-specific variation in intensity of natural selection in mammals. Molecular biology and evolution 2011, 28(1):383-398.
20. Veyrier F, Pletzer D, Turenne C, Behr MA: Phylogenetic detection of horizontal gene transfer during the step-wise genesis of Mycobacterium tuberculosis. BMC evolutionary biology 2009, 9:196.
21. Veyrier FJ, Dufort A, Behr MA: The rise and fall of the Mycobacterium tuberculosis genome. Trends in microbiology 2011, 19(4):156-161. 22. Yang Z: PAML 4: phylogenetic analysis by maximum likelihood.
Molecular biology and evolution 2007, 24(8):1586-1591.
23. Zhang Y, Zhang H, Zhou T, Zhong Y, Jin Q: Genes under positive selection in Mycobacterium tuberculosis. Computational biology and chemistry 2011, 35(5):319-322.
Figures
Figure 1 - The genomic landscape of di for eleven Mycobacterial genomes as
compared with M. canetti.
Figure 2 - The genomic landscape of indel rate for eleven Mycobacterial genomes as compared with M. canetti.
Figure 3 - The genomic landscape of dS, di and indel rate of M. tuberculosis H37Rv as compared with M. canetti
Figure 4 - Comparison between average dS and median dS in the case of M. tb. H37Rv Vs. M. canetti.
Figure 5 - The codon adaptation index (CAI) of three different groups of M.
tuberculosis H37Rv genes (dS ~= di , dS >> di, and dS << di). Note that only
known genes are included in this analysis.
Tables
Table 1 - The genomes analyzed in this study
RefSeq # Strain Length # Annotated
Genes MTB
complex
NC_015758 Mycobacterium africanum GM041182 4389314 3983 NC_002945 Mycobacterium bovis AF2122/97 4345492 4001 NC_008769 Mycobacterium bovis BCG str. Pasteur
1173P2
4374522 4033
NC_012207 Mycobacterium bovis BCG str. Tokyo 172 4371711 4027 CP001641 Mycobacterium tuberculosis CCDC5079 4398812 3696 CP001642 Mycobacterium tuberculosis CCDC5180 4405981 3639 NC_002755 Mycobacterium tuberculosis CDC1551 4403837 4293 NC_000962 Mycobacterium tuberculosis H37Rv 4411532 4047 NC_009525 Mycobacterium tuberculosis H37Ra 4419977 4084 NC_009565 Mycobacterium tuberculosis F11 4424435 3998 NC_012943 Mycobacterium tuberculosis KZN 1435 4398250 4107 Non-MTB
complex
NC_015848 Mycobacterium canettii CIPT 140010059 4482059 3982
NC_010612 Mycobacterium marinum M 6636827 5541
Table 2 - Spearman’s correlation test for di and indel rate between M. tuberculosis H37Rv and other MTBC strains
Strain
di indel Rate
rho p-value rho p-value
T. KZN1435 0.978 <2.20E-16 0.843 <2.20E-16
T. F11 0.977 <2.20E-16 0.907 <2.20E-16
T. CDC1551 0.943 <2.20E-16 0.691 <2.20E-16
T. CCDC5079 0.935 <2.20E-16 0.705 <2.20E-16
T. CCDC5180 0.959 <2.20E-16 0.719 <2.20E-16
T. H37Ra 0.994 <2.20E-16 0.929 <2.20E-16
africanum 0.973 <2.20E-16 0.478 3.26E-06
Bovis AF2122 0.973 <2.20E-16 0.862 <2.20E-16
BCG Pasteur 0.968 <2.20E-16 0.871 <2.20E-16
Table 3 - The numbers (percentages) of conserved and rapidly evolving genes in M. tuberculosis H37Rv Reference species dN dS dN/dS ConservedRapidly evolving Conserve d Rapidly evolving Conserved Rapidly evolving M. canettii 546 (40.3%) 7 (0.5%) 1 (0.1%) 55 (4.1%) 159 a (11.7%) 6 (0.4%) M. marinum 80 (2.9%) 51 (1.8%) 61 (2.2%) 74 (2.7%) 82 (3.0%) 43 (1.6%) a Note that the number of genes in the analysis of H37Rv-canettii d
N/dS is 1,048 because the genes with
dS = 0 were excluded. In all of the other cells in this table, the number of analyzed genes is 2,761 and
1,356 in M. marinum and M. canettii, respectively.
…
Supplementary Information
Supplementary Figure 1 - The codon adaptation index (CAI) of M. tuberculosis H37Rv genes. Note that in this figure, the di values were re-evaluated by adding all of the known noncoding RNAs back to the analyzed intergenic regions. Supplementary Table 1 – The list of M. tuberculosis H37Rv genes of which dN/dS
deviates significantly from dN/di when compared against the M. canettii
orthologues.
Supplementary Table 2 –The list and functional classification of rapidly evolving genes in M. tuberculosis H37Rv as compared with M. marinum. Supplementary Table 3 –The list and functional classification of conserved genes in M. tuberculosis H37Rv as compared with M. marinum..