行政院國家科學委員會專題研究計畫 成果報告
生醫電訊號之互補式金氧半積體電路設計
計畫類別: 個別型計畫
計畫編號:
NSC91-2213-E-039-002-執行期間: 91 年 08 月 01 日至 92 年 07 月 31 日
執行單位: 中國醫藥大學學士後中醫系
計畫主持人: 林育德
計畫參與人員: 李皖琦 劉芸澧 林東龍 徐雍智
報告類型: 精簡報告
處理方式: 本計畫可公開查詢
中
華
民
國 92 年 9 月 8 日
行政院國家科學委員會補助專題研究計畫成果
報告
※※※※※※※※※※※※※※※※※※※※※※※
※※
※
※
※ 生醫電訊號之互補式金氧半積體電路設計 (I)
※
※
CMOS integrated circuit design for biopotential amplifier (I)
※
※
※
※※※※※※※※※※※※※※※※※※※※※※※
※※
計畫類別:█個別型計畫
□整合型計畫
計畫編號:NSC 91-2213-E-039-002-
執行期間:91 年 8 月 1 日至 92 年 7 月 31 日
計畫主持人:林育德
本成果報告包括以下應繳交之附件:
□赴國外出差或研習心得報告一份
□赴大陸地區出差或研習心得報告一份
□出席國際學術會議心得報告及發表之論文各一份
□國際合作研究計畫國外研究報告書一份
執行單位:中國醫藥學院 學士後中醫系
中
華
民
國 92 年 9 月 4 日
行政院國家科學委員會專題研究計畫成果報告
生醫電訊號之互補式金氧半積體電路設計 (I)
CMOS integrated circuit design for biopotential amplifier (I)
計畫編號:NSC 91-2213-E-039-002
執行期限:91 年 8 月 1 日至 92 年 7 月 31 日
主持人:林育德 逢甲大學 自動控制工程學系
Email:
[email protected]
TEL: (04) 2451-7250 ext 3925
一、中文摘要
生醫電信號之種類很多,這些信號在醫
學臨床和基礎研究上均非常重要。欲量測
這些信號,必需有生醫電信號放大器的協
助才行,但是生醫電信號的振幅與頻率範
圍各異,而且生醫電信號相當微弱,在量
測生醫電信號時,容易受到干擾而影響信
號品質。所以欲設計符合需求之高品質生
醫電信號放大器,需要對干擾的產生機
制、電極特性與信號的特性充分了解,因
此,這類放大器的設計往往需要豐富的設
計經驗。為使設計更具效率,最好的辦法
就是藉由功能強大之電腦輔助設計工具的
協助,設計與模擬均在此工具中完成,如
此可節省開發時間和成本。本研究為了達
成此一目標,在本年度的執行進度中,首
先是提出了包含模擬生醫電信號產生源、
實際等效電路的皮膚電極阻抗以及模擬外
在干擾的生醫電信號量測的 Spice 模擬模
型,為了驗證此模型是否合理,本研究利
用此模型設計一個心電信號的放大器,比
較此放大器的模擬特性和實際特性,以及
心電信號放大的模擬結果和實際量測結
果,結果是放大器的模擬特性和實際電路
的特性相差無幾,而且對於生醫電信號量
測常遭遇到的電源干擾可以合理地反映出
其所受之影響。由於心電信號具有 QRS
波,驗證容易,所以本研究舉此為例,同
樣的模型原理也可以應用到其它的生醫電
信號的量測上。
關鍵詞:生醫電信號放大器、電腦輔助設
計、皮膚電極阻抗、心電信號、電源干擾、
Spice、QRS 波
Abstr actA special circuit named as biopotential amplifier is needed for measuring specific bioelectric signal. The magnitude and frequency range differ for different biopotential signals. Besides, biopotential signals are tiny in amplitude and the measurement is easily corrupted by external interference. For these reasons, the design of high-quality biopotential amplifier is usually an empirical task. To make the design more efficient, this study proposes a simulation model for bioelectric signal measurement such that the design of biopotential amplifier can be achieved by powerful computer-aided design (CAD) tool, where few studies have reported on such a topic. The proposed model is based upon previously published literatures with two distinct features added. The first feature is the genesis methodology of simulated biopotential signal. The second one is the skin-electrode impedance is replaced by the corresponding equivalent circuit of a complex RC network. To verify the feasibility of the proposed model, an ECG amplifier (in three-electrode/non-isolated configuration) is designed in Spice-related CAD tool and is implemented for ECG recording. From the results, the amplifier characteristics agree well between the simulated and the implemented circuit. Besides, the effect due to the commonly
encountered power-line interference during biopotential measure- ment can be reasonably evaluated in the proposed model. In this study, the model for ECG signal is selected for the distinguished feature of QRS complex, which will make the result verification easier. The same principle can be applied to the other kind of bioelectric signals and configuration modes.
Keywords:
biopotential
amplifier,
computer-aided
design
(CAD),
skin-electrode impedance, Spice, power-line
interference
1. Intr oduction
Bioelectric
signals
are
of
clinical
importance. These signals are tiny in
amplitude and usually may be disturbed by
external interference. A specialized amplifier
named as biopotential amplifier is needed for
the measurement of such signals. The design
criteria for such amplifier have been
discussed extensively in some literatures
(METTINGVANRIJN
et
al.,
1991;
NEUMAN, 1992b; METTINGVANRIJN et
al., 1994). As described in these studies,
much attention should be paid for the design
of such amplifier, and the designers should
be aware of the mechanisms of external
interference. Much work has been conducted
on the effects of external interference,
especially
the
commonly
encountered
power-line interference, during biopotential
measurement and the methods for reducing
such effects (HUHTA and WEBSTER, 1973;
WINTER and WEBSTER, 1983a; 1983b;
PALLÁ S-
ARENY,
1986;
1988;
METTINGVANRIJN et al., 1990; WOOD et
al., 1995; SPINELLI, 1999).
However, little research has been done on
the
computer-aided
design
(CAD)
of
biopotential
amplifier.
This
issue
is
extraordinarily
important
for
specific
applications in which commercial products
may be too bulky and expensive, such as
remote monitoring of vital signals and
wearable technology for healthcare (PARK
and JAYARAMAN, 2003). With the aid of
powerful circuit analysis software, e.g. Spice,
the task of amplifier design will be much
easier. To attain the goal of CAD for
biopotential amplifier, it is necessary to
establish a model that can generate simulated
biopotential signal and can simulate the
practical measurement conditions where the
complex skin-electrode impedance and the
effects due to nearby power lines should be
included. Using this model, the designer can
estimate the performance of the amplifier and
evaluate
the
influence
of
external
interference in circuit simulation package.
The development time can thus be saved and
the probability of design error can also be
reduced by this approach. The objective of
this paper is to propose a Spice model
owning the properties mentioned above, and
we also use this model to design a
three-electrode/non-isolated
electrocardiogram (ECG) amplifier. There is
a high level of agreement between the
simulation and practical measurement results
for both general and severer power-line
interference conditions. The proposed Spice
model is feasible for the simulation of
bioelectric signal measurement and will be
helpful for biopotential amplifier design.
Because
the
distinct
features
of
QRS-complex in ECG pattern, it is easier to
verify the evaluation results for the
amplification of ECG signal. The Spice
model that simulates the measurement of
ECG signal is thus adopted in this study. The
simulated ECG pattern in this model is
modified from MIT116, which is selected
randomly from MIT/BIH ECG database. The
same model can also be applied to the other
kind of bioelectric signal with the simulated
biopotential pattern being replaced by the
corresponding simulated signal.
2. The Spice model
To simplify the analysis, the measurement of bioelectric events can be depicted in a simplified equivalent circuit model as demonstrated in Figure 1 (a). In this figure, Zeq1 and Zeq2 denote the
skin-electrode impedance, ZDM is the
differential-mode input impedance of the biopotential amplifier, and ZCM1 and ZCM2 represent the
common-mode input impedance of the amplifier. Wood et al. (1995) have used pure resistance at a specific frequency for Zeq1 and Zeq2 to evaluate the
effects of displacement currents induced into the leads and the body in biopotential measurement. However, the skin- electrode interface is in fact a complex RC network (ROSELL et al., 1988; NEUMAN, 1992a), and its equivalent circuit model is as shown in Figure 1 (b), in which the model for popular Ag/AgCl electrode is used. In Figure 1 (b), Ehc is the half-cell
impedance associated with the electrode-electrolyte interface and polarization effects, and Rs comes from the effective resistance associated with interface effects of the conduction gel between the electrode and the skin. The difference in ionic concentration across epidermis forms the potential difference Ese.
The epidermal layer is found to behave as an electrical impedance of a parallel RC circuit (Re||Ce). In the dermis and the subcutaneous layer, the impedance can be represented as pure resistance (Ru). The impedance value depends upon many factors, such as skin condition and preparation, type of conduction gel and the attachment status of electrodes, and so on. Clearly, the skin-electrode impedance will also change with different frequency, and the DC offset voltage of the electrodes (Ehc and Ese) may cause saturation of
amplifier if not dealt with properly. The simple resistance model cannot reflect such information, therefore the model shown in Figure 1 (b) is recommended for Zeq1 and Zeq2 in circuit design, and it
is also adopted in our study.
Replacing Zeq1 and Zeq2 of Figure 1 (a) by the
equivalent circuit model depicted in Figure 1 (b), we can observe the frequency response of
bio in
V
V
to evaluate the influence come from the impedance property of Zeq1 and Zeq2. The result is shown in Figure
2. From this result, the magnitude and phase of
bio in
V
V
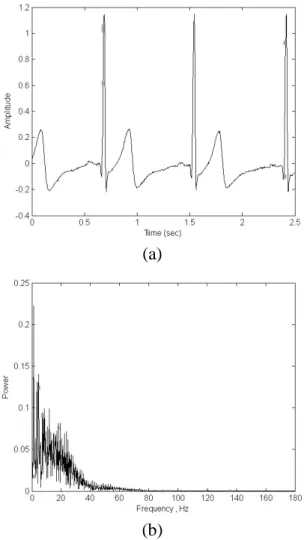
will change with frequency, but the deviation is little. It is thus reasonable to generate the simulated biopotential, Vbio, from the measured biopotentialdivided by the amplifier’s gain. In this study, MIT116 (an ECG signal selected randomly from MIT/BIH database) is used to serve the purpose, and a part of the pattern is demonstrated in Figure 3. All of the simulation in this study were carried out using Pspice A/D® in OrCAD® Family Release 9.2, and Pspice® Stimulus Editor is used to generate the simulated biopotential pattern in our study, where Pspice® and OrCAD® are registered trademarks of Cadence Design Systems, Inc.
One major problem encountered in biopotential recording is the appearance of unwanted power-line interference in the amplifier output (HUHTA and WEBSTER, 1973; WINTER and WEBSTER, 1983a; METTINGVANRIJN et al., 1990). There are four ways in which power lines can cause interference in biopotential measurement. 1) The magnetic field from power lines can cause an induced voltage in the loop formed by the electrode leads. 2) The electric field from power lines can induce a displacement current into the electrode leads which flows through the patient and thus creates an interfering voltage drop across the skin-electrode impedances. 3) The capacitively coupled displacement current can also flow into the patient and raise the common-mode potential with respect to both ground and circuit common. 4) The displacement current induced into the patient also creates an interference voltage between the recording electrodes as it flows through the body
impedance (HUHTA and WEBSTER, 1973; WINTER and WEBSTER, 1983a). Because the magnetic interference can be reduced by twisting the leads together, it is not necessary to include item 1) in the simulation model. Thakor and Webster (1980) have reported the interference voltage of item 4) can be neglected because the internal body impedances are very small and also the body disperses much of the displacement current such that the current flowing directly between two electrodes is reduced. For the reasons, only item 2) and 3) need be included in the simulation model. The proposed simulation model is illustrated in Figure 4, where Zeq1,2 and Zeqr denote
skin-electrode impedances, C1,2 is the lead capacitance
between lead wire and circuit common, Cg denotes the
capacitive coupling of subject to ground, Cs denotes
the stray capacitance between circuit common and ground, Zs represents the isolation impedance, and
Vbio is the simulated biopotential signal. Besides, Id1,2
and Idr represent the displacement currents coupled
into input leads, and Ib is the displacement current
coupled into body. SW1 in Figure 4 is the switch to determine either two- or three-electrode system, and SW2 is the switch to determine either isolated or non-isolated amplifier. By selecting the positions of SW1 and SW2, four configurations can be determined. They are isolated or non-isolated systems, using either two or three electrodes.
The proposed model is based on previously published work (HUHTA and WEBSTER, 1973; THAKOR and WEBSTER, 1980; WOOD et al., 1995) and mimics the electrical environment during biopotential measurement, including the skin-electrode impedances, capacitive couplings to ground, displacement currents induced from mains power line. The significant features of our model include the generation of simulated biopotential signal (Vbio in Figure 3) and the RC network for
skin-electrode impedances (circuit model in Figure 1 (b)).
3. Results
3.1 An ECG amplifier designed according to the proposed model
We designed an ECG amplifier, in three-electrode/ non-isolated configuration, with the aid of the proposed model to verify its feasibility. The amplifier circuit is demonstrated in Figure 5 (a). Figure 5 (b) shows the magnitude and phase response of the circuit for both nominal and the worst-case (10% element’s deviation) analysis. Following construction of a prototype, bench tests were carried out which gave results that were in close agreement with those of the simulations. The test results show that the mid-band gain is about 501, the 3-dB bandwidth extends from about 0.09 Hz to 152 Hz, and the CMRR of the amplifier is 116 dB. The power consumption of the circuit is about 156 mW. We find the characteristics of implemented amplifier agree well with those in simulation.
3.2Simulation results Simulation results
In order to evaluate the effect of power-line interference, two interference environments were
tested with different current parameters, while the skin-electrode impedances were kept the same. It is assumed that the skin is well prepared and the skin and electrodes are in good-contact status, but there exists 10% element’s deviation. Figure 6 shows the simulation result for general power-line interference environment with the parameters as follows: Ib=100
nA, Idr=100 pA, Id1=90 pA and Id2=110 pA. For the
simulation of severer power-line interference, the parameters are changed to: Ib=500 nA, Idr=450 pA,
Id1=550 pA and Id2=500 pA. The simulation result is
demonstrated in Figure 7. Results for time and frequency domain are given in both simulations.
3.3Measurement results
A practical measurement result of the designed circuit is demonstrated in Figure 8, where a male subject aged 30 was positioned at about 1 meter from a power-line cable collector in a university laboratory for electronic circuit design. Except the related instruments for signal measurement, the other equipments and the fluorescent lights were all turned off during the ECG recording. For the case of severer power-line interference condition, the same subject participated in the ECG recording at the same laboratory, and was positioned closer to the power-line cable collector (about 50 cm away). All the equipments in the laboratory were turned on, but the fluorescent lights were still kept off during the measurement. The result at the latter condition is shown in Figure 9. As in simulation case, time- and frequency-domain results are given in both Figure 8 and Figure 9. Lead II ECG signals were recorded in both cases. The electrode leads were twisted and run close to the subject’s body. The signals were sampled and recorded using a National Instruments DAQ Card-6024E for PCMCIA data acquisition board at a sampling frequency of 360 Hz, for a time of approximately 5 minutes each time. For a brief appearance of distinct QRS-complex, only a short segment (2.5 seconds or so) is shown in both Figure 8 (a) and Figure 9 (a).
The effects due to the power-line interference can be verified by power level at 50/60 Hz in corresponding spectrum. From the comparison of Figure 6 (b) versus Figure 8 (b) and Figure 7 (b) versus Figure 9 (b), the effects for different level of power-line interference can be reasonably evaluated via the proposed model.
4. Conclusion and Discussion
The purpose of this study is to propose a
simulation model in Spice for bioelectric
signal measurement that will be beneficial
for the design of biopotential amplifier.
Using the proposed model, the circuit
designer can thus estimate the circuit
performance and evaluate the effects due to
power-line interference in circuit simulation
package. Both the development time and cost
can be reduced by this approach. Based upon
the previously published work, the proposed
model
emphasises
on
the
genesis
methodology of simulated biopotential and
the complex RC network model is used for
skin-electrode impedance. To verify the
feasibility of the proposed model, we design
an ECG amplifier with the aid of this model.
After construction of the prototype, the
circuit
characteristics
and
practical
applications have been conducted for final
verification. The results show that there
exists a high level of agreement in
characteristics between the implemented
circuit and the simulated one. Besides, the
effect of power-line interference can be
reasonably evaluated by computer simulation
via the proposed model, where such effect is
usually difficult to analyse by hand.
Result shown in Figure 2 implies there is
no
much
response
difference
among
frequencies
as
Z
eq1,2(skin-electrode
impedances) of Figure 1 (a) being replaced
by complex RC network (Figure 1 (b)). It
seems reasonably a pure-resistance model
can be feasible for skin-electrode impedance.
However, the phase contribution from each
component in driven-right-leg (DRL) circuit
is critical and should be estimated as
accurately as possible to attain the circuit
stability analysis. Moreover, the complex RC
network
model
can
reflect
the
frequency-dependent
property
of
skin-electrode impedance. It is also critical to
evaluate the potential divider effect in
biopotential recording, which will convert
the common-mode interference potential into
differential-mode signal and is primarily due
to the impedances imbalance between
recording electrodes. Clearly the potential
divider effect will also vary with different
frequency, and the effect at the power-line
frequency is the most important one. Such
information will be lost if the pure-resistance
model is adopted. For the reasons, the
complex RC network model is strongly
recommended for skin-electrode impedances.
In this study, the model for popular
Ag/AgCl electrode is adopted. If dry
electrodes are used for signal recording, the
equivalent circuit model should be modified.
Besides, the parameters in the proposed
model
depend
upon
principally
the
preparation of skin, the contact of electrode
with skin, and the interference from mains
power supply. Most of the parameter values
adopted in the simulation have also appeared
in other previously published work. From the
comparison
between
simulation
and
measurement results, the adopted values
seem feasible.
There are four modes of configuration
for biopotential measurement, they are
two-or three- electrode/isolated two-or non-isolated
configuration. And, there exists different
kind of biopotential signals being of clinical
importance. To verify the feasibility of CAD
methodology for biopotential amplifier, only
one
type
of
configuration
(three-electrode/non-isolated) and only ECG
signal is selected to serve the purpose. The
same modelling principle can also be applied
to the other three configuration modes and
the other kind of biopotential signals.
Reference
DOBREV, D. and DASKALOV, I. (2002):
‘Two-electrode biopotential amplifier with
current-driven inputs,’
Med. Biol. Eng.
Comput., 40, pp. 122-127
HUHTA, J. C. and WEBSTER, J. G. (1973):
‘60-Hz
interference
in
electrocardiography,’
IEEE
Trans.,
BME-27, pp. 91-101
METTINGVANRIJN, A. C., PEPER, A. and
GRIMBERGEN,
C.
A.
(1990):
‘High-quality recording of bioelectric
events. Part 1: Interference reduction,
theory and practice,’
Med. Biol. Eng.
Comput., 28, pp. 389-397
METTINGVANRIJN, A. C., PEPER, A. and
GRIMBERGEN,
C.
A.
(1991):
‘High-quality recording of bioelectric
events. Part 2: Low-noise, low-power
multichannel amplifier design,’
ibid., 29,
pp. 433-440
METTINGVANRIJN, A. C., PEPER, A. and
GRIMBERGEN, C. A. (1994): ‘Amplifiers
for bioelectric events: a design with a
minimal number of parts,’
ibid., 32,
pp.305-310
NEUMAN, M. R. (1992a): ‘Biopotential
electrodes,’ in Webster, J. G. (Ed.):
‘Medical instrumentation: application and
design.’ (Houghton Mifflin Co., Boston) pp.
227-287
NEUMAN, M. R. (1992b): ‘Biopotential
amplifiers,’
ibid., pp. 288-353
PALLÁ S-ARENY, R. (1986): ‘On the
reduction of interference due to common
mode voltage in two-electrode biopotential
amplifiers,’
IEEE Trans., BME-33, pp.
1043- 1046
PALLÁ S-ARENY,
R.
(1988):
‘Interference-rejection characteristics of
biopotential amplifiers: a comparative
analysis,’
ibid., BME-35, pp. 953-959
PARK, S. and JAYARAMAN, S. (2003):
‘Enhancing the quality of life through
wearable technology,’
IEEE Eng. Med. Biol.
Mag., 22, pp. 41-48
ROSELL, J., COLOMINAS, J., RIU, P.,
PALLÁ S-ARENY, R. and WEBSTER, J. G.
(1988): ‘Skin impedance from 1 Hz to
1MHz,’
IEEE Trans., BME-35, pp.
649-651
SPINELLI, E. M., MARTÍNEZ, N. H. and
MAYOSKY, M. A. (1999): ‘A
trans-conductance driven-right-leg circuit,’
ibid.,
BME-46, pp. 1466-1470
THAKOR, N. V. and WEBSTER, J. G.
(1980): ‘Ground-free ECG recording with
two electrodes,’
ibid., BME-27, pp.
699-704
WINTER, B. B. and WEBSTER, J. G.
(1983a): ’Reduction of interference due to
common mode voltage in biopotential
amplifiers,’
ibid., BME-30, pp. 58-62
WINTER, B. B. and WEBSTER, J. G.
(1983b): ’Driven-right-leg circuit design,’
ibid., BME-30, pp. 62-66
WOOD, D. E., EWINS, D. J. and
BALACHANDRAN,
W.
(1995):
‘Comparative
analysis
of
power-line
interference
between
two-
or
three-electrode biopotential amplifier,’
Med.
Biol. Eng. Comput., 33, pp.63-68
Zeq1 Zeq2 ZDM ZCM1 ZCM2 Vbio Vin Front end of biopotential amplifier DIFF1 DIFF2
(a)
Ru Re Ce Ese Rs Rd Cd Ehc(b)
Figure 1 (a) The simplified equivalent circuit
model, where Z
eq1and Z
eq2denote the
skin-electrode impedance, Z
DMis the
differential-mode input impedance of the
biopotential amplifier, and Z
CM1and Z
CM2represent
the
common-mode
input
impedance of the amplifier. (b) The
equivalent circuit model of skin-electrode
impedance.
Figur e 2 The frequency response of
bio in
V
V
for Figure 1 (a), where Z
DM=Z
CM1=Z
CM2=
10G
Ω
|| 2pF, and Z
eq1and Z
eq2have been
replaced by the circuit model depicted in
Figure 1 (c) in three different conditions as
follows.
: skin has not been prepared, and the
imbalance of electrode-electrolyte impedance
is in the worst case,
: skin has been prepared, and the imbalance
of electrode-electrolyte impedance is in the
worst case,
: skin has been prepared, electrodes are
well attached, and the electrode-electrolyte
impedance is 10% deviation from the typical
value.
Figure 3 One segment of the simulated ECG
pattern modified from MIT116.
Zeq1 Zeq2 Vbio Zeqr SW1 Cg Cs Zs SW2 Biopotential amplifier OUT ckt common Ground DIFF1 Reference Ib Id1 Id2 Idr DIFF2 C1 C2
Figure 4 The proposed Spice model for
bioelectric signal measurement, where the
circuit model depicted in Figure 1 (c) is used
for Z
eq1and Z
eq2, and one segment of V
biois
R3 150k VCC 0 VCC C4 0.1m U1 AD620/AD 6 3 2 5 7 4 1 8 OUT + - REF V+ V-RG1 RG2 0 R13 24.9k VEE VCC R14 10k DIFF1 OUT 0 C5 0.01u R1 150k 0 VCC 0 R9 1k R10 69k C9 1n C3 0.1m 0 R4 150k R5 67k V1 6Vdc U2A AD713/AD 3 2 4 11 1 + -V+ V-OUT C1 0.1m 0 VOUT VEE R2 150k 0 0 0 R7 1k C8 0.047u 0 VCC C2 0.1m DIFF2 R11 2.5k U2C AD713/AD 10 9 4 11 8 + -V+ V-OUT R12 24.9k C7 0.047u R15 1MEG R8 1k U2B AD713/AD 5 6 4 11 7 + -V+ V-OUT C6 0.01u V2 6Vdc Reference VEE R6 67k VEE VEE 0