增益箝制寬頻摻鉺光纖和波導放大器技術之研究
98
0
0
全文
(2) 增益箝制寬頻摻鉺光纖和波導放大器技術之研究 Study on Gain-Clamped Wide-band Erbium–Doped Fiber and Waveguide Amplifiers. 研 究 生:賴國祥. Student:Kuo-Hsiang Lai. 指導教授:祁. Advisor:Sien Chi. 甡. 國 立 交 通 大 學 光 電 工 程 研 究 所 博 士 論 文. A Dissertation Submitted to Department of Photonics & Institute of Electro-Optical Engineering, College of Electrical Engineering and Computer Science National Chiao Tung University in Partial Fulfillment of the Requirements for the Degree of Doctor of Philosophy in Electro-Optical Engineering July 2005 Hsinchu, Taiwan, Republic of China. 中 華 民 國 九 十 四 年 七 月.
(3)
(4)
(5) 增益箝制寬頻摻鉺光纖和波導放大器技術之研究. 研 究 生:賴 國 祥. 指導教授:祁. 甡. 國立交通大學 電機資訊學院 光電工程研究所. 摘. 要. 本論文主要在研究寬頻摻鉺光纖和摻鉺波導放大器及增益箝制技術。研究重點 在於研發、設計和探討增益箝制寬頻摻鉺光纖放大器與摻鉺波導放大器模組和技 術,期望能滿足光放大器應用於光通訊系統之高頻寬、高穩定增益,以及高成本 效益之需求。在增益箝制寬頻摻鉺光纖放大器之研究部分,包括以整合摻鉺光纖 放大器和半導體光放大器,並以後向光迴路反饋技術,研發涵蓋波長 1540 奈米到 1600 奈米(C-頻段和 L-頻段)頻段之高增益箝制寬頻光放大器模組;和以多個反向 雷射放光飽和技術來同時達成增益平坦和增益箝制之摻鉺光纖放大器模組;以及 以摻鉺光纖作為增益媒質的 S-頻段(波長 1480 奈米到 1530 奈米)迴路雷射模組等之 設計原理、架構與實驗的詳細分析探討和驗證。在增益箝制寬頻摻鉺波導放大器 之研究方面,則包括以前向光迴路反饋技術和雷射粒子反轉技術,研發增益箝制 寬頻摻鉺波導放大器模組;及 S-到 L-頻段複合式耦合結構之摻鉺波導放大器模組 等設計原理和實驗之分析與驗證論述。本研究之光放大模組與增益箝制技術經實 驗證明,將有助於促進寬頻摻鉺光纖和波導放大器在寬頻光纖通訊系統之應用與 發展,及加速達成國家全光化寬頻通訊網路新紀元之實現。. I.
(6) Study on Gain-Clamped Wide-band Erbium-Doped Fiber and Waveguide Amplifiers. Student:Kuo-Hsiang Lai. Advisor:Sien Chi. Institute of Electro-Optical Engineering College of Electrical Engineering and Computer Science National Chiao Tung University. ABSTRACT In this dissertation, we investigated the technologies for the gain-clamped wide-band Erbium-doped fiber amplifiers and Erbium-doped waveguide amplifiers. We proposed the wide band Erbium-doped optical amplifier modules and gain-clamped technologies for the optical amplifier modules to satisfy the requirements, such as a wide bandwidth, a high stable gain and the high cost efficiency, of the broadband communication networks. In the research of gain-clamped wide-band Erbium-doped fiber amplifiers, we have proposed and experimentally investigated a C- to L-band gain-clamped optical amplifier module by cascading Erbium-doped fiber amplifiers and semiconductor optical amplifiers and using the backward optical feedback method. A gain-clamping and gain-flattening technique for Erbium-doped fiber amplifiers by the method of multiple backward lasing saturated tones has been also studied and demonstrated experimentally. Furthermore, the application of Erbium-doped fiber has been studied. A S-band fiber ring laser module using double-ring structure and Erbium-doped fiber as gain medium has been presented. In the research of gain-clamped wide-band Erbium-doped waveguide amplifiers, by the means of an optical feedback and the method of clamping the population inversion resulting from. II.
(7) forward lasing, we propose a gain-clamped Erbium-doped Waveguide amplifier module. In addition, a S- to C-band optical amplifier module with a coupled-structure has also been proposed. The operation principles and theory of these devices have been illustrated and experimentally evaluated. Through the proof of the experiments, these proposed technologies and optical amplifier modules could be used effectively in the broadband communication systems and they are helpful to accelerate the development of the broadband communication systems.. III.
(8) ACKNOWLEDGMENTS I would like to express my thanks to my advisor, Sien Chi, for his enlightenment on my research and life. I particularly thank my parents, wife, Janney Lee, and my daughters, Alice and Grace for their consistent patience and encouragement while I was working on the research. Thanks also go to Dr. Chien-Hung Yeh, Dr. Ying-Tsung Lu, Sen-Yih Chow and Hung-Chang Chien for their help and suggestions during many experiments and technical discussions. I would like to thank my sister, Miranda, for all her efforts in reviewing and commenting on this dissertation. I am very grateful to Dr. Yuan-Kuang Tu, the chief of the program management and coordination of Telecommunication laboratories of Chunghwa Telecom (CHT-TL), Shyr-Yuan Cheng, the chief of the Broadband Transport ans Access Tech. Lab. of CHT-TL, Dr. Ching-Sheu Wang, Dr. Rong-Ruey Lee and many colleagues of CHT-TL for their support on my works and researches. A large number of individuals have been very helpful, either directly or indirectly, during the time of this research. It is impossible to mention all of them by name. Thank you for all!. Kuo-Hsiang Lai July 2005. IV.
(9) Contents Chinese Abstract ………………………………………………………………………………I English Abstract ……………………………………………………………………………Ⅱ Acknowledgments …………………………………………………………………………Ⅳ List of Figures .……………………………………………………………………………….V List of Acronyms …………………………………………………………………………..Ⅷ Chapter 1 Introduction ............................................................................................................... 1 1.1 Overview...................................................................................................................... 1 1.1.1 Overview of the Erbium-doped fiber amplifiers............................................... 2 1.1.2 Overview of the Erbium-doped Waveguide amplifiers .................................... 5 1.2 Motivation.................................................................................................................... 6 1.3 Organization of this thesis............................................................................................ 7 Chapter 2 Gain-Clamped Hybrid C-Band to L-Band Optical Fiber Amplifier.......................... 9 2. 1 Principle of Operation and Theory.............................................................................11 2.2 Proposed Configuration and Experimental Setup...................................................... 12 2.3 Results and Discussion............................................................................................... 13 2. 4 Summary ................................................................................................................... 15 Chapter 3 Simultaneously Gain-Clamped and Gain-Flattened Technique for EDFA ............. 25 3.1 Principle of Operation and Theory............................................................................. 26 3.2 Proposed Configuration and Experimental Setup...................................................... 26 3.3 Results and Discussion............................................................................................... 28 3.4 Summary .................................................................................................................... 29 Chapter 4 Gain-Clamping Technique for EDWA .................................................................... 34 4.1 Principle of Operation and Theory............................................................................. 35 4.2 Proposed Configuration and Experimental Setup...................................................... 36 4.3 Results and Discussion............................................................................................... 37 4.4 Summary .................................................................................................................... 39 Chapter 5 Hybrid S- to C- Band Optical Fiber Amplifiers ................................................... 46 5.1 Principle of Operation and Theory............................................................................. 47 5.2 Proposed Configuration and Experimental Setup...................................................... 47 5.3 Results and Discussion............................................................................................... 49 5.4 Summary .................................................................................................................... 51 Chapter 6 An Application of EDF Amplification: S-Band Erbium-Doped Fiber Double-Ring Laser......................................................................................................................... 57 6.1 Principle of Operation and Theory............................................................................. 58 6.2 Proposed Configuration and Experimental Setup...................................................... 58 6.3 Results and Discussion............................................................................................... 60 6.4 Summary .................................................................................................................... 61 Chapter 7 Conclusion............................................................................................................... 68 7.1 Summary for the dissertation ..................................................................................... 68. V.
(10) 7.2 Suggestion for future work ........................................................................................ 71 Reference ................................................................................................................................. 73 Biography................................................................................................................................. 82 Publication List ........................................................................................................................ 83. VI.
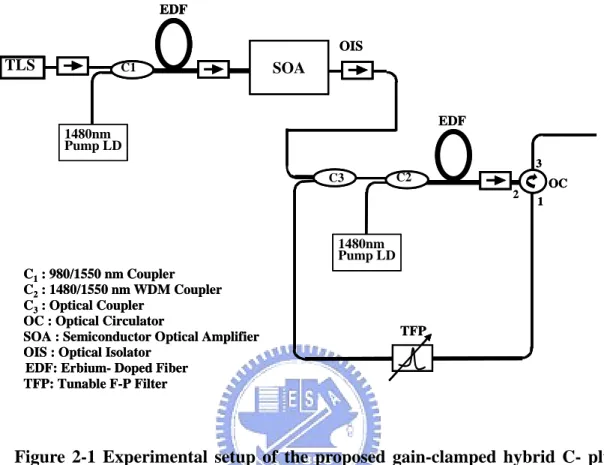
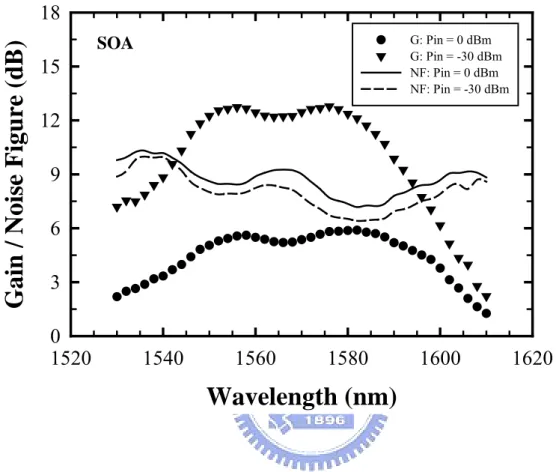
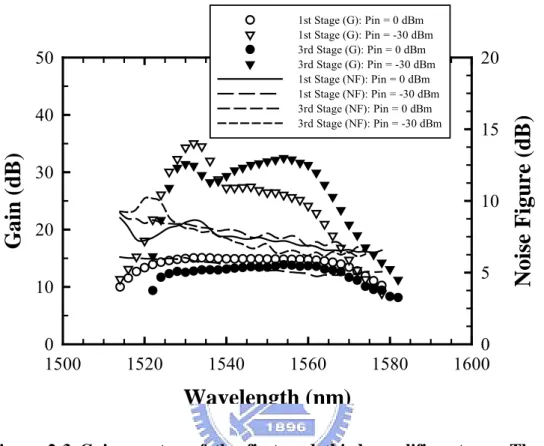
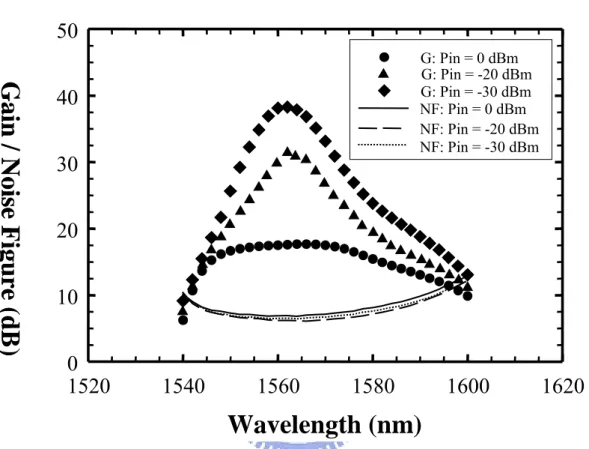
(11) List of Figures Figure 2-1 Experimental setup of the proposed gain-clamped hybrid C- plus L-band fiber amplifier module ............................................................................ 17 Figure 2-2 Gain and noise figure spectra of an SOA in the operating range from 1530 to 1630 nm. The probe input signal power Pin is 0 and –30 dBm, respectively. ............................................................................................ 18 Figure 2-3 Gain spectra of the first and third amplifier stages. The signal power of the probe Pin is 0 and –30 dBm, respectively. ......................................... 19 Figure 2-4 Gain and noise figure spectra of the proposed hybrid amplifier module without the backward optical feedback when the input power Pin is 0 and –30 dBm, respectively...................................................................... 20 Figure 2-5 Gain and noise figure spectra of conventional L-band EDFA with an EDF of 100 m long and a 1480 nm pump laser of 160 mW................... 21 Figure 2-6 Gains and noise figures versus the different power level of input signal at 1550 nm while the lasing wavelength at 1559 nm, and the input ratio of C is 95, 90, 70 and 50 %, respectively ....................................................... 22 Figure 2-7 Gains and noise figures versus the different power level of input signal at 1566 nm while the lasing wavelength at 1570 nm, and the input ratio of C is 95, 90, 70 and 50 %, respectively ....................................................... 23 Figure 2-8 Gains and noise figures versus the different power level of input signal at 1550 nm while the lasing wavelength at 1570 nm, and the input ratio of C is 95, 90, 70 and 50 %, respectively ....................................................... 24 Figure 3-1 Proposed and experimental setup for the simultaneously gain-flattened and gain-clamped EDFA system ............................................................. 31 Figure 3-2 Simulated gain spectra of this proposed configuration for no injected light, the injection lights of a single tone of –3 dBm at 1533.5 nm and multiple tones of –3 dBm generated from the FD-LD with a central wavelength at 1533.5 nm when three different input levels of –1, -6 and –11 dBm are operated ...................................................................... 32 Figure 3-3 Measured gain spectra of this experimental setup in Figure 3-1 for no injected light, and –3 dBm injected FP-LD light with a central wavelength at 1533.5 nm over three saturated input levels of –1, -6 and –11 dBm ........................................................................................... 33 Figure 4-1 Experimental setup of the proposed gain-clamped EDWA module....... 40 Figure 4-2 Reflected spectrum of FBG used at 1541 nm ........................................ 41. VII.
(12) Figure 4-3 Gain and noise figure spectra of the EDWA module without gain clamping, over wavelength range of 1530 to 1560 nm, when input signal power levels are –10, –13, –16 and –20 dBm......................................... 42 Figure 4-4 Gains and noise figures for the proposed structure in wavelength range of 1530 to 1560 nm, when the power level of the saturated tone is attenuated at 5 dB.................................................................................... 43 Figure 4-5 Gains and noise figures for the proposed structure in wavelength range of 1530 to 1560 nm, when the power level of the saturated tone is attenuated at 7 dB.................................................................................... 44 Figure 4-6 Gains and noise figures for the proposed structure in wavelength range of 1530 to 1560 nm, when the power level of the saturated tone is attenuated at 10 dB.................................................................................. 45 Figure 5-1 Experimental setup for the proposed hybrid optical fiber amplifier module from S- to C-band ...................................................................... 52 Figure 5-2 Gain and noise figure spectra for the S-band EDFA module while the input signal powers Pin is 0, –15 and –30 dBm, respectively ................. 53 Figure 5-3 Gain and noise figure spectra for the EDWA module while the input signal powers Pin is 0, –15 and –30 dBm, respectively........................... 54 Figure 5-4 Insertion loss of 1480/1550 nm WDM coupler versus operating wavelengths............................................................................................. 55 Figure 5-5 Gain and noise figure spectra of the proposed configuration with the input signal powers Pin of 0, –15 and –30 dBm, respectively................. 56 Figure 6-1 Schematic diagram of mode selection in the double-ring laser cavity... 62 Figure 6-2 Proposed configuration and experimental setup of the S-band EDF double-ring laser ..................................................................................... 63 Figure 6-3 Output wavelength spectra of the S-band EDF double-ring laser.......... 64 Figure 6-4 Output power and SMSR versus the tuning wavelength for this proposed ring laser over the tuning range from 1484 to 1518 nm ......................... 65 Figure 6-5 Output power fluctuation of the proposed and traditional configurations as the wavelength is set at 1498 nm........................................................ 66 Figure 6-6 Wavelength variation of the proposed and traditional configurations as the wavelength is set at 1498 nm ............................................................ 67. VIII.
(13) List of Acronyms AOTF. Acousto-optic Tuneable Filters. ASE. Amplified Spontaneous Emission. B-PON. Broadband Passive Optical Networks. CI. Clamping Index. FBG. Fiber Bragg grating. DFB. Distributed Feedback. DWDM. Dense Wavelength Division Multiplexing. EDF. Erbium-Doped Fiber. EDFA. Erbium-Doped Fiber Amplifier. EDWA. Erbium-Doped Waveguide Amplifier. FP-LD. Fabry-Perot Laser Diode. FFP. Fiber Fabry-Perot. FSR. Free Spectral Ranges. FWDM. Fiber Wavelength Division Multiplexers. MZI. Mach-Zehnder Interferometer. NF. Noise Figure. OC. Optical Circulator. OIS. Optical Isolator. OSA. Optical Spectrum Analyzer. PC. Polarization Controller. PZT. Piezoelectric Transducer. RFA. Raman fiber amplifier. RA. Raman amplifier. RE. Rare Earth. IX.
(14) SMF. Single-Mode Fibers. SMSR. Side-Mode Suppression Ratio. SOA. Semiconductor Optical Amplifier. TBF. Tunable Band-pass Filter. TDFA. Thulium-Doped Fiber Amplifiers. TLS. Tunable Laser Source. VOA. Variable Optical Attenuator. WDM. Wavelength Division Multiplexing. X.
(15) Chapter 1 Introduction. 1.1 Overview Optical communication was introduced since 20 years ago, when it became possible to improve the attenuation in silica fiber. The technologies and products of the silica fiber and optoelectronics have been investigated worldwide since then. As a result, the optical communication is becoming one of the most promising technologies in the field of the data transmission. A major thrust of research activities within the field of the optical communication is to increase the capacity of optical systems. Therefore, many researches have been focused on the loss-limited or dispersion-limited systems to achieve the ultimate capacity in the pass years until the fiber optical amplifiers were initiated. The fist fiber amplifier was demonstrated in 1987. [1]. . This changed the development of the research in the. optical communication systems. Thereafter, progress has multiplied to extent that amplifiers today offer far-reaching new opportunities in the telecommunication networks. The Erbium-doped fiber amplifier is one of the most important optical amplifies for telecommunication networks. Recently, The wavelength division multiplexing (WDM) technology is interesting to increase transmission capacity for the broadband communication networks [2], [3]. By adding WDM optical components, the multiple wavelength optical signals. 1.
(16) can carry different signal formats, such as digital data, digital video, and analog video, to flexibly upgrade a broadband distribution network. Even so, a wide bandwidth and a stable gain against variations in the signal power are critical issues for WDM networks since channels adding or dropping. Therefore, the technologies of the gain clamping and extending bandwidth more than C-band are intensively studied recently.. 1.1.1 Overview of the Erbium-doped fiber amplifiers The first demonstration of rare earth (RE) doping of single-mode fibers (SMF) was in 1983 by Broer and Simpson [4,5]. Many different rare-earth ions, such as erbium, holmium, neodymium, samarium, thulium, and yetterbium, can be used to realized fiber amplifiers operating at different wavelengths covering a wide region extending over 500 to 3500 nm [6]-[7]. . However, Erbium-doped fiber amplifiers (EDFA) have attracted the most attention. because of they operating at 1.550 nm. Erbium-doped single-mode fiber amplifiers for traveling wave amplification of 1550 nm were simultaneously developed in 1987 [8,9]. Starting 1989, Erbium-doped fiber amplifiers are the catalyst for an entirely new generation of high capacity fiber optical networks. A key advance is the recognition that the Er+3 ion is ideally suited as an amplifying medium for modern optical communication systems at 1550 nm, the wavelength region in which the fiber loss is minimum. One of important issues to decide the gain characteristics of EDFAs is the pumping scheme. In generally, there are two different pumping schemes. One is forward-pumping configuration, in which both pump and signal beams propagate along the same direction, and the other is backward-pumping configuration, in which pump and signal beams propagate in opposite direction. In the saturation regime, the power-conversion efficient is generally better in the backward-pumping configuration. [10]. .. Efficient pumping in EDFA is possible using semiconductor laser operating near 980 and 1480 nm. Typically, the 980 nm pump wavelength yields higher gains than a1480 nm pump at. 2.
(17) high powers. On the other hand, the amplified spontaneous emission (ASE) is higher for a 980 nm pump than 1480 nm pump. In addition, the threshold power for 980 nm pump is higher than that for 1480 nm pump owing to high quantum efficient of 1480 nm. According the generalized rate equations, the pump and signal propagation equations can be written as. dI p ( z ) dz. = ( N 2σ p ,e − N 1σ p ,a ) I p ( z ). (1). dI s ( z ) = ( N 2σ s ,e − N 1σ s ,a ) I s ( z ) dz. (2). where N1 and N2 represent population of lower-state and upper-state, respectively. Ip, Is, σs,a, σs,e, σp,a, σp,e stand for the signal and pump intensities, absorption and emission cross sections, respectively. The gain, G, of the EDFA can be derived from Equation (1) and (2), and can be written G= exp [(N2,aveσs, e- N1,aveσs, a )ΓsL]. (3). where Γs is the overlap factor between the light-field modes and Erbium ions, and N2,ave, N1,ave, and L represent average population of lower-state and upper-state, and the length of Erbium-doped fiber, respectively. Equation (3) reveals the gain after transmitting through the Erbium-doped fiber is only dependent on the average inversion of the Erbium ions in the fiber. Meanwhile, the gain spectrum will depend on the powers of the pump and signals, and ASE present in the amplifier. Therefore, In the design of EDFAs for WDM applications, in which the number and the power level of the input channels may vary randomly in time as in a networking scenario, it is thus essential to stabilize the gain profile of the amplifier. Several gain control techniques have been proposed in the literature [11-18]. Mainly, these researches could be divided into two. 3.
(18) classes. The first class uses some optical measures of inversion at the output of the amplifier to produce a signal that electrically controls the power of either the pump or of an extra control input laser source [11]–[15]. Another class uses an all-optical feedback lasing signal sustained by the amplifier itself, which clamps the average inversion and thus the gain to the desired level. [16]–[18]. . This technique is known as gain clamping. The feedback is either. obtained by forming a feedback fiber loop, effectively implementing a fiber ring laser (loop configuration), or by placing fiber gratings, acting as mirrors only at the laser wavelength, at the active fiber ends (straight-line configuration). The laser plays here the role of the extra control input laser source of the previous class. Generally, conventional EDFAs are used in the C-band, from 1530 nm to 1560 nm. This constrains the design and bandwidth utility for WDM systems and optical networks. To extend the bandwidth region of amplification, the L-band (1560 - 1610 nm) fiber amplifiers have been proposed by using a longer Erbium-doped fiber (EDF) [19], [20]. This L-band EDFA used Erbium-doped fiber of 150 m as a gain medium and has 25 dB gain over wavelength of 1570 nm to 1600 nm. Fiber Raman amplifiers and hybrid amplifiers are also proposed for L-band optical amplifiers [21], [22]. These fiber Raman amplifiers using 12-wavelength-channel WDM pumping technique to obtain 100 nm of flat gain bandwidth, 0.1 dB flatness over 80 nm, from 1527 to 1607 nm. Recently, the S-band has emerged as the third communication band with which to increase capacity. [23]. . To obtain an EDFA gain in the S-band, it is. necessary to maintain a high average inversion level along the EDF as well as suppress amplified spontaneous emission (ASE) because the gain coefficient is not uniform in the amplification wavelength range (1490 - 1520 nm) and the gain coefficient around 1490 nm is much. smaller. than. that. around. 1520. nm. [24]. .. Therefore,. an extremely. large. wavelength-dependent loss is necessary to flatten the gain spectrum from 1490 to 1520 nm. A new S-band amplification technique has been reported. [25]. . The S-band EDFA used. Er:Al/Ge/SiO2 fiber with a ~1525 nm fundamental-mode fiber with depressed cladding design. 4.
(19) to suppress C-band ASE and 980 nm pump laser to generate EDF gain extension effects. The peak gain of the unsaturated gain spectrum was 32 dB near 1550 nm and a gain bandwidth of >20 dB was extending from 1485 to 1511 nm. The unsaturated noise figure of these amplifiers ranged from 7 dB to 10 dB for wavelength between 1488 and 1508nm. The +11.5 dB saturation output power could be achieved. From the literature, it is clear that the technique for wide band EDFAs is one of the key issues to promote the next generation WDM networks.. 1.1.2 Overview of the Erbium-doped Waveguide amplifiers With the evolution of optical communication systems, the new requirement for compact low-cost optical amplifiers that meet the performance demands of metro and core/access networks is raising now. Erbium-doped waveguide amplifiers (EDWAs) have a great potential being used as in-line-amplifiers and pre- amplifiers in local area and access networks. They share the advantages of the Erbium-doped fiber amplifiers including low noise figure and absence of crosstalk between WDM channels. In the other hand, EDWAs offer extra value of cost reduction, and increased reliability and compactness. Since EDWAs have to provide considerable gain from a short length, doping of extremely high Erbium concentrations is required. In generally, the concentration of Erbium in an EDWA is approximately 10 ~ 20 times higher than that of an EDFA. Clustering and homogeneous up-conversion effects will limit useful value of Erbium concentration, thus preventing the amplifier length from further shortening [26]. Some fabrication techniques of EDWAs, such as ion-implantation, and plasma enhanced chemical vapor deposition, to further miniaturize EDWAs with high Erbium concentrations have bee reported [27], [28]. Recently, the research regarding EDWAs has been carried out with a view to the applications in optical communication systems. [29], [30]. . An EDWA with laser diode pumped. which employs simple straight and curved Erbium-doped silica-based waveguides has already. 5.
(20) been demonstrated. This EDWA also integrates WDM couplers to multiplexes the signal and pump light. A net gain of 24 dB could be achieved in this EDWA. An EDWA with a waveguide as short as 4.5 cm was also demonstrated [31]. The EDWA doped with up to 5 more % of Er3+ in the soda-lime-silicate glasses had shown gains of up to 15 dB and the saturation output power was 3.5 dBm. A pigtailed EDWA module with a single 980 nm diode pump and 4.5-cm-long wavegide was presented [32]. This EDWA was pigtail to fiber for easy insertion to fiber optical communication networks. As a result, the amplifier delivered a signal gain of 16.5 dB at 1534nm for 180 mW of pump power at 980 nm, a saturation output power of 12.5 dBm and a noise figure of 5 dB. To compare with 8.6 cm long waveguide, this EDWA was used as power amplifier in a 10Gb/s transmission system over 72.5 km. The experimental results showed its performance was better than that of the long waveguide amplifier. As the same as EDFAs, the gain profile of the EDFW presents non-flat and input dependent behavior. The stabilized gain versus the variation of input signal power still becomes an important issue when the EDFA is used in WDM systems. However, there is little research on the gain clamping of EDWAs in the pass years.. 1.2 Motivation The broadband optical communication is becoming one of the most promising technologies in the data transmission. The bandwidth is gradually and strongly requested while the triple-play service is delivered to people’s daily life. To increase transmission capacity and meet this request for the broadband communication networks, the technologies of the WDM and the optical amplifier are two most attractive technologies. Meanwhile, the Erbium-doped fiber and Erbium-doped waveguide amplifier are two of the potential optical amplifiers today. However, as mentioned previously, the nature, input-dependent gain, of the EDFA/EDWA will limit the applications in the WDM optical networks. Therefore, how to. 6.
(21) establish a cost-efficient gain-clamped EDFA/EDWA is an important and valuable research. Owing to the diversification of the optical network, such as the broadband passive optical network and the necessities of the network monitoring for optical networks using wavelength of 1550 nm, the transmitting bandwidth of the optical networks is not only C-band but also S- and L-band. However, conventional EDFAs and EDWAs are used in the C-band, from 1530 nm to 1560 nm. These constrain the design and the bandwidth utility for the optical WDM networks. Therefore, how to extend the gain bandwidth from C-band to Sand L-band is also an attractive research currently. On the basis of theses motivations above, we investigate the technologies for the gain-clamped wide-band Erbium-doped fiber and waveguide amplifiers. We have also proposed new optical amplifier modules to meet the requirement of WDM networks. We will present and explicate our researches in the following chapters.. 1.3 Organization of this thesis In this thesis, the technologies for the gain-clamped wide-band Erbium-doped fiber amplifiers and Erbium-doped waveguide amplifiers are studied. The researches on the development of the new gain-clamped constructions and the applications of EDFA and EDWA in WDM optical communication networks are the core of our study. In chapter 1, the overviews of technique including EDFA, EDWA, and gain-clamped technique in optical amplifiers are described. The evolution and development of EDFA and EDWA are also illustrated. A new gain-clamped wide-band Erbium-doped fiber amplifier is studied in the chapter 2. We have proposed and experimentally demonstrated the new architecture for gain-clamped wide-band Erbium-doped fiber amplifiers. The prosperities are also investigated in detail. For the WDM systems, optical amplifiers are frequently required to concurrently to amplify signals of several channels. In chapter 3, a simultaneously gain-clamped and. 7.
(22) gain-flattened technique for EDFA has been investigated. The performance of the gain clamping and gain flattening will be analyzed through the simulation and experiments. The study of the gain-clamped technique continues in chapter 4. Moreover, the novel module of gain-clamped EDWA has been proposed. Its amplifying and gain clamping behavior are discussed and experimentally shown. Chapter 5 provides an attractive module of hybrid S- to C- band optical fiber amplifiers. The design aspect is expounded. It also described and discussed the experimental results in this chapter. Erbium-doped fibers are not only used in the optical amplifiers but also used in the fiber ring lasers to act as gain medium. An application of EDF amplification in S-band Erbium-doped fiber double ring laser has been proposed and experimentally demonstrated in Chapter 6. Finally, we make a conclusion of our research and some suggestions for further works in chapter 7.. 8.
(23) Chapter 2 Gain-Clamped Hybrid C-Band to L-Band Optical Fiber Amplifier. EDFAs are generally used in the C-band (1530 - 1560 nm) for optical communication systems. The applications of the L-band (1560 - 1610 nm) to optical communication systems, such as monitoring for the strain of embed fibers and the troubleshooting for the optical communication systems operating at 1550nm, are more interested recently. There are some techniques have been investigated for the L-band fiber amplifiers by using a longer EDF than that of the C-band EDFAs. [33], [34]. , the fiber Raman amplifiers. [35]. , and the different hybrid. amplifiers [36]. Besides, a wide-band EDFA from C- to L-band in parallel structure has also been studied. [37]. . The semiconductor optical amplifier (SOA) is another attractive optical. amplifier in WDM systems due to their high on-off ratio. The feature of high on-off ratio is needed to improve the power penalty by crosstalk [38]. Furthermore, if using hybrid SOA and EDFAs, one can achieve a broadband gain bandwidth and reduce the crosstalk in WDM systems. The SOAs, on the other hand, generally have low gain and worse noise figure than the EDFAs. How to combine the advantage of the SOAs and EDFAs to construct a C- to L-band optical amplified is becoming a valuable research issue. The reasons why Erbium-doped fiber amplifiers have strongly contributed to recent. 9.
(24) advances in wavelength division multiplexing (WDM) networks are due to their high transmission capacities and optical gain. The aggregated transmit power would be time-variant in the WDM system when there are some channels are added and dropped. Thus, the stabilized gain versus the variation of input signal power is one of the important issues for WDM systems.. However, because of the nature of Erbium-doped fibers, the gain profiles of. the Erbium-doped fiber amplifiers present input-dependent behavior gain-clamped. function. is. seriously. needed. for. EDFAs. [39]. . Therefore, the. dynamic. working. on. wavelength-division-multiplexing networks. In other words, how to stabilize gain at different input signal powers is one of the critical issues for EDFAs when they are applied in DWDM systems. Several gain-clamped techniques have been studied, such as the all-optical gain-clamped methods. [40], [41], [42]. , or the concatenation of Erbium-doped fiber with different. codopants [43], or variously optical filters, including long-period fiber gratings [44], fiber Bragg gratings [45], fiber acousto-optic filters [44], [46], [47], and Mach-Zehnder interferometer (MZI) [48], to compensate for the variations in the gain profile. In addition, the gain stabilizing methods by employing the optical feedback were also reported. [49], [50]. . A Gain-clainped EDFA using. stimulated Brillouin scattering had been demonstrated in 10 Gbps based eight-channel WDM systems [51]. In this chapter, a new hybrid three-stage C- plus L-band fiber amplifier module, which is compose of two EDFAs and an SOA, over the operation range from 1540 to 1600 nm will be proposed and experimentally investigated. Moreover, we propose the gain-clamping technique on the configuration. The behavior and performance of gain clamping for this proposed amplifier have also been studied under different operation conditions.. 10.
(25) 2. 1 Principle of Operation and Theory As described in previous section, SOAs have the advantage of high on-off ration and EDFAs have advantages of good performance of the amplification in the C-band and L-band. We could use the output power of a broadband SOA to pump an EDF in order to extend the gain bandwidth from C-band to L-band. For the SOA, it will affect the extending gain bandwidth if using the smaller operating current. Thus, the bias current of the SOA is operated at maximum value to get a maximum of the extending gain bandwidth. However, the SOA suffer from the inter-channel crosstalk induced by carrier-density modulation occurring at the beat frequency of the neighbour optical carriers. Therefore, it will cause the worse noise figure. Since SOA having worse noise figure, the SOA will influence and degrade the noise figure spectra in this hybrid configuration. To improve this drawback, we could use another EDFA, putting in the front of the SOA, to provide the gain medium of low noise figure. By this way, this construction constitutes a hybrid three-stage C- plus L-band fiber amplifier module. In homogeneously broadened gain medium, the gain for all the wavelengths is only dependent on the absorption and emission cross-sections and the overlapping factor while the total population inversion is fixed by a saturation tone, which lasing at a certain wavelength. Any variation in powers of the input signals can be compensated by the properly adjusting lasing signal power. In other words, the lasing wavelength (or saturated tone) will cause the gain saturation due to the population inversion maintained. It is important to realize that even in a simple one-dimensional model of the fiber amplifier, the transverse shape of the optical mode and its overlap with the transverse Erbium ion distribution profile are important.. [50]. Therefore, each signal wavelength undergoes a constant gain through this amplification system, independent of any signal power variation resulted from channels adding or dropping. Based on this principle, we can use a fraction of out power of the hybrid three-stage C- plus. 11.
(26) L-band fiber amplifier proposed above to be the saturated tone by the backward optical feedback method for gain-clamping. According this principle described above, we proposed a new gain-clamped hybrid three-stage C- plus L-band fiber amplifier module, which is compose of two EDFAs and an SOA. The proposed configuration and experimental setup will be described in the next section.. 2.2 Proposed Configuration and Experimental Setup Figure 2-1 shows the proposed gain-clamped hybrid C- plus L-band fiber amplifier module and experimental setup. The configuration consists of three amplifier blocks and a backward optical feedback loop in the third amplifier block. First stage is an EDFA module. This module has a 10-m long EDF and a 980 nm pump laser, which has the pump power of 70 mW. The second stage is a semiconductor optical amplifier, which is biased at 260 mA bias current, and third stage is an EDFA module with a 35-m long EDF and 1480 nm pump laser of 110 mW. The isolators are used to prevent the ASE noise from spreading. The backward optical feedback loop in the third amplifier stage is constructed by a 1×2 coupler, a tunable band-pass filter (TBF), and an optical circulator (OC). The TBF can be adjusted at 1559 and 1570 nm to act as the saturated tone for clamping gain. Four different couplers, with 95, 90, 70, and 50 % coupling ratio, respectively, are used to study the effect of the power level of the saturated tone. To study the performance of this proposed amplifier module, a tunable laser source (TLS) acts as the input signal and an optical spectrum analyzer (OSA) is used to measure the gain and noise figure spectra. Traditional C- to L-band EDFA, which uses with a longer EDF to act as gain medium, can be achieved. To compare with the proposed amplifier, we construct a L-band EDFA using 100-m long EDF and 1480 nm pump laser of 160 mW. The experimental results will be. 12.
(27) discussed in the following section.. 2.3 Results and Discussion Figure 2-2 show the gain (G) and noise figure (NF) spectra of the SOA over the operation range from 1530 to 1610 nm as the input signal power is 0 and –30 dBm, respectively. As we expected, the noise figure of this SOA is worse as shown in Figure 2-2. Therefore, the SOA will influence and degrade the noise figure spectra in this proposed configuration when the first stage is neglected in this proposed hybrid amplifier. Figure 2-3 shows the gain spectra of first and third amplifier stage when the input signal power Pin is 0 and –30 dBm, respectively. From Figure 2-3, the gain spectrum of first EDFA stage is distributed at C-band and the third EDFA stage presents the gain spectrum slightly shifting to longer wavelength. The maximum peak gain of 32.5 dB (6.4 dB noise figure) is at 1556 nm for the third EDFA stage. Figure 2-4 describe the gain and noise figure spectra of the proposed hybrid amplifier module without the backward optical feedback when the input power Pin is 0, –20 and –30 dBm, respectively. Furthermore, 41 dB gain and 4 dB noise figure are achieved at 1560 nm over the bandwidth of 1540 to 1600 nm while the input signal power is –30 dBm, as shown in Figure 2-4. Figure 2-5 shows the gain and noise figure spectra of the L-band EDFA from 1540 to 1600 nm when the Pin is 0, –20 and –30 dBm, respectively. Compared with Figure 2-3 and Figure 2-5, the gain spectra of the two amplifiers are similar. However, the total length of the EDF can be reduced in the proposed hybrid amplifier. The reason is that the signal is pre-amplified through the SOA stage and thus it can reduce the EDF gain medium to get the same gain. Figure 2-6 shows the measured gain and noise figure characteristics versus the different power levels of input signal at 1550 nm while the lasing wavelength is at 1559 nm and the. 13.
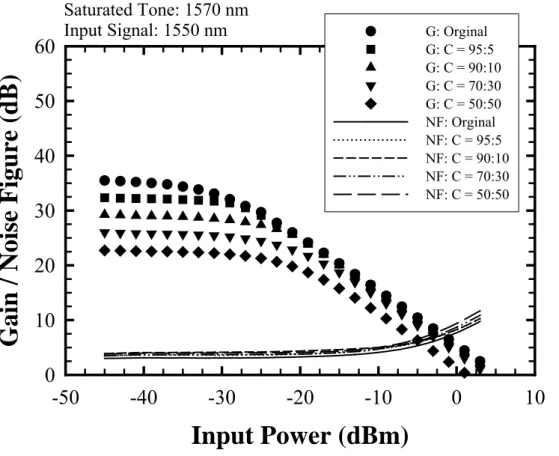
(28) input ratios of 1×2 coupler (C) is 95, 90, 70, and 50 %, respectively. The gain clamping effect cannot be observed when the input ratio of C is larger than 95 % for lasing wavelength at 1559 nm. There are only very little degradation in noise figure. This phenomenon seems better than the method using the conventional loop feedback with injected lasing signal. [43] The reason is owing to the low noise figure of the first EDFA stage and the high on-off ratio of the SOA stage. As shown in Figure 2-6, although the gain-clamped behavior of using the C of 70 % or 50% input ratio are better than those of using the C of 90% input ratio, the gains of the former are smaller than the latter. Therefore, there is a trade-off between the gain clamping and signal gain. The optimum selection shall be dependent on the operating conditions of the systems, such as the range of the power level and the wavelength of the input signal. In the case of using the 90 % input ratio coupler, the gain can be almost kept constant up to the input power of –25 dBm. Meanwhile, only less than 2.4 dB variation is observed. Thus, a dynamic range of input signal from –45 dBm to –25 dBm and the gains of > 30 dB are retrieved for this optical feedback scheme when the input signal wavelength is 1550 nm. When we change the lasing wavelength to 1570 nm, Figure 2-7 and 2-8 present the measured gain and noise figure characteristics versus the different power levels of input signal at L-band (1566 nm) and C-band (1550 nm). The gain is also clamped up to the input power of –25 dBm while the C of 90 % input ratio used for Figure 2-8. As shown in Figure 2-7 and Figure 2-8, for a dynamic range of input signal from –45 dBm to –25 dBm, the gains of > 34.3 and >27.4 dB are retrieved in this proposed scheme when the input signal wavelength is 1566 and 1550 nm, respectively. Moreover, from Figure 2-6 and Figure 2-7, it reveals the gain variation is less then 2.4 dB over the operating wavelength range and 20 dB input dynamic range, from –45 to –25 dBm. To compare the effect of the clapping among different schemes, we define clamping index (CI) as the ratio of gain variation (∆G) and average signal gain (G) :. 14.
(29) Clamping Index (CI) = ∆G / G. (4). According the definition of the CI, the gain clamping is lower at the price of signal gain and thus the clamping index is smaller. Therefore, It can be used to evaluate the effective performance by comparing the CI values of different gain clamping scheme. Now, compared with the CI before and after using the proposed clamping scheme in this chapter, the clamping indexes are 0.133 and 0.045 for with and without clamping scheme, respectively. It reveals this scheme of the gain clamping shows very well performance.. 2. 4 Summary We have proposed and experimentally demonstrated a gain-clamped hybrid stages C- to L-band fiber amplifier module over the operation range from 1540 to 1600 nm. The proposed amplifier consists of two EDFA and one SOA in cascade. Compared with traditional L-band EDFA having longer EDF length, this amplifier can effectively reduce the total EDF length Meanwhile, 41 dB gain and 4 dB noise figure are achieved at 1560 nm over the bandwidth of 1540 to 1600 nm while the input signal power is –30 dBm. Moreover, the behavior and performance of the proposed gain-clamping amplifier module over C- to L-band have been investigated experimentally under different operation conditions. Compassion with other optical amplifiers reported before, the experimental results reveal this module features not only wide gain bandwidth over C- to L-band but also low gain variation in 20 input dynamic range of the input signal power. This gain clamping scheme also has low clamping index of 0.045. This proposed module is useful in applications of the WDM networks when the input dynamic range of the signal power is from –45 to –25 dBm. We also find that there is a trade-off between the gain clamping and signal gain. Hence, to get the optimum performance, we shall well control the coupling ratio of the coupler dependent on the operating range of the. 15.
(30) signal power and wavelength.. 16.
(31) EDF OIS. TLS. C1. SOA EDF. 1480nm Pump LD 3. C3. C2. OC 2. 1. 1480nm Pump LD C1 : 980/1550 nm Coupler C2 : 1480/1550 nm WDM Coupler C3 : Optical Coupler OC : Optical Circulator SOA : Semiconductor Optical Amplifier OIS : Optical Isolator EDF: Erbium- Doped Fiber TFP: Tunable F-P Filter. TFP. Figure 2-1 Experimental setup of the proposed gain-clamped hybrid C- plus L-band fiber amplifier module. 17.
(32) Gain / Noise Figure (dB). 18 G: Pin = 0 dBm G: Pin = -30 dBm NF: Pin = 0 dBm NF: Pin = -30 dBm. SOA. 15 12 9 6 3 0 1520. 1540. 1560. 1580. 1600. 1620. Wavelength (nm). Figure 2-2 Gain and noise figure spectra of an SOA in the operating range from 1530 to 1630 nm. The probe input signal power Pin is 0 and –30 dBm, respectively.. 18.
(33) 50. Gain (dB). 40. 20. 15. 30 10 20 5. 10 0 1500. 1520. 1540. 1560. 1580. Noise Figure (dB). 1st Stage (G): Pin = 0 dBm 1st Stage (G): Pin = -30 dBm 3rd Stage (G): Pin = 0 dBm 3rd Stage (G): Pin = -30 dBm 1st Stage (NF): Pin = 0 dBm 1st Stage (NF): Pin = -30 dBm 3rd Stage (NF): Pin = 0 dBm 3rd Stage (NF): Pin = -30 dBm. 0 1600. Wavelength (nm) Figure 2-3 Gain spectra of the first and third amplifier stages. The signal power of the probe Pin is 0 and –30 dBm, respectively.. 19.
(34) G: Pin = 0 dBm G: Pin = -20 dBm G: Pin = -30 dBm NF: Pin = 0 dBm NF: Pin = -20 dBm NF: Pin = -30 dBm. 50. Gain / Noise Figure (dB). 40 30 20 10 0 1520. 1540. 1560. 1580. 1600. 1620. Wavelength (nm) Figure 2-4 Gain and noise figure spectra of the proposed hybrid amplifier module without the backward optical feedback when the input power Pin is 0 and –30 dBm, respectively. 20.
(35) 50. Gain / Noise Figure (dB). G: Pin = 0 dBm G: Pin = -20 dBm G: Pin = -30 dBm NF: Pin = 0 dBm NF: Pin = -20 dBm NF: Pin = -30 dBm. 40 30 20 10 0 1520. 1540. 1560. 1580. 1600. 1620. Wavelength (nm). Figure 2-5 Gain and noise figure spectra of conventional L-band EDFA with an EDF of 100 m long and a 1480 nm pump laser of 160 mW. 21.
(36) Gain / Noise Figure (dB). 60. Saturated Tone: 1559 nm Input Signal: 1550 nm. G: Orginal G: C = 95:5 G: C = 90:10 G: C = 70:30 G: C = 50:50 NF: Orginal NF: C = 95:5 NF: C = 90:10 NF: C = 70:30 NF: C = 50:50. 50 40 30 20 10 0 -50. -40. -30. -20. -10. 0. 10. Input Power (dBm) Figure 2-6 Gains and noise figures versus the different power level of input signal at 1550 nm while the lasing wavelength at 1559 nm, and the input ratio of C is 95, 90, 70 and 50 %, respectively. 22.
(37) Gain / Noise Figure (dB). 60. Saturated Tone: 1570 nm Input Signal: 1566 nm. G: Orginal G: C = 95:5 G: C = 90:10 G: C = 70:30 G: C = 50:50 NF: Orginal NF: C = 95:5 NF: C = 90:10 NF: C = 70:30 NF: C = 50:50. 50 40 30 20 10 0 -50. -40. -30. -20. -10. 0. 10. Input Power (dBm) Figure 2-7 Gains and noise figures versus the different power level of input signal at 1566 nm while the lasing wavelength at 1570 nm, and the input ratio of C is 95, 90, 70 and 50 %, respectively. 23.
(38) Gain / Noise Figure (dB). 60. Saturated Tone: 1570 nm Input Signal: 1550 nm. G: Orginal G: C = 95:5 G: C = 90:10 G: C = 70:30 G: C = 50:50 NF: Orginal NF: C = 95:5 NF: C = 90:10 NF: C = 70:30 NF: C = 50:50. 50 40 30 20 10 0 -50. -40. -30. -20. -10. 0. 10. Input Power (dBm) Figure 2-8 Gains and noise figures versus the different power level of input signal at 1550 nm while the lasing wavelength at 1570 nm, and the input ratio of C is 95, 90, 70 and 50 %, respectively. 24.
(39) Chapter 3 Simultaneously Gain-Clamped and Gain-Flattened Technique for EDFA. An advantage of optical amplifiers is that they can be used to amplify several communication channels simultaneously as long as the bandwidth of the multi-channel is smaller than the amplifier bandwidth. Even though the gain spectrum of an EDFA is relatively broad, the gain profile is far from uniform over a wide wavelength range and input dependent. This problem would become quite severe in long-haul system employing a cascade chain of EDFAs. Therefore, the gain flatness and gain-clamped functions are simultaneously needed for EDFAs dynamic working on dense wavelength-division-multiplexing networks. Many gain spectrum equalization and gain stabilizing techniques have been studied. Using the concatenation of Erbium-doped fiber with different codopants [43], multiple side-tap gratings[36], and Mach-Zehnder interferometer (MZI). [48]. , have been reported to compensate. for the variations in the gain profile. In this chapter, we present a simple gain profile control technique based on an EDFA with a backward injected light from Fabry-Perot laser diode (FP-LD). The simultaneously gain-flattened and gain-clamped profile has also been demonstrated experimentally.. 25.
(40) 3.1 Principle of Operation and Theory The total population inversion in the homogeneously broadened gain medium is fixed if this gain medium is lasing at a wavelength. Consequently, the gain for all the wavelengths is only decided by the overlapping factor and the absorption and emission cross-sections. We can use this principle to cause the gain saturation in order to clamp the gain of the Erbium-doped fiber amplifier. In order words, the gain can be clamped at the desired level by clamping the average population inversion in the amplifier. Furthermore, because the bandwidth of saturated tone will affect the level of population inversion in the amplifier, we can inject multiple saturation tones into the gain medium to broadly clamp the average inversion over a wide spectrum and thus realize to flat the gain profile. Because of the Fabry-Perot laser diode featuring multiple longitudinal modes, we use Fabry-Perot laser diode to as a probe source. Then we inject this probe source into the Erbium-doped fiber amplifier to simultaneously suppress the gain variation and improve the gain flatness. Due to the homogeneously broadened gain characteristics, the multi-wavelength input signal in WDM system can be simulated by a saturation tone with the power which equals to the aggregated power of multi-wavelength input signal [52]. Therefore, the output gain profile can be measured by a probe light source with tuneable wavelength. In the following section, we will describe the proposed configuration and the experimental setup.. 3.2 Proposed Configuration and Experimental Setup Figure 3-1 shows the proposed and experimental set-up for the simultaneously gain-flattened and gain-clamped EDFA system. This proposed EDFA system consists of an isolator (OIS), a circulator (OC), a 980/1550 nm WDM coupler, a 980 nm pump laser and a. 26.
(41) multi-longitudinal-mode FP-LD. Through an optical circulator, the output power of the FP-LD light is backward injected into the EDFA system. This EDFA module is mainly composed by an 8 m long EDF, a 980 nm/ 1550 nm WDM coupler and a 980 nm pump laser. The pumping configuration of the EDFA module is copropagating pump with. pumping. power of 140 mW. To analyse the gain spectra of this EDFA module, we utilized simulation software with the related parameters as described above. This proposed EDFA module is used in a 40-channel DWDM system. The channel spacing of input signals is 100 GHz from 1528 nm to 1560 nm. The simulated DWDM 40-channel input signals have total input powers of –1, –6 and –11 dBm to simulate three different input levels for WDM signals. The central wavelength of the spectral of the FP-LD is at 1533.5 nm and its longitudinal-mode-spacing is 0.8 nm. The 20 dB bandwidth of this FP-LD is 10 nm, and its aggregated power is –3 dBm. As described in the previous section, the multi-wavelength input signal in WDM system can be simulated by a saturation tone with the same aggregated power. A distributed feedback (DFB) laser and a tuneable laser source (TLS) are employed to act as the saturation tone and the probe light, respectively. By tuning the output wavelength of the TLS, we can measure the gain spectra from the optical spectrum analyser. We measure the gain spectra with the various input power levels of DFB laser of –1, -6 and -11 dBm. A FP-LD, which has the output power of –3 dBm and the central wavelength at 1533.5 nm when the operating current of FP-LD is 40 mA, has been chosen to act as the injection light source.. 27.
(42) 3.3 Results and Discussion The simulation results are shown in Figure 3-2. When no injection light is added, The gain of this EDFA system range gain ranging from 21.1 dB to 31 dB at 1532 nm over the input power ranging from –1 dBm to –11 dBm and the operating wavelength window between 1528 to 1560 nm. Even though the input power level is the same, the gain spectrum is non-flat as shown in Figure 3-2. The 11.1 dB gain variation ranging from 31 dB to 20 dB can be seen at the input power of –11 dBm over 1528 to 1560 nm wavelength. When the input power is –1 dBm, the gain varies 21.1 dB from 21.1 dB to 15.5 dB over the same wavelength. The Figure 3-2 also shows there are a maximal gain variation of 9.9 dB and a maximal gain flatness of 11.1 dB over the input power ranging from –1 dBm to –11 dBm and the hole operating wavelength. After adding a –3 dBm single-wavelength injection light at 1533.5 nm, this EDFA module can provide the gain spectra, as shown in Figure 3-2, to possess gain-clamped characteristics. The 2.2 dB gain variation can be achieved for the dynamic range of the input power from –1 dBm to –11 dBm. However the gain spectra is still lack of gain-flattened profile. The worst gain flatness in the operation window form 1528 nm to 1560nm is 4.5 dB for the input power from –1 dBm to –11 dBm. Moreover, the signal gain is reduced by 12 dB to 2.5 dB. It seems the gain clamping is at the price of the signal gain. This is owing to the depletion of the gain , caused by the injection saturation tones. The simulated gain profiles of this EDFA system are indicated in Figure 3-2 when a FP-LD with multi-tone spectral structure is employed to inject into the EDFA module. For the input power from –1 dBm to –11 dBm and the wavelength window ranging from 1528 nm to 1560 nm, the maximal gain variation can be suppressed to 0.5 dB and the gain flatness can also be kept less than 1.6 dB. Just as the same those of the single-wavelength injection, this is. 28.
(43) at the price of the signal gain. The simulation results present the gain spectra of the EDFA can be simultaneously gain-flattened and gain-clamped by the proposed active control technique. The experimental results are indicated in Figure 3-3. Figure 3-3 shows the gain profiles measured for saturated input power levels of –1, -6 and –11 dBm without the injected FP-LD light, and represents the corresponding gain spectra with the FP-LD light injection. It is clear that the gain variation is suppressed from 10.8 dB to 1.1 dB for an input power change of 10 dB, from -1 dBm to –11 dBm, and the maximal gain flatness is reduced from 11.6 dB to 2.0 dB over the operating wavelengths of 1528 nm to 1560 nm after adding the FP-LD light. Moreover, the gain variations are 1.4, 2.0 and 2.0 dB, respectively, for the input power levels of –1, -6 and –11 dBm. In general, the noise figure will be degraded when the saturated tone, which saturates the gain value, injects into the EDFA module [40]. In the experimental results, the noise figure degrades approximately to ~1.7 dB over the bandwidth of 1528 to 1560 nm while the injection light injected into the EDFA module. The experimental results are almost coincident with those of the simulation. We can use the average signal gain and gain variation to calculate CI as defined in previous chapter, the clamping indexes are 0.49 and 0.11 for with and without clamping scheme using multiple tone injection, respectively. This show there is approximately larger than 70% improved in gain clamping.. 3.4 Summary We have proposed and demonstrated an active control technique to simultaneously provide gain-flattened and gain-clamped spectra for the Erbium-doped fiber amplifier by injecting a Fabry-Perot (F-P) laser light into this EDFA. For a demonstration, this EDFA module can simultaneously reduce gain variation from 10.8 dB to 1.1 dB for 10 dB change of. 29.
(44) the input power and lower down gain flatness from 11.6 dB to 2.0 dB over the operating wavelength range between 1528 nm to 1560 nm. The only drawback of this proposed control technique is at expensive price of the signal gain. Thus this control technique would be suitable for the application with small-gain and sensitive to stability and equalization of the gain, such as metropolitan network.. 30.
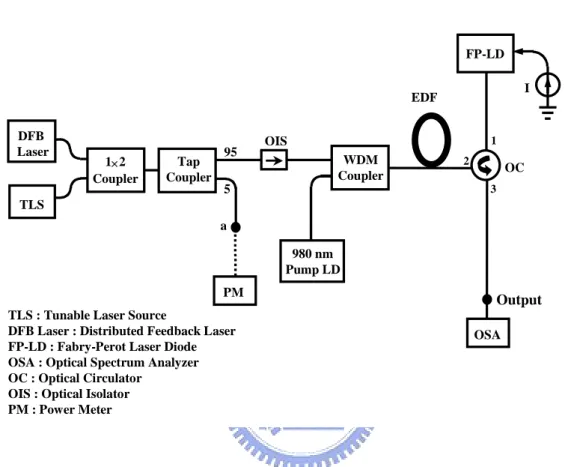
(45) FP-LD I. EDF DFB Laser. 1× 2 Coupler. Tap Coupler. 95. OIS. 1. WDM Coupler. 5. 2. OC 3. TLS a 980 nm Pump LD PM. Output. TLS : Tunable Laser Source DFB Laser : Distributed Feedback Laser FP-LD : Fabry-Perot Laser Diode OSA : Optical Spectrum Analyzer OC : Optical Circulator OIS : Optical Isolator PM : Power Meter. OSA. Figure 3-1 Proposed and experimental setup for the simultaneously gain-flattened and gain-clamped EDFA system. 31.
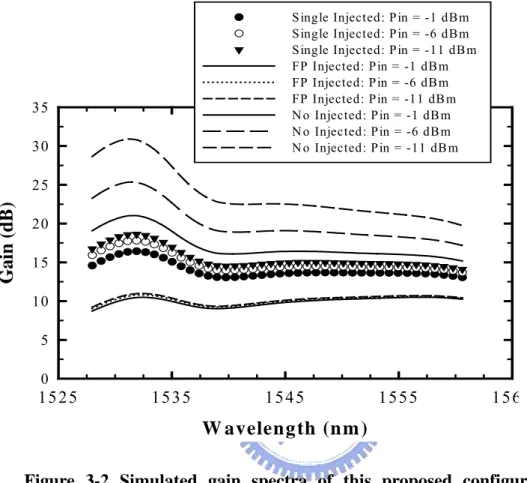
(46) Single Injected: Pin = -1 dB m Single Injected: Pin = -6 dB m Single Injected: Pin = -11 dB m FP Injected: Pin = -1 dB m FP Injected: Pin = -6 dB m FP Injected: Pin = -11 dB m N o Injected: Pin = -1 dB m N o Injected: Pin = -6 dB m N o Injected: Pin = -11 dB m. 35 30. Gain (dB). 25 20 15 10 5 0. 15 25. 153 5. 154 5. 1555. 156. W avelength (nm ) Figure 3-2 Simulated gain spectra of this proposed configuration for no injected light, the injection lights of a single tone of –3 dBm at 1533.5 nm and multiple tones of –3 dBm generated from the FD-LD with a central wavelength at 1533.5 nm when three different input levels of –1, -6 and –11 dBm are operated. 32.
(47) z | T. 35 30. Gain(dB). 25. Orginal: Pin =Pin= -1 dBm No Injected: -1dBm No -6 dBm No Injected: Injected: Pin Pin== -6dBm No -11 dBm No Injected: Injected: Pin Pin== -11dBm Injected: Pin= -1dBm No Injected: Pin = -1 dBm Injected: Pin Pin== -6dBm Injected: -6 dBm Injected: Pin= Injected: Pin = -11dBm -11 dBm. 20 15 10 5 0. 1520. 1530. 1540. 1550. 1560. 15. Wavelength(nm). Figure 3-3 Measured gain spectra of this experimental setup in Figure 3-1 for no injected light, and –3 dBm injected FP-LD light with a central wavelength at 1533.5 nm over three saturated input levels of –1, -6 and –11 dBm. 33.
(48) Chapter 4 Gain-Clamping Technique for EDWA. For Metro applications, there is a strong motivation to reduce the size and cost of EDFAs through miniaturization and improved packaging. One possibility is to use Erbium-doped waveguide amplifiers (EDWAs), which can be constructed in arrays and integrate many functions in a cost effective manner, automating many of the tasks now currently required to assemble an EDFA. Recently, some Erbium-doped waveguide amplifiers have been proposed and investigated. [53], [54] EDWAs have the advantages of the EDFAs, such as a low noise figure and low polarization dependence. In addition, the concentration of Erbium in an EDWA is approximately 10 to 20 times higher than that of an EDFA. Therefore, EDWAs can generate a high gain in a very short optical path. The gain spectrum of the EDWA depends on Erbium energy level populations in a very sensitive way because these populations change as a result of the change in the stimulated rates. Due to this nature of their Erbium-doped waveguides, the gain profiles of EDWAs exhibit input-dependent behavior. However, a stable gain against variations in input signal power is a critical issue for WDM networks. When channels are added or dropped, the resulting increase or decrease in the power spectrum will alter the gain profile of the Erbium-doped waveguide amplifiers. Therefore, gain-clamped functions are. 34.
(49) severely required for EDWAs. As mentioned in previous chapters, there are several gain-clamping techniques applying on EDFA have been reported, such as the all-optical gain-clamped method [55], and the use of fiber Bragg grating (FBG) filters [56] or tunable bandpass filters [57]. In this chapter, we present a gain-clamped C-band EDWA module using forward optical feedback with a FBG over the operating bandwidth from 1530 to 1560 nm. The gain-clamped behavior and performance of the module have been experimentally investigated under different operating conditions.. 4.1 Principle of Operation and Theory Theoretically, the gain for all the wavelengths is only dependent on the absorption and emission cross sections and the overlapping factor for the homogeneously broadened gain medium, if the total population inversion is fixed by lasing at a certain wavelength. This means the lasing signal, saturated tone, will cause the gain saturation due to the population inversion, which is maintained. Therefore, any variation in input signal power can be compensated by the properly adjusting lasing signal power. As a result, each signal wavelength experiences a constant gain through this amplification system, independent of any signal power variation caused by the operation such as channel adding or dropping. On the basis of this principle, we can construct an optical feedback loop from the output port of the EDWA and tap the fraction of the output signal as the lasing signal at a fixed wavelength. This lasing signal induces the necessary population inversion and clamps the gain profile of EDWA. The selection of the wavelength of the saturation tone could be used optical filter, such as Fiber Fabry-Perot (FFP) filter, or tunable bandpass filters (TBFs). In addition, the fiber Bragg grating (FBG) is a more attractive technique to apply on the WDM networks due to the. 35.
(50) nature of creating grating on fiber. These gratings couple the forward-propagating core mode to backward-propagating guide mode. Only the wavelength coinciding with the Bragg condition can be reflected. By the fiber Bragg grating, we can easy select a wavelength of the saturation ton for gain clamping. The proposed gain-clamped EDWA module and experimental setup will be discussed in the following section.. 4.2 Proposed Configuration and Experimental Setup A gain-clamped EDWA module using forward optical feedback with a FBG over the wavelengths of 1530 to 1560 nm is proposed and shown in Figure 4-1. The structure consists of an EDWA, two 1x2 couplers, a variable optical attenuator (VOA), a circulator and a fiber Bragg grating. The 10:90 coupler and the circulator (C1) are used to construct the optical feedback loop. The fiber Bragg grating is applied to lase a saturated tone for clamping the gain value. The central wavelength of its reflected spectrum is at 1541 nm. The output signal of the EDWA is propagated through the circulator into the fiber Bragg grating. Then, the signal at the wavelength of 1541 nm is reflected by the fiber Bragg grating. Meanwhile, the reflective signal is propagated through the circulator into the optical feedback loop and acts as the saturated tone. The variable optical attenuator is used for controlling the power level of the saturated tone and studying the behavior of the proposed amplifier under power variations of the saturated tone. The EDWA module shown in Figure 4-1 features 4.5 dB noise figure over the entire C-band, 15 dB small signal-gain, and 12 dBm output power when the double-pump scheme is used. The EDWA is pumped by a pumping LD with wavelength of 980 nm at pumping current of 440 mA. In addition, optical isolators can reduce backward amplified spontaneous emission and improve noise figure performance. In view of compactness and functionality,. 36.
(51) fiber wavelength division multiplexers (FWDMs), a pump kill filter, an uncooled laser pump and optical isolators are attached directly to the EDWA module. Therefore, the size of this packaged stage is only about 40 cm3 and is 1/5 the typical size of EDFA. To determine the behavior of the proposed amplifier module, a tunable laser source is used to probe its gain and noise figure spectra, which are observed using an optical spectrum analyzer.. 4.3 Results and Discussion The reflected spectrum of the FBG used at 1541 nm is shown in Figure 4-2. The reflection of FBG at wavelength of 1541nm is approximate 98%, and the reflected bandwidth at 3 dB is 0.4nm, respectively. Figure 4-3 presents the gain and noise figure spectra of the EDWA module without gain clamping, over the wavelength range of 1530 to 1560 nm, when the input signal power levels are –10, –13, –16, and –20 dBm. The maximum variation of the gain occurs at the wavelength of 1530 nm and the variation is 7 dB. On the other hand, the minimum variation of the gain happens at the wavelength of 1560 nm and the variation is 3 dB. The noise figures are between 5.1 to 7.2 dB over the input power ranging from –10 dBm to –20 dBm and the operating wavelength window between 1530 to 1560 nm. The gain spectra, as shown in Figure 4-4, are clamped with the input signal power levels of –10, –13, –16 and –20 dBm, respectively when a FBG is used in the proposed setup with different power levels of saturated tones. As shown in Figure 4-4, the minimum gain variation is 0.3 dB at 1550 nm when the input power is varied to –10, –13, –16 and –20 dBm, respectively. Furthermore, the noise figures are not be degraded compared with original EDWA, shown in Figure 4-3, as a saturated tone is injected into the amplifier module. The variations of the noise figure are less than 0.6 dB over the wavelength range of 1530 to 1560 nm. These results are also observed in Figure 4-5 and Figure 4-6. The clamping effect seems. 37.
(52) not to work well around the wavelength of 1535 nm resulted from inhomogeneous nature of EDWA. Figure 4-5 presents the gain and noise figure spectra for the proposed configuration over the wavelength range of 1530 to 1560 nm for the input power is varied to –10, –13, –16, and –20 dBm, respectively, when the power levels of saturated tones are attenuated at 7 dB. The minimum gain variation is 0.3 dB at 1550nm as shown Figure 4-5. The experimental results are shown in Figure 4-6 when the power levels of saturated tones are attenuated at 10 dB. The minimum gain variation is 0.9 dB at 1560 nm when the attenuation of the optical feedback loop is 10 dB. The experimental results shown in Figure 4-6 reveal the gain-clamping effect is degraded. Except the region around wavelength of 1535 nm, the reason would be the population inversion of the EDWA is hardly maintained by the power of saturated tones anymore. Comparing Figure 4-4 to Figure 4-6, we observe that the power level of the saturated tone influences the gain-clamped performance of the proposed EDWA module. As mentioned in prevision section, if the total population inversion in an homogeneously broadened gain medium is fixed by lasing action at a wavelength, the gain for all the wavelengths are only dependent on their absorption and emission cross sections and the overlapping factor. However, the degree of the population inversion will be affected by the power level of saturated tone. Thus, this phenomenon mentioned above might due to the different amounts of population inversion caused by the different power levels of the saturated tone. The gain-clamped performance could possibly be improved when the power levels of saturated tones are properly selected. From the experimental results, the proposed EDFA module showed a good gain-clamping performance when the attenuation of the optical feedback was well controlled. We can use the average signal gain and gain variation to calculate clamping index as defined in chapter 2, the clamping indexes are 0.231 and 0.024 for with and without clamping. 38.
(53) scheme, respectively. It reveals there is approximately larger than 85% improved in gain clamping.. 4.4 Summary In summary, a gain-clamped EDWA module using forward optical feedback with a fiber Bragg grating over the wavelengths of 1530 to 1560 nm is proposed and experimentally demonstrated. When a 10 dB variation of input signal power from –10 to –20 dBm is applied, the minimum gain variation approaches 0.3 dB at the 5 dB optical feedback attenuation over the operating range (1530 to 1560 nm). Moreover, This gain clamping scheme also has low clamping index of 0.024. The gain and noise figure spectra also show the good performance when 10 dB dynamic range of input power is applied to the module. The degree of the population inversion will be affected by the power of saturated tone. By well controlling the attenuation of the optical feedback, the proposed EDFA module showed a good gain-clamping performance. Therefore, the proposed gain-clamped EDWA module can be used to function as the in-line amplifier, pre- or post amplifier in optical WDM systems.. 39.
(54) EDWA Module Circulator Isolator. Isolator. 90. C1. w1. A. F. 10. FBG. 980 nm Pump LD. 95. C2 5. VOA A: Amplification F: Pump Kill Filter VOA: Variable Optical Attenuator FBG: Fiber Bragg Filter C1,C2 : 1x2Coupler W1: 980/1550nm WDM Coupler OSA: Optical Spectrum Analyzer. OSA. Figure 4-1 Experimental setup of the proposed gain-clamped EDWA module. 40.
(55) 5. Reflectivity (dB) Reflection (dB). FBG: 1541.00 nm. -5 -15 -25 -35 -45 1540.0. 1540.5. 1541.0. 1541.5. Wavelength (nm) Figure 4-2 Reflected spectrum of FBG used at 1541 nm. 41. 1542.0.
(56) G: Pin = -10 dBm G: Pin = -13 dBm G: Pin = -16 dBm G: Pin = -20 dBm NF: Pin = -10 dBm NF: Pin = -13 dBm NF: Pin = -16 dBm NF: Pin = -20 dBm. Gain / Noise Figure (dB). 35 Original. 30 25 20 15 10 5 0 1525. 1535. 1545. 1555. 1565. Wavelength (nm). Figure 4-3 Gain and noise figure spectra of the EDWA module without gain clamping, over wavelength range of 1530 to 1560 nm, when input signal power levels are –10, –13, –16 and –20 dBm. 42.
(57) G: Pin = -10 dBm G: Pin = -13 dBm G: Pin = -16 dBm G: Pin = -20 dBm NF: Pin = -10 dBm NF: Pin = -13 dBm NF: Pin = -16 dBm NF: Pin = -20 dBm. Gain / Noise Figure (dB). 35 30. 5 dB Attenuation. 25 20 15 10 5 0 1525. 1535. 1545. 1555. 1565. Wavelength (nm). Figure 4-4 Gains and noise figures for the proposed structure in wavelength range of 1530 to 1560 nm, when the power level of the saturated tone is attenuated at 5 dB. 43.
(58) G: Pin = -10 dBm G: Pin = -13 dBm G: Pin = -16 dBm G: Pin = -20 dBm NF: Pin = -10 dBm NF: Pin = -13 dBm NF: Pin = -16 dBm NF: Pin = -20 dBm. Gain / Noise Figure (dB). 35 30. 7 dB Attenuation. 25 20 15 10 5 0 1525. 1535. 1545. 1555. 1565. Wavelength (nm) Figure 4-5 Gains and noise figures for the proposed structure in wavelength range of 1530 to 1560 nm, when the power level of the saturated tone is attenuated at 7 dB. 44.
(59) G: Pin = -10 dBm G: Pin = -13 dBm G: Pin = -16 dBm G: Pin = -20 dBm NF: Pin = -10 dBm NF: Pin = -13 dBm NF: Pin = -16 dBm NF: Pin = -20 dBm. Gain / Noise Figure (dB). 35 10 dB Attenuation. 30 25 20 15 10 5 0 1525. 1535. 1545. 1555. 1565. Wavelength (nm) Figure 4-6 Gains and noise figures for the proposed structure in wavelength range of 1530 to 1560 nm, when the power level of the saturated tone is attenuated at 10 dB. 45.
(60) Chapter 5 Hybrid S- to C- Band Optical Fiber Amplifiers. Conventionally, the application of EDFA and EDWA is still focused on the C-band (1530 to 1560 nm) optical communication networks. However, the communication using in S-band is more interested (1450 to 1530 nm) in the pass years when the triple-play services, which are voice, data, and video services, are delivered in the broadband networks. For example, the basic band of the downstream signal in broadband optical access systems based on passive optical networks (B-PON) is from 1480 to 1500 nm as specified in requirement ITU-T. G.983.1. by. Telecommunication. Standardization. Sector. of. International. Telecommunication Union [58]. The S-band has emerged as the third communication band with which to increase capacity. [59]. . Therefore, how to extend the gain bandwidth from C-band to. S-band is an attractive research currently. Several amplifiers have been developed to amplify S–band signals. These are the discrete fiber Raman fiber amplifier (RFA) fluoride-based thulium-doped fiber amplifiers (TDFA). [60], [61]. ,. [62], [63]. , a hybrid amplifier with a. dispersion compensating Raman fiber amplifier (RFA) and an Erbium-doped fiber amplifier [64]. . A new S-band amplification technique, which utilizes Erbium-doped silica fiber with. depressed cladding design and 980 nm pump laser to generate EDF gain extension effects, has. 46.
(61) been reported [65], [66], [67]. This makes it possible that by constructing with a new S-band EDFA and Erbium-doped waveguide amplifier module, it could retrieve the wide gain bandwidth from S- to C-band. In this chapter, we have proposed and experimentally demonstrated a coupled-structure S- to C-band optical fiber amplifier with 94 nm gain bandwidth of 1476 to 1570 nm. Moreover, the performance and behavior of this proposed hybrid optical fiber amplifier module has also been studied.. 5.1 Principle of Operation and Theory The key principle of this research is to combined C-band EDWA and S-band EDFA to construct a S- to C-band optical amplifier with a coupled-structure. The signals spreading over S-band and C-band will be separated through a 1480/1550 nm WDM coupler and propagated into the S-band EDFA C-band EDWA, respectively. Then, the signal in S-band is amplified by S-band EDFA. Meanwhile, the signal over C-band is amplified through the EDWA. The output signals of the S-band EDFA and C-band EDWA are multiplexed by another 1480/1550 nm WDM and propagated in another output port of the WDM. By this design, it can be achieved to simultaneously amply S- to C-band signals. The proposed S- to C-band optical amplifier module and the experimental setup will be described in the following section.. 5.2 Proposed Configuration and Experimental Setup The experimental setup for the wide band optical amplifier module from S- to C-band by using a coupled-structure is shown in Figure 5-1. This configuration is constructed by two. 47.
數據

+7


相關文件
Without using ruler, tearing/cutting of paper or drawing any line, use the square paper provided (Appendix A) to fold the figure with the same conditions as figure 8b, but the area
Each unit in hidden layer receives only a portion of total errors and these errors then feedback to the input layer.. Go to step 4 until the error is
Microphone and 600 ohm line conduits shall be mechanically and electrically connected to receptacle boxes and electrically grounded to the audio system ground point.. Lines in
Variable gain amplifier use the same way to tend to logarithm and exponential by second-order Taylor’s polynomial.. The circuit is designed by 6 MOS and 2 circuit structure
Abstract - A 0.18 μm CMOS low noise amplifier using RC- feedback topology is proposed with optimized matching, gain, noise, linearity and area for UWB applications.. Good
Wang, Solving pseudomonotone variational inequalities and pseudocon- vex optimization problems using the projection neural network, IEEE Transactions on Neural Networks 17
Define instead the imaginary.. potential, magnetic field, lattice…) Dirac-BdG Hamiltonian:. with small, and matrix
In the following we prove some important inequalities of vector norms and matrix norms... We define backward and forward errors in
