國立交通大學
材料科學與工程學系奈米科技碩士班
碩士論文
以奈米表面探討巨噬細胞和泡沫細胞的功能
及活化表現
Characterization of nanotopographical effects on macrophage
and foam cell behavior in function and activation
研 究 生:陳家偉
學 號:9752518
指導教授:黃國華 教授
以奈米表面探討巨噬細胞和泡沫細胞的功能及活化表現
Characterization of nanotopographical effects on macrophage
and foam cell behavior in function and activation
研 究 生:陳家偉 Student: Chia-Wei Chen
指導教授:黃國華 Advisor: Dr. Guewha Steven Huang
國 立 交 通 大 學
材料科學與工程學系奈米科技碩士班
碩 士 論 文
A Thesis
Submitted to Institute of Material Science and Engineering Graduate Program for Nanotechnology
National Chiao Tung University in partial Fulfillment of the Requirements
for the Degree of Master
in
Institute of Material Science and Engineering Graduate Program for Nanotechnology July 2010
Hsinchu, Taiwan, Republic of China
中華民國九十九年九月
誌 謝
滿紙荒唐言,一把辛酸淚。都云作者癡,誰解其中味? 來到交大兩年中,曾經滿 懷壯志的想有一番創新,也曾沮喪落魄的興起不如歸去的念頭,箇中甘苦如人飲 水,冷暖自知。然走過風風雨雨,越能明顯發現自己的成熟的蛻變,不論在實驗 上或是為人處事上。首先感謝黃老師這一路走來,不離不棄的指導,沒有你的真 知和卓見的指導,就沒有這篇論文。也感謝你常和我們分享你的卓越的見地和為 人處事的道理,讓我在除了專業領域上的涉獵以外,更能適應社會中的千奇百態, 我將會銘記於心。感謝師母洪孟燕,你總是把我們當成自己小孩般的細心苛護, 時時耳提面命的囑咐我們做人做事皆當有所為,有所不為,讓身處異鄉的我們, 不至於讓心偏差了方向。謝謝洪醫師,總是在百忙之中撥冗來實驗室指導後進, 並不嗇的分享豐富的人生歷練,你的幽默、風趣及健談總是使得報告的氣氛不致 煩悶,在實驗上的提攜與指導,更是讓我獲益良多。 獨學而無友,則孤陋而寡聞。在這漫長的七百多天的日子,若沒有一群滿腔熱血的 學長和同學的支持,還真不知該怎麼捱過來。謝謝敘安在實驗上的幫忙,在徬徨 無助時,你總是雪中送炭的幫我借儀器及給于我實驗的指導,雖然有時讓人感覺 嚴格,但是很受用,祝福你趕緊找到你的Miss Right。感謝小馬、阿書、小明、 小孟學長們在我碩一懵懵懂懂的日子裡,扮演著汪海中明燈的角色,不遺餘力的 付出及時時鼓勵,讓我得以划向光明的一方,在課後休閒時,更是在球場上奔馳 的好夥伴,讓我得以將辜躁乏味的實驗暫且拋諸腦後,將汗水盡情揮灑於球場, 祝福你們役畢後能找到更寬廣的天空。在這兩年期間,很慶幸的有順華、佳慧、 玉蘋、洪寧及老師女兒婷婷的鼎力幫忙,在課業上總是相互討論,讓跨領域的大 家得以迅速的吸收更廣泛的知識,在生活上的互相照料,更讓離鄉背井的我不致 寂寞,這份情誼我會永遠的放在心上。感謝孟哲、宗翰和秋淵學弟,在實驗繁忙 時總是給于不論是精神上或是實質上的支援,期許你們秉持著任重而道遠的信念, 一步一腳印的把實驗室壯大起來,祝福你們百尺竿頭,更進一步。另外也希望新生 Mohi、威豪、思孟、思函、嘉佑能盡快步上軌道找到實驗的方向,祝福你們未 來實驗順利,早點完成碩士論文。感謝其他實驗室的成員世強,你總是在球場上 充當我的靶子,讓我可以更精進球技;以倫,從你這邊了解到許多在製程上的知 識,希望你能更樂天些;朝俊,祝福你早日脫離苦海;澔文、邱胖,祝你們早日 取得博士學位。謝謝大學及多年好友們的鼓勵與幫忙,雖然大家不在同一城市中 奮鬥打拼,然你們的打氣加油卻讓我感到天涯若比鄰般的窩心,遇到挫折時能越 挫越勇,心領了。 最後謝謝陳爸爸、陳媽媽的包容與體諒,這陣子發現你們的白髮又悄然的增加了, 若沒有你們全力的支持,無條件的付出,讓我能在這兩年中全力以赴,無後顧之 憂,相信也沒有這篇論文了。此外,謝謝最敬愛的爺爺,雖然你已不在人世,但 是你對我的期盼和教誨我會謹遵於心。 登高必自卑,行遠必自邇。碩士論文的完成只是個人邁向社會的起步,然我會秉持 著交大校訓「飲水思源」的精神,以如臨深淵,如履薄冰的態度在往後的日子裡, 為國家奉獻所長,替社會盡一份棉薄之力。
以奈米表面探討巨噬細胞和泡沫細胞的功能及活化表現
學生:陳家偉 指導教授:黃國華 教授
國立交通大學材料科學與工程學系奈米科技碩士班
碩士論文
摘 要
巨噬細胞在人體的功能調控上扮演著很重要的角色,而由其分化出來的泡沫 細胞更是動脈血管硬化的主要成因。在生物醫學蓬勃發展的現在,許多的人工植 入物也已經被設計出來。所以考慮人工植入物表面和巨噬細胞及泡沫細胞間的交 互作用情形是一個很重要的議題。本研究主要利用矽基板製備出 10-nm 到 200-nm 奈米的奈米點表面,而後取下小白鼠腹水中的巨噬細胞養於奈米表面上,並進一 步以低密度脂蛋白分化為泡沫細胞。 在型態的實驗中發現各尺寸中巨噬細胞和泡沫細胞的貼覆面積跟 Flat 相比, 巨噬細胞在 10-nm、50-nm、100-nm 表面各別增加了 6.17%、25.70%、9.63%,而 200-nm 表面則是減少了 14.74%並有似凋亡的現象產生。而泡沫細胞在 10nm、50nm 表面則是分別增加了 7.11%、12.4%,而 100-nm、200-nm 則是減少了 6.5%、7.8%, 我們推斷 50-nm 表面對於巨噬細胞及泡沫細胞有較佳的生物相容性,200nm 表面則 為較差的生物相容性。根據螢光染色的結果分析,vinculin 的表現量也以 50-nm 為最多,和 200-nm 則是相對表現量較少,可以推論 50-nm 表面可能可以促進巨噬 細胞及泡沫細胞的貼覆及骨架分布。而 200-nm 表面則抑制了細胞的貼覆及骨架的 分布。由細胞觸角長度的統計圖可得知巨噬細胞及泡沫細胞以 100-nm 和 200-nm們固有的免疫功能。之後我們去做細胞密度的測試,發現巨噬細胞及泡沫細胞相 對於 Flat,在 50-nm 表面上有較高的細胞密度,而 200-nm 較少,則此與我們先前 推論 50-nm 表面對於巨噬細胞及泡沫細胞有較佳之相容性一致。 在基因的實驗方面,我們利用 RT-PCR 來檢視巨噬細胞及泡沫細胞在各尺寸的 基因表現。結果顯示出在發炎基因方面,以 100-nm 及 200-nm 對於巨噬細胞產生 較嚴重的發炎現象,而泡沫細胞則在 10-nm 也有發炎現象的產生。 我們根據實驗的結果可以推論,不同尺寸的奈米點結構可以調控巨噬細胞及 泡沫細胞的生長、貼覆、細胞密度、及免疫功能。巨噬細胞及泡沫細胞在 50-nm 結構表面上有較少的發炎反應及較佳的貼覆能力。未來在人工植入物的表面結構 設計上可以做為參考。 關鍵字:細胞貼附;奈米表面;巨噬細胞;泡沫細胞;細胞貼附面積;活化
Characterization of nanotopographical effects on macrophage and
foam cell behavior in function and activation
Student: Chia-Wei Chen Advisor: Dr. Guewha Steven Huang
Institute of Material Science and Engineering Graduate Program For
Nanotechnology
National Chaio Tung University
ABSTRACT
Macrophage play an important role in modulating the function of human body, and foam cell differentiating from macrophage is also the major factor in Atherosclerosis. In the present day, many artificial bio-implant have been designed and applied to many
category. So it is an vital issue to consider the interaction between macrophage and
artificial bio-implant surface. In our research, we use silicon based substrate to build nanodot arrays ranging from 10-nm to 200-nm, and seed macrophage isolating from mouse peritoneal on nanodot arrays. Then we further differentiae macrophage into foam cells by LDL.
In the morphology experiment, the outcome of cell adhesion area are that 10-nm, 50-nm,100-nm increase respectively 6.17%、25.7%、9.63% cell adhesion area compare with flat surface and 200-nm decrease visibly 14.74% ,accompanied with apoptosis-like. Foam cells increase respectively 7.11% and 12.4% cell adhesion area on 10-nm and
with flat surface. We may imply that 50-nm surface has more bio-compatibility than 200-nm surface in terms of macrophage and foam cell . According to immunostaining, we found that 50-nm shows the more viculin and actin filament distribution in 50-nm surface than other nanodot size, which indicate that 50-nm surface promote cell adhesion and cytoskeleton organization. On the contrary, 200-nm surface hinders cells from adhesion and inhibits the organization of cytoskeleton. In terms of cell lamellipodia length, 100-nm and 200-nm shows the most extended lamellipodia of all nanodot size. It reveals that macrophage and foam cell execute their innate immune function on the surface of 100-nm and 200-nm. Then we perform a cell viability test, judging from the statistics, macrophage and foam cells seeding on 50-nm surface have the most viability and the less viability on 200-nm surface. The outcome accord with the previous inference that 50nm surface has the more bio-compatibility than 200-nm surface.
In the gene experiment, we utilize RP-PCR to observe the gene expression of macrophage and foam cells. The outcome reveals that 100-nm and 200-nm surface have apparently inflammation gene expression for macrophage and 10-nm surface also have inflammation for foam cell.
In our outcome, we may infer that nanostructure can modulate macrophage and foam cell in cell growth, cell density and cell spread area, immune function with size
dependently. Macrophage and foam cell on 50-nm surface have less inflammation and more adhesion area. Possible application of nanostructure on the artificial implants is expected.
Keywords: cell adhesion; nanotopography; macrophage; foam cell; cell spread area;
Contents
Chapter 1: Introduction ... 1
1.1 Atherosclerosis ... 1
1.2 Mechanisms of foam cell formation ... 1
1.3 Implant ... 2
1.4 surface topology interact with cell... 3
Chapter 2: Materials and Methods... 7
2.1Chemicals ... 7
2.2 Isolation of LDL ... 7
2.3Copper oxidation of LDL ... 8
2.4Detection of TBARS(TBA assay) ... 8
2.5 Isolation of mouse peritoneal macrophages ... 8
2.6 Oil red 0 staining ... 9
2.7 Fabrication of nanodot arrays ... 9
2.8 The cells viability assay. ... 10
2.9 Scanning electron microscopy (SEM) ... 10
2.10 Immunostaining ... 10
2.11 Quantitative real-time RT-PCR ... 11
Chapter 3: Results and Discussion ... 13
3.1 Substrate fabrication and characterization ... 13
3.2 To quantitatively determine ox-LDL ... 14
3.3 Nanotopography modulated morphology of macrophage and foam cell ... 15
3.4 Nanotopography modulated cell adhesion and cytoskeleton organization of macrophage and foam cell ... 23
3.5 Nanotopography modulated cell density ... 27
3.6 Effect of Nanotopography on the expression of inflammatory mediators. ... 30
Chapter 4: Discussion ... 34
Chapter 5: Conclusion ... 37
Reference ... 38
List of Figures
Fig 1 Tantalum-based nanodot arrays fabricated by AAO processing. ... 13Fig 2 Oxidation level of LDL on Cu2+-induced lipid peroxidation ... 14
Fig 3 Macrophage and foam morphology change on topographical surface with hematoxylin and Oil Red 0 staining ... 17
Fig 4 Oil numbers of foam cell ... 18 Fig 5 Morphology of macrophage cultured on nanodot arrays imaged by scanning
electron microscopy ... 19 Fig 6 Morphology of foam cells cultured on nanodot arrays imaged by scanning
electron microscopy ... 20 Fig 7 Cell spread area versus dot diameter for cells cultured on the nanodot arrays21 Fig 8 Cell lamellopodia length versus dot diameter for cells cultured on the nanodot
arrays ... 22 Fig 9 Immunofluorescent staining shows distribution of vinculin in macrophage
cultured on nanodot arrays ... 24 Fig 10 Immunofluorescent staining shows distribution of vinculin in foam cells
cultured on nanodot arrays ... 25 Fig 11 Cell focal adhesion versus dot diameter for cells cultured on the nanodot
arrays ... 26 Fig 12 Immunofluorescent staining shows distribution of DAPI of foam cells
cultured on nanodot arrays ... 28 Fig 13 Cell density versus dot diameter for cells cultured on the nanodot arrays .... 29 Fig 14 Gene expression of the Cytokines ... 31 Fig 15 Gene expression of the Chemokines ... 32 Fig 16 Gene expression of the adhesion molecules ... 33
Table
Table 1. Primer sequences……….19
Chapter 1: Introduction
1.1 Atherosclerosis
It is well known that Atherosclerosis is a chronic immune-inflammatory disease that leads to cardiovascular and the features of atherosclerotic plaques illustrate that atherosclerosis is a complex disease, and many components of the vascular, metabolic, and immune systems are involved in this process.(1-3) The source of atherosclerotic is depending on the interaction of monocytes with activated luminal endothelium. This interaction is a vital event leading to atherosclerotic alteration of the arterial intima. (4-5) When monocytes migrate into the subendothelial layer of the intima, they differentiate into macrophages or dendritic cells.(6). On the surface of subendothelial layer are fulled with atherogenic lipoproteins. When macrophages swallow up lipoproteins, they will transform into foam cells. Foam cells aggregate to form the atheromatous core and as this process progresses, the atheromatous centres of plaques become necrotic, consisting of lipids, cholesterol crystals and cell debris .(7)
1.2 Mechanisms of foam cell formation
Foam cells are the hallmark of the arteriosclerotic process and the formation from macrophages with subsequent fatty streak formation plays a key role in early atherogenesis. Foam cell formation is thought to be induced by Low Density Lipoproteins (LDL), including
oxidized LDL (OxLDL) or minimally modified LDL (mmLDL).(8) It is fundamental importance to understand the molecular mechanisms involved in OxLDL and mmLDL induced foam cell formation for atherosclerosis and cardiovascular disease. It is commonly accepted that modified lipoproteins and lipoproteinaggregates are internalised by macrophages through a scavenger receptor pathway. Scavenger receptors were initially described in cultured macrophages wherethey mediate cholesterol uptake from modified lipoproteins, determining the formation of lipid-loaded macrophages that resemble foam cells present in atherosclerotic lesions. (9) There are many gene expression involved in the stage of macrophage transformation into a foam cell. The expression of scavenger receptors by macrophages has been shown also in specimens of human atherosclerotic arteries (7, 10). The results of the experiments investigating the significance of SR-A and CD36 in atherogenesis are controversial. Several studies have demonstrated that deletion of the gene locus that codes for SRA-I and SRA-II (Msr1) or deletion of CD36 in hyperlipidemic mouse models markedly decreased atherosclerosis and arterial lipid accumulation(11-13). These findings suggest that the uptake of ox-LDL by SR-A and CD36 may constitute the major pathways for foam cell formation in vivo and that lipid uptake by either receptor is a proatherosclerotic event
1.3 Implant
with different cells and tissues, which would be expected to respond to surfaces differently. A single surface topography will not serve all tissues equally well since cells of different origins prefer for different surface roughness.(14-15) Monocyte and macrophage cells play a key role in mediating host tissue response to implants in the foreign body reaction.(16-18) This response is characterized by non-specific protein adsorption onto the implant surface, followed by monocyte attachment and differentiation into adherent macrophage cells on the surface. Monocyte/macrophage cytokine responses to bio-materials have been examined both in vitro and in vivo. Many studies have shown differential monocyte and macrophage responses to various biomaterials using inflammatory cytokines such as TNF-a, IL-1b,IL-6, and IL-8 as indicators of cellular activation.(19-20) So it is an important issue to design specific implant surface topographies to support attachment and function of the monocyte or macrophage in contact with the implant.
1.4 surface topology interact with cell
Surface topology encodes information that directs cell behavior (21-25). Cells detect and respond to specific ligands and spatial organization of the scaffoldings known as the extracellular matrix (ECM). The ECM consists of collagen and elastin fibers in 10–300 nm diameters intertwined into a landscape of peaks, valleys, and pores (26). Since ECM contains structures from micro-scale down to nano-scale, it is hypothesized that cells respond to both
micro-structure and nano-structure.
Micro-scaled landscapes have been fabricated to direct growth of cultured cells. When cultured on ridges and grooves of nanoscale dimensions, cells migrated more extensively to the ridges than into the grooves. Cell shape was aligned and extended in the direction of the grooves (23, 27). It has been shown that three-dimensional micro-structure that mimics ECM provides environment for in vivo growth of cells. Osteoblasts grown on a fibrous matrix composed of multiwalled carbon nanofibers (100 nm in diameter) exhibited increased proliferation compared to flat glass surfaces (28-29). Breast epithelial cells proliferate and form multicellular spheroids on interwoven polyamide fibers fabricated by electrospinning polymer solution onto glass slides (30). Nanofibers of ca 100 nm in diameter have been fabricated to mimic the three-dimensional fibrous structure of the extracellular matrix (25, 29). 3-D nanofibrillar surfaces covalently modified with tenascin-C-derived peptides enhance neuronal growth in vitro(31). The three dimensionality and nanofibrillar architecture of ECM may represent another essential element in signal transduction pathways and cellular physiology. Nanotopography can activate the small GTPase Rac. The activation of Rac was accompanied by changes in cell morphology and proliferation, Rac localization, fibronectin deposition, and the organization of actin filament based networks (30). Although cellular response to microtopography has been intensively investigated, the nanotopography that cells respond to and molecular apparatus that sense and transmit spatial signal from membrane to
nucleus are not clearly defined at the present time.
Nanotopography-induced cellular response has been explored using nanoislands. Nanoislands were fabricated through varying the polymer blend and allowing spontaneous demixing (32). Strong influence on the formation of focal adhesions, reorganization of cytoskeleton, and change in the mobility is observed (33). The cell manages initial fast organisation of cytoskeleton in reaction to the islands (34). It has been observed that 13-nm-high islands induce cell spreading and proliferation, while 160-nm islands retard attachment of filopodia. A gene expression study using microarray indicates down regulation for genes associated with cytoskeleton for cells grown onto 95-nm deep nanoislands. The cells respond to the islands by broad gene up-regulation, notably in the areas of cell signaling, proliferation, cytoskeleton, and production of extracellular matrix protein (35). However, the topography consists of nanoscale islands with controllable heights of tens to hundreds of nanometers, however with a large variation in diameter (36).
The current study is based on the hypothesis that signal transduction pathways must exist that transmit a nanotopography-induced special signal that directs cellular behavior from extracellular domain to the nuclear area where genetic control occurs. Arrays of nanodots with defined diameter and depth can be fabricated by using aluminum nanopores as a template during oxidation of tantalum thin films (36). The pore size of aluminum oxide is controllable and uniformly distributed; the depth of dots depends on the voltage applied; thus,
it can serve as a convenient mold to fabricate tantalum into a nanodot array of specific diameter and depth. The structure containing nanodots of uniform size could serve as a comparable nanolandscape to probe cellular response at the molecular level. Although, many implant surface topographies are commercially available, there is generally a lack of detailed comparative histological studies at the nano-interface that document how these surfaces interact with monocye and macrophage.
In our studies, we have shown differential growth of macrophage and foam cells onto nanodot arrays with dot diameters ranging from 10-nm to 200-nm. Cells grew normally on the 50-nm dots and on 10-nm surfaces. However, 200-nm nanodot arrays induced apoptotic events. The occurrence of apoptosis is mediated by the formation of focal adhesions. Application of assembly containing a range of nanostructures should be capable of obtaining parameters that are useful in the designing and evaluation of artificial implants in tissue engineering.
Chapter 2:
Materials and Methods
2.1Chemicals
DMEM, FBS, antibiotics, and all other tissue culture reagents were obtained from GIBCO. Glutaraldehyde and osmium tetroxide were purchased from Electron Microscopy Sciences (USA). Anti-vinculin mouse antibody was purchased from Abcam (USA). Alexa Fluor 594 phalloidin, Alexa Fluor 488 goat anti-mouse IgG, were purchased from Invitrogen (USA). Trypsin was purchased from Sigma (USA). CuSO4, KBr, thiobarbituric acid, trichloroacetic acid, and other commonly used chemicals were purchased from Sigma or Merck
2.2 Isolation of LDL
LDL was isolated from human plasma in the density range 1.019-1.063 by ultracentrifugation as described. Human plasma was isolated from volunteer blood by centrifugation 15 minutes at 3000 rpm, 4 “C in the presence of 0.3mM EDTA followed by ultracentrifugation at 40,000 rpm for 20 hours at 10 “C. VLDL was removed as the top layer. Potassium bromide was added to a final density of 1.063 followed by ultracentrifugation at 40,000 rpm 10 C for 20 hours. Typically, 4 ml LDL was derived as the top layer from each preparation of 50 ml human serum. The purity of LDL was justified by HPLC procedure using Superdex (Waters) gel filtration column. The isolated LDL was dialyzed against PBS
to remove KBr. Protein concentration was measured by optical reading at 280nm. Typical protein concentration was about 15 mg/ml using this procedure.
2.3Copper oxidation of LDL
Copper oxidation was performed as described in Mao et al(37). LDL and incubated at 37 “C for 4 hr. The reaction was terminated by the addition of excess EDTA followed by dialysis in excess of PBS. TBAR assay was performed to monitor oxidation.
2.4Detection of TBARS(TBA assay)
The colormetric thiobarbituric acid (TBA) assay with minor modification was utilized to justify lipid peroxidation. Fifty μl of sample was added to 300 μl of 20% trichloroacetic acid (TCA), followed by the addition of 300 μl of 0.67% TBA in 0.05N NaOH and mixed vigorously. The mixture was incubated at 80 - 90° C for 30 minutes to develop the MDA-TBA adducts followed by a centrifugation at 3000 rpm for 5 minutes. Subsequently, 300 μ1 supernatant were transfered in duplicates onto a 96-well microtiter plate and optical density was measured at 540nm using an ELISA plate reader
2.5 Isolation of mouse peritoneal macrophages
Resident peritoneal macrophages were isolated and cultured from 5 mice (-20g each) and were washed lx with Dulbecco’s modified Eagle medium (DMEM) and lx with DMEM containing 10% fetal bovine serum. The cells were added to different sizes nanodot in DMEM containing 10% fetal bovine serum and 100 pg/ml penicillin and culture for 48 hrs at 37°C in
an incubator containing 5% CO2 with 90% humidity. The non-adherent cells were removed and the monolayers were then placed in DMEM containing 10% fetal bovine serum supplemented with 100 μg/ml oxidized LDL or acetyl LDL and plates were further incubated for additional 24 to 48 hrs..
2.6 Oil red 0 staining
Monolayers of macrophages prepared on nanodot surface were fixed with 10% formaldehyde in PBS (pH 7.4) for 10 minute at room temperature, and then stained with Oil Red 0 and counterstained with hematoxylin for 10 minutes(38).
2.7 Fabrication of nanodot arrays
Nanodot arrays were fabricated as described previously (36, 39). A TaN thin film of 150 nm in thickness was sputtered onto a 6-inch silicon wafer followed by deposition of 3 µm-thick aluminum onto the top of a TaN layer. Anodization was carried out in 1.8 M sulfuric acid at 5 Volts for the 10-nm nanodot array, or in 0.3 M oxalic acid at 25 Volts, 60 Volts, and 100 Volts for 50-nm, 100-nm, and 200-nm nanodot arrays, respectively. Porous anodic alumina was formed during the anodic oxidation. The underlying TaN layer was oxidized into tantalum oxide nanodots using the alumina nanopores as template. The porous alumina was removed by immersing in 5 % (w/v) H3PO4 overnight. The dimension and homogeneity of
nanodot arrays were measured and calculated from images taken by JEOL JSM-6500 TFE-SEM.
2.8 The cells viability assay.
Cells were harvested and fixed with 4% formaldehyde in PBS for 30 min followed by PBS wash for three times. And membrane was permeated by incubating in 0.1 % Triton X-100 for 10 min, followed by PBS wash for three times. The sample was incubated with 4',6-diamidino-2-phenylindole (DAPI) and phalloidin for 15 min at room temperature.
2.9 Scanning electron microscopy (SEM)
The harvested cells were fixed with 1% glutaraldehyde in PBS at 4 ºC for 20 minutes, followed by post-fixation in 1% osmium tetraoxide for 30 min. Dehydration was performed through a series of ethanol concentrations (10-min incubation each in 50%, 60%, 70%, 80%, 90%, 95%, and 100% ethanol) and air dried. The specimen was sputter-coated with platinum and examined by JEOL JSM-6500 TFE-SEM at an accelerating voltage of 5 keV.
2.10 Immunostaining
Cells were harvested and fixed with 4% paraformaldehyde in PBS for 15 min followed by PBS wash for three times. Membrane was permeated by incubating in 0.1 % Triton X-100 for 10 min, followed by PBS wash for three times, blocked by 1 % BSA in PBS for 1 hr, and PBS wash for three times. The sample was incubated with anti-vinculin antibody (properly diluted in 0.5 % BSA) and phalloidin for 1 hr, followed by incubating with Alexa Fluor 488 goat anti-mouse antibody for 1 hr followed by PBS wash for three times.
2.11 Quantitative real-time RT-PCR
Total RNA was extracted from macrophage and foam cell using TRI-reagent (Talron Biotech) according to the manufacturer's specifications. The RNA was isolated using chloroform extraction and isopropanol precipitation. The crude RNA extract was immediately purified with an RNeasy Mini Kit (Qiagen) to remove impurities and unwanted organics. Purified RNA was resuspended in DEPC water and quantified by OD260. The OD260-to-OD280
ratio usually exceeded 2.0 at this stage. For cDNA synthesis, 1 µg total RNA was annealed with 1 µg oligo-dT, followed by reverse transcription using SuperScript® III Reverse Transcriptase (Invitrogen) in a total volume of 50 µl. Between 0.2 and 0.5 μl of the reverse transcription reactions were used for quantitative real-time PCR using SYBR Green I on an iCycler iQ5 (Bio-Rad Laboratories). Cycling conditions were as follows: 1× [5 min at 95°C] and 50× [20 s at 95°C, 20 s at 55°C, and 40 s at 72°C]; fluorescence was measured after each 72°C step. Expression levels were obtained as threshold cycles (Ct), which were determined by the iCycler iQ Detection System software. Relative transcript quantities were calculated using the ΔΔCt method. The GAPDH, were used as reference genes and were amplified from the same cDNA samples. The difference in threshold cycles of the sample mRNA relative to the GAPDH, mRNA was defined as ΔCt. The difference between the ΔCt of the untreated control and the ΔCt of the SMF-treated sample was defined as ΔΔCt. The fold change in mRNA expression was expressed as 2ΔΔCt. The results were expressed as the mean ± SD of six
experiments.
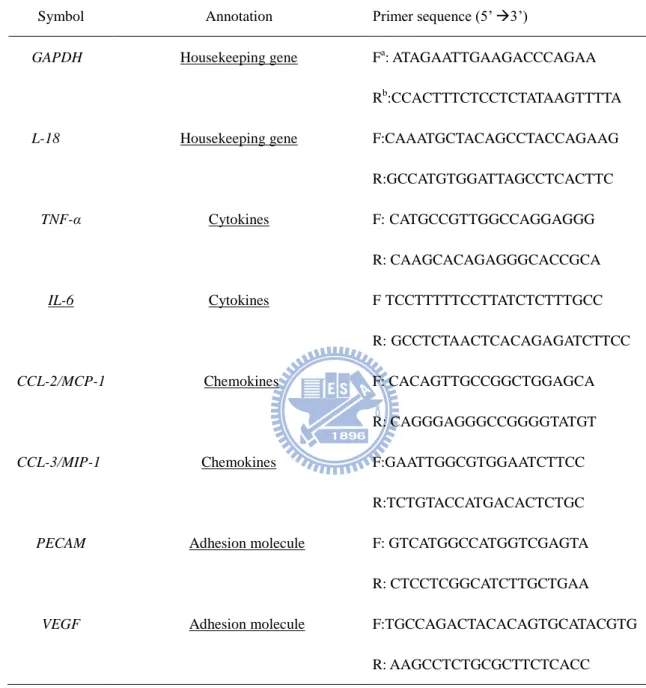
Table 1. Primer sequences
Symbol Annotation Primer sequence (5’ 3’)
GAPDH L-18 Housekeeping gene Housekeeping gene Fa: ATAGAATTGAAGACCCAGAA Rb:CCACTTTCTCCTCTATAAGTTTTA F:CAAATGCTACAGCCTACCAGAAG R:GCCATGTGGATTAGCCTCACTTC TNF-α Cytokines F:CATGCCGTTGGCCAGGAGGG R: CAAGCACAGAGGGCACCGCA
IL-6 Cytokines FTCCTTTTTCCTTATCTCTTTGCC
R:GCCTCTAACTCACAGAGATCTTCC CCL-2/MCP-1 Chemokines F: CACAGTTGCCGGCTGGAGCA R: CAGGGAGGGCCGGGGTATGT CCL-3/MIP-1 PECAM VEGF Chemokines Adhesion molecule Adhesion molecule F:GAATTGGCGTGGAATCTTCC R:TCTGTACCATGACACTCTGC F: GTCATGGCCATGGTCGAGTA R: CTCCTCGGCATCTTGCTGAA F:TGCCAGACTACACAGTGCATACGTG R: AAGCCTCTGCGCTTCTCACC
Chapter 3:
Results and Discussion
3.1 Substrate fabrication and characterization
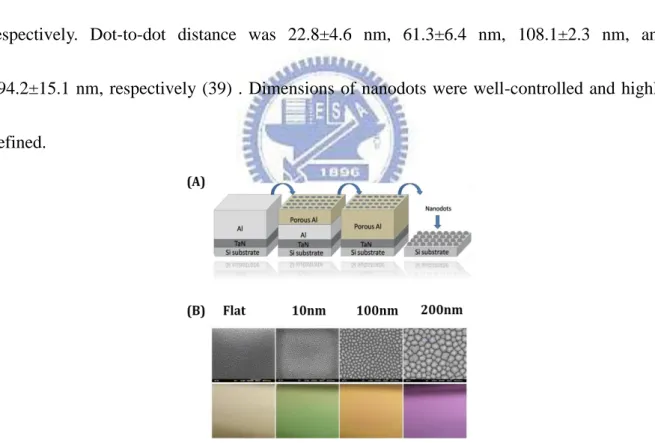
Nanodot arrays with dot diameters of 10-nm, 50-nm, 100-nm, and 200-nm were fabricated as described previously by anodic aluminum oxide (AAO) processing on tantalum-coated wafer (36). Diameters are 15±2.8 nm, 58.1±5.6 nm, 95.4±9.2 nm, and 211.5±30.6 nm for 10 nm, 50 nm, 100 nm, and 200 nm dot arrays, respectively (Figure 1A,1B). The average height was 11.3±2.5, 51.3±5.5, 101.1±10.3, and 154.2±27.8 nm, respectively. Dot-to-dot distance was 22.8±4.6 nm, 61.3±6.4 nm, 108.1±2.3 nm, and 194.2±15.1 nm, respectively (39) . Dimensions of nanodots were well-controlled and highly defined.
Fig 1 Tantalum-based nanodot arrays fabricated by AAO processing.
Figure.1 Tantalum-based nanodot arrays fabricated by AAO processing. (A) Schematic representation for the fabrication of nanodot arrays. (B) High resolution scanning electron micrographs of nanodot surface: Flat, 10-nm, 50-nm, 100-nm, and 200-nm
3.2 To quantitatively determine ox-LDL
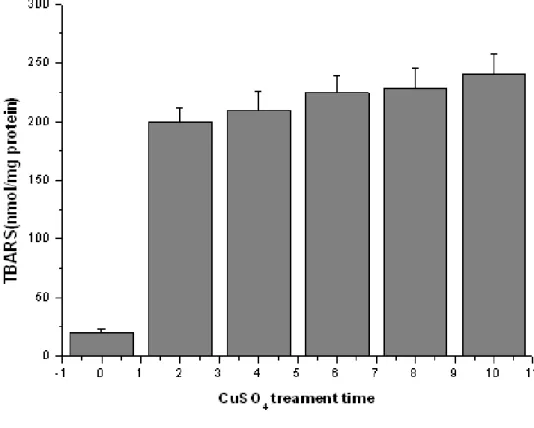
LDL was isolated from volunteer serum and detected by lowry method to determine the concentration of protein. The extent of LDL oxidation is determined by measuring the TBARS using malondialdehyde as a standard. Incubation of LDL with copper resulted in a significant MDA formation at 2 h, with a time-dependent increase observed up to 10 h. The extent of lipid peroxidation in oxidized LDL mediated by copper incubation increased the peroxidation of LDL compared to the control (Fig 2).
lated and F
Fig 2 Oxidation level of LDL on Cu2+-induced lipid peroxidation
Fig.2. Oxidation level of LDL on Cu2+-induced lipid peroxidation. LDL is isolated and incubated with 15μ M CuSO4 for 0~10 h at 37◦ C. The data’s are from three repeats from
3.3 Nanotopography modulated morphology of macrophage and foam cell
Oxidized low-density lipoprotein (oxLDL) has previously been thought to promote atherogenesis through foam cell formation. Hence we demonstrate the effect of nanodot arrays on oxLDL-induced foam cell formation by the Oil-Red O and hematoxylin staining method. In contrast to control cells, cells treated with ox-LDL (100 μ g/ml) (TBARS approximately 250 nmol/mg protein) exhibits extensive Oil-Red O droplets (Fig. 3). Compared to its native shape on flat controls after 48 h culture, it seems that macrophage grown on 50-nm nanodot array showed more extended morphology with apparent larger surface area for each cell and foam cell also have more extended surface area on 50-nm nanodot array. However, macrophage and foam cell grown on 100-nm exhibited distorted morphology with shrinking surface. The apoptosis-like appearance and the reduction in spread area are mostly enhanced for cells seeded on 200-nm nanodots arrays. We also counted the oil number in foam cell with each nanodot arrays (Fig. 4) . We found that 10-nm has more oil distribution than nanodot sizes.
Macrophage and foam cell were still examined by SEM to observe cell morphology (Fig. 5 and 6). It could be clearly observed that macrophage and foam cell culture on 50-nm surface had 1.5-fold increase in spread area and significantly decrease on 200-nm surface ompared to flat.
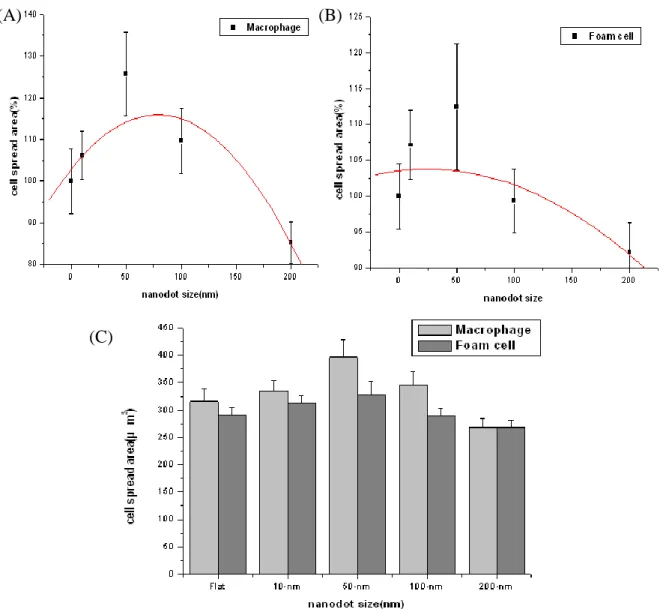
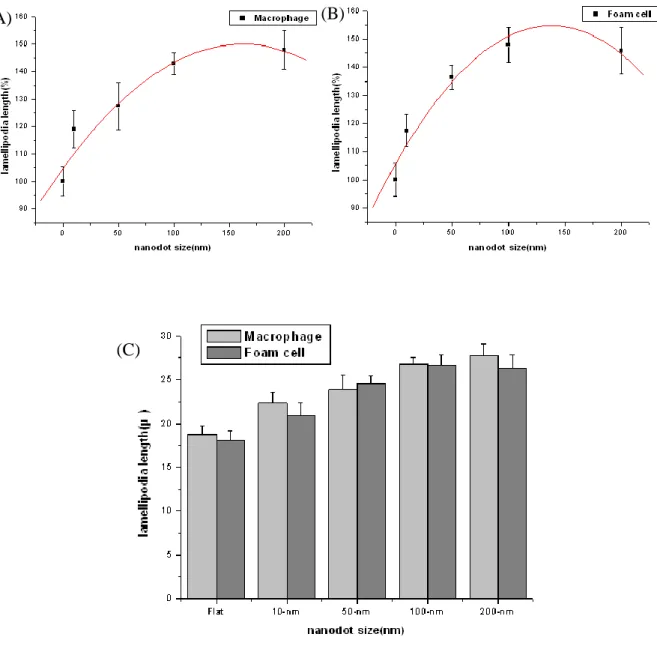
size nanodot. The statistics revealed that 50-nm increased significantly 25.7% cell adhesion area and 200-nm decreased apparently 14.7% compared with flat surface. Foam cells increased 12.4% cell adhesion area on 50nm surface and decreased 7.8% on 200-nm surface compared with flat surface. We also measured the lamellipodia length of macrophage and foam cell (Fig. 8). Macrophage and foam cell showed the more lamellipodia length on 100-nm and 200-nm surface, and decreased with nanodot sizes reduction. We might infer that macrophage and foam cell were sensitive to larger nanodot sizes to execute their immune function. When seeding on the surface of 100-nm and 200nm, macrophage and foam cell might want to stretch their arm to engulf the particle of nanodot, in which might the reason for cells on 100-nm and 200-nm with distorted morphology.
To a brief summary, macrophage and foam cell seeded on 50-nm nanodots showed most extended morphology, with largest surface area. However, cell grown on 200-nm surface, with significant reduction in the surface area, and it represented that 200-nm surface promoted unhealthy cell growth.
Fig 3 Macrophage and foam m orphology change on topographical surface with hem atoxy lin and Oil Red 0 stain ing
Fig. 3. Macrophage and foam morphology change on topographical surface with hematoxylin and Oil Red 0 staining. Macrophage were grown on Flat ,10-nm ,50-nm ,100-nm ,and 200-nm nanodot arrays for 3days and their morphology imaged by optical microscopy
Fig 4 O il n um bers of foam cell
Fig. 4. Oil numbers of foam cell .Foam cell were grown on Flat ,10-nm ,50-nm ,100-nm ,and 200-nm nanodot arrays for 3days and their oil number counted by image j pro.
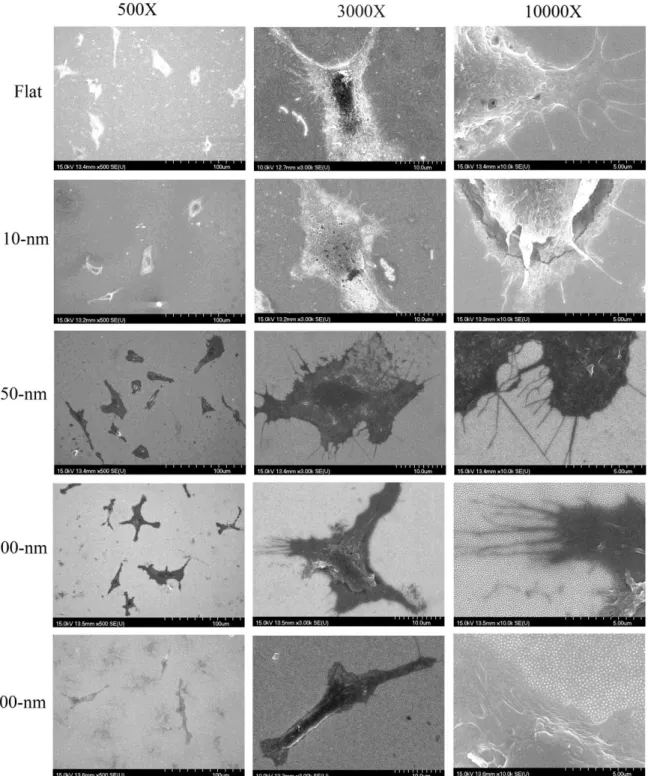
Fig 5 Morpho logy of m acrophage cultured on nanodot array s im aged by scanning electron m icroscopy
Fig. 5. Morphology of macrophage cultured on nanodot arrays .Macrophage were grown on Flat ,10-nm ,50-nm ,100-nm ,and 200-nm nanodot arrays for 3days and their morphology imaged by scanning electron microscopy
Fig 6 Morpho logy of foam cells cultured on nanodot array s imaged by scanning electron m icroscopy
Fig. 6. Morphology of foam cells cultured on nanodot arrays .Foam cells were grown on Flat ,10-nm ,50-nm ,100-nm ,and 200-nm nanodot arrays for 3 days and their morphology imaged by scanning electron microscopy
Fig 7 Cell spread area versus dot diam eter for cells cultured on the nanodo t array s
Fig. 7. Cell spread area versus dot diameter for cells cultured on the nanodot arrays.(A) Macropage (B) Foam cell (C) Macrophage compared with foam cell Cell are cultured for 3 days. The viable cells are counted and percent adhesion area relative to cells cultured on a flat surface (0 nm) is calculated and graphed against the nanodot diameter. The graphs show lamellopodia length of macrophage and foam cells. Each value is averaged from at least 6 independent experiments. The error bars are the standard errors. The curves for best fit are derived using original software.
(C)
(B) (A)
Fig 8 Cell lam ellopodia leng th versus d ot d iam eter for cells cultured on the nanodot array s
Fig. 8 Cell lamellopodia length versus dot diameter for cells cultured on the nanodot arrays. (A) Macropage (B) Foam cell (C) Macrophage compared with foam cell Cells are cultured for 3 days. The viable cells are counted and percent lamellopodia length relative to cells cultured on a flat surface (0 nm) is calculated and graphed against the nanodot diameter. The graphs show lamellopodia length of macrophage and foam cells. Each value is averaged from at least 6 independent experiments. The error bars are the standard errors. The curves for best
(A) (B)
3.4 Nanotopography modulated cell adhesion and cytoskeleton organization of macrophage and foam cell
To evaluate cell adhesion and cytoskeleton reorganization, immnostaining specific to vinculin and actin filaments was performed on nanodot arrays (Fig. 9 and 10 ). Immunostaining of vinculin showed that well distributed for macrophage grown on on the 10-nm, with highest density of vinculin occurred to cells grown on 50-nm nanodots arrays (Fig 11). Nevertheless, the amount of vinculin staining decreased on 100-nm nanodot array and almost disappeared for 200-nm nanodot arrays. For foam cells, the mount of vinculin significantly decreased than macrophage in all nanodot size. It revealed that foam cell had few focal adhesion molecules than macrophage when grown on nanodot arrays and might have the destiny of apoptosis. Immunostaining of actin filaments indicated that well organized actin filaments were visible for macrophage grown on flat, on 10-nm, and on 50-nm nanodot array but gradually lost for 100-nm and completely disappeared for 200-nm arrays. For foam cells, it also could be observed that cytoskeleton arrangement was gradually lost for cells grown on 100-nm and completely disappeared for 200-nm arrays.
Immunostaining indicated that in the range of 10-nm to 100-nm nanodot promoted cell adhesion and cytoskeleton organization for macrophage and foam cell. Best adhesion occurred at 50-nm. Nanodots of 200-nm retarded the formation of focal adhesions and inhibited the organization of cytoskeleton.
Fig 9 Im m unofluorescent stai ning shows d istrib utio n of vincu lin i n m acrophage cultured on nanodot array s
Fig. 9. Immunofluorescent staining shows distribution of vinculin in macrophage cultured on nanodot arrays. Macrophage were seeded on Flat ,10nm ,50nm,100nm and 200nm nanodot
Fig 1 0 Im m unofluorescent staining shows distri buti on of vi nculin in foam cells cultured on nano dot array s
Fig. 10. Immunofluorescent staining shows distribution of vinculin in foam cells cultured on nanodot arrays. Foam cells were seeded on Flat ,10nm ,50nm,100nm and 200nm nanodot arrays for 2 days and their morphology observed by Confocal micoscopy. Scale bar = 25μm.
Fig 11 Cell focal adhesio n versus do t diam eter for cells cultured on t he nanodot array s
Fig. 11. Cell focal adhesion versus dot diameter for cells cultured on the nanodot arrays. (A) Macrophage (B) Foam cell Cells are cultured for 3 days. The viable cells are counted and percent focal adhesion relative to cells cultured on a flat surface (0 nm) is calculated and graphed against the nanodot diameter. The graphs show focal adhesion of macrophage and foam cells. Each value is averaged from at least 6 independent experiments. The error bars are
(A)
3.5 Nanotopography modulated cell density
To evaluate the cell density of macrophage and foam cells on varied nanodots, cell were seeded on nanodot arrays with flat control. Macrophage and foam cell were cultured for 72hr then DAPI staining was performed to verify cell numbers on each nanodot arrays and flat (Fig. 12 ). Statistics of cell density compared with flat control was shown on Fig 13. Macrophage were 27.3%, 49.7%, and 6.0% increment of viable cells for 10-nm, 50-nm, and 100-nm, respectively, but 34.3% reduction observed on 200-nm. For foam cells, 15% increment was observed on 50-nm, and 36.8% dramatically reduction occurred on 200-nm.
To sum up, for macrophage and foam cells, the cell density reached the maximun on 50-nm nanodot and droped significantly on 200-nm surface. It might reveaded that 50-nm surface promoted cell to adhesion and 200-nm surface prevented cell from growth.
Fig 1 2 Im m unofluorescent staining shows distri buti on of DAPI of foam cells cultured on nanodo t array s
Fig. 12. Immunofluorescent staining shows distribution of DAPI of foam cells cultured on nanodot arrays. Foam cells were seeded on Flat ,10nm ,50nm,100nm and 200nm nanodot
Fig 1 3 Cel l density versus do t diam eter for cells cultured on t he nanodot array s
Fig. 13 Cell density versus dot diameter for cells cultured on the nanodot arrays.(A) Macrophage (B) Foam cell Cells are cultured for 3 days. The viable cells are counted and percent density relative to cells cultured on a flat surface (0 nm) is calculated and graphed against the nanodot diameter. The graphs show viability of macrophage and foam cells. Each value is averaged from at least 6 independent experiments. The error bars are thestandard errors. The curves for best fit are derived using original software.
(A)
3.6 Effect of Nanotopography on the expression of inflammatory mediators.
The cytokine gene profile of macrophaage and foam cell cultured on nanodot arrays was measured at 72 hr using RT-PCR. The cytokines examined were categorized into TNF-a, IL-6 (Gene expression of the inflammation) and CCL-2, CCL-3(Gene expression of acute inflammation and PECAM, VEGF (Gene expression of the adhesion molecules). Figs. 13、14 and 15 show the relative gene expression of topography-induced normalized to flat (0 nm), respectively. During the 72hr stages of cell adhesion and morphology change, macrophage show the more gene expression of inflammation on 10-nm and 200-nm nanodot arrays,while the difference was not significant compare with flat and could be ignored. Foam cell showed the most inflammation gene expression on 200-nm, we might infer that foam cell on 200-nm might have the pathway of apoptosis. The common acute inflammation gene expression of CCL-3 responded significantly to topography of 100-nm and 200-nm nanodot arrays for macrophage, and it revealed that macrophage in the larger size would the situation of acute inflammation. However the foam cell showed the most acute inflammation on the 10-nm, it might be relative to the amount of LDL engulfed by macrophage. Topographical effect on VEGF gene expression of macrophage showed that the smaller size nanodot arrays might have more adhesion molecules. For foam cell, the PECAM gene was an index to judge the level of macrophage engulfed ox-LDL and we found that 10-nm has the more oil distribution than other size.
Fig 1 4 Gene expression of t he Cy to kines
Figure. 14. Gene expression of the Cytokines, (A) Macrophage (B)Foam cell with cells cultured on nanodot arrays with different sizes for 72 hours. Real-Time RT-PCR results of the cytokine (IL-10, TNF-α and IL-6), Each value is averaged from at 3 independent experiments. The error bars are the standard errors.
(B) (A)
Fig 1 5 Gene expression of t he Chem o kines
Figure 15. Gene expression of the Chemokines, (A)Macrophage (B)Foam cell with cells cultured on nanodot arrays with different sizes for 72 hours. Real-Time RT-PCR results of the Adhesion molecules CCL-2,CCL-3), Each value is averaged from at 3 independent
(B) (A)
Fig 1 6 Gene expression of t he adhesion m olecules
Figure 16. Gene expression of the adhesion molecules, (A)Macrophage (B)Foam cell with cells cultured on nanodot arrays with different sizes for 72 hours. Real-Time RT-PCR results of the cytokine (PECAM , VEGF), Each value is averaged from at 3 independent experiments. The error bars are the standard errors
(B) (A)
Chapter 4:
Discussion
Adhesion, cell spread area, cell lamellipodia length, and cell density of macrophage and foam cell to its underlying topography was clearly observed on nanodot arrays. We also observed distinctive trends in morphology of macrophage and foam cell changed to the topography. Macrophage and foam cells studied in our system showed that cell spread area increased with decreasing topography, but only to a limit of 50 nm before the trend diverged. However, the cell lamellipodia length showed the more on 100-nm and 200-nm. So macrophage and foam cell appeared to be relatively sensitive to nanotopography in the range of 100-nm to 200-nm, preferring to respond to 200-nm. The phenomenon appears to mirror that of phagocytosis, where macrophages preferentially internalize particulates in the micron range over the nanometric range, with peak phagocytosis observed with particles of approximately 2 μ m in diameter(40). With the size increased, we might postulate that macrophage and foam cell preferred to stretch their arm and wanted to engulf the particles on nanodot arrays in size dependent.
In the part of RT-PCR, TNF-α and IL-6 gene has been implicated in inducing apoptosis of adherent macrophage and foam cell on biomaterials(41). By measuring the functional response of macrophages and foam cell, our results showed that macrophages and foam cell does not have significant respond to topographical in TNF-α and IL-6 genes. CCL-2 (macrophage chemoattractant protein-1), a chemokine that recruits macrophage and promotes
migration, our results showed that still does not have significant respond to topographical in CCL-2 genes. While CCL-3 was involved in chemotaxis and recruitment of monocytes and leukocytes during the inflammatory response, and the trend of CCL-3 expression to macrophage and foam cell were contract to nanodot size. In macrophage, CCL-3 gene expression showed the more on 100-nm and 200-nm, and it meant macrophage on the surface might have acute inflammation. However, in foam cell, CCL-3 gene showed the more on 10-nm, and it might be relative to the amount of ox-LDL engulfed by macrophage (Fig 4). Topographical effect on VEGF gene expression of macrophage showed that the smaller size nanodot arrays might have more adhesion molecules. For foam cell, the PECAM gene was an index to judge the level of engulfing ox-LDL by macrophage and we found that 10-nm has the more oil distribution than other size.
Our results suggested that smaller size topography (10-nm to 50 nm) limits macrophage activation and inflammation related processes but topography-induced sensitivity increased at 50-nm to 200-nm. Smaller topography (10-nm to 50-nm) might share the same adhesion and motility kinetics that result in the conventional macrophage adhesion, and spreading observed on nanodot arrays. On larger topography (50-nm to 100-nm), macrophage would play its role of scavenger to stretch its arm in order to engulf the particle of nanodot arrays. Foam cell on smaller size topography (10-nm to 50-nm) topography shows normal adhesion but acute inflammation, and the reason may be caused by the amount of OX-LDL engulfed by
macrophage. Macrophage desensitization to nano-topographical cues below 50 nm could be an advantage in motility and movement into different tissue types. The consistent cellular response to nanodot arrays with different sizes in our studies confirmed that topography dictates changes in macrophage and foam cell behavior. Topography-induced changes using our model surfaces could be examined at a greater number of time points and over a longer period of study to elucidate the complex cross-talk between cells and cytokines that varies temporally and spatially throughout the inflammation and wound healing process.
Chapter 5:
Conclusion
This study suggests that topography may modulate the phenotypes of macrophages and foam cell in the context of foreign body reaction. The response to topography in the form of nanodot arrays in the range of 10-nm to 200-nm has revealed a distinctive pattern, and topography indeed affects cell morphology, density, cytokine, and adhesion compared to flat controls. The changes in cell morphology were observed in five different sizes of nanodot arrarys, indicating that the findings in this study are topography-mediated. We found that macrophage and foam cell in the range of 10-nm to 50-nm are insensitive and did not play their innate role to stretch their arm. And cell on 100-nm and 200-nm, it could be apparently observed that their stretch their arm and in order to engulf particles. By using topography-induced change in macrophage and foam behavior provided an opportunity to influence its phenotypic response such as cell activation, motility, and maturation in the foreign body response. The role of topography in modulating implant tissue reaction would require further elucidation; this study suggests that it is a fruitful direction that might impact biomaterials design.
Reference
1. Bobryshev Y. 2006. Monocyte recruitment and foam cell formation in atherosclerosis.
Micron 37: 208-22
2. Hansson G. 2001. Immune mechanisms in atherosclerosis. Arteriosclerosis,
thrombosis, and vascular biology 21: 1876
3. Hansson G. 2005. Inflammation, atherosclerosis, and coronary artery disease. The
New England journal of medicine 352: 1685
4. Nathan C. 2002. Points of control in inflammation. Nature 420: 846-52
5. Wick G, Knoflach M, Xu Q. 2004. Autoimmune and inflammatory mechanisms in atherosclerosis.
6. Bobryshev Y. 2005. Dendritic cells in atherosclerosis: current status of the problem and clinical relevance. European heart journal 26: 1700
7. Takahashi K, Takeya M, Sakashita N. 2002. Multifunctional roles of macrophages in the development and progression of atherosclerosis in humans and experimental animals. Medical Electron Microscopy 35: 179-203
8. Hevonoja T, Pentikainen M, Hyvonen M, Kovanen P, Ala-Korpela M. 2000. Structure of low density lipoprotein (LDL) particles: basis for understanding molecular changes in modified LDL. Biochimica et Biophysica Acta (BBA)-Molecular and Cell Biology
of Lipids 1488: 189-210
9. Endemann G, Stanton L, Madden K, Bryant C, White R, Protter A. 1993. CD36 is a receptor for oxidized low density lipoprotein. Journal of Biological Chemistry 268: 11811
10. Nakagawa-Toyama Y, Yamashita S, Miyagawa J, Nishida M, Nozaki S, Nagaretani H, Sakai N, Hiraoka H, Yamamori K, Yamane T. 2001. Localization of CD36 and
scavenger receptor class A in human coronary arteries--a possible difference in the contribution of both receptors to plaque formation* 1. Atherosclerosis 156: 297-305 11. Babaev V, Gleaves L, Carter K, Suzuki H, Kodama T, Fazio S, Linton M. 2000.
Reduced atherosclerotic lesions in mice deficient for total or macrophage-specific expression of scavenger receptor-A. Arteriosclerosis, thrombosis, and vascular
biology 20: 2593
12. Sakaguchi H, Takeya M, Suzuki H, Hakamata H, Kodama T, Horiuchi S, Gordon S, VAN DER L. 1998. Role of macrophage scavenger receptors in diet-induced
atherosclerosis in mice. Laboratory investigation 78: 423-34
13. Cao F, Castrillo A, Tontonoz P, Re F, Byrne G. 2007. Chlamydia pneumoniae-induced macrophage foam cell formation is mediated by Toll-like receptor 2. Infection and
epithelial downgrowth on titanium-coated percutaneous implants. Journal of
biomedical materials research 26: 493-515
15. Hamilton D, Chehroudi B, Brunette D. 2007. Comparative response of epithelial cells and osteoblasts to microfabricated tapered pit topographies in vitro and in vivo.
Biomaterials 28: 2281-93
16. Anderson J, Rodriguez A, Chang D. 2008. Foreign body reaction to biomaterials 17. Ratner B, Bryant S. 2004. Biomaterials: where we have been and where we are going. 18. Williams D. 2008. On the mechanisms of biocompatibility. Biomaterials 29: 2941-53 19. DeFife K, Yun J, Azeez A, Stack S, Ishihara K, Nakabayashi N, Colton E, Anderson J.
1995. Adhesion and cytokine production by monocytes on poly
(2-methacryloyloxyethyl phosphorylcholine-co-alkyl methacrylate)-coated polymers.
Journal of biomedical materials research 29: 431-9
20. Hwang J, Jelacic S, Samuel N, Maier R, Campbell C, Castner D, Hoffman A, Stayton P. 2005. Monocyte activation on polyelectrolyte multilayers. Journal of Biomaterials
Science, Polymer Edition 16: 237-51
21. Chen CS, Mrksich M, Huang S, Whitesides GM, Ingber DE. 1997. Geometric control of cell life and death. Science 276: 1425-8
22. Curtis A, Wilkinson C. 1997. Topographical control of cells. Biomaterials 18: 1573-83 23. Flemming RG, Murphy CJ, Abrams GA, Goodman SL, Nealey PF. 1999. Effects of
synthetic micro- and nano-structured surfaces on cell behavior. Biomaterials 20: 573-88
24. Mrksich M. 2002. What can surface chemistry do for cell biology? Current Opinion in
Chemical Biology 6: 794-7
25. Sniadecki NJ, Desai RA, Ruiz SA, Chen CS. 2006. Nanotechnology for cell-substrate interactions. Ann Biomed Eng 34: 59-74
26. Abrams GA, Goodman SL, Nealey PF, Franco M, Murphy CJ. 2000. Nanoscale topography of the basement membrane underlying the corneal epithelium of the rhesus macaque. Cell Tissue Res 299: 39-46
27. Karuri NW, Liliensiek S, Teixeira AI, Abrams G, Campbell S, Nealey PF, Murphy CJ. 2004. Biological length scale topography enhances cell-substratum adhesion of human corneal epithelial cells. J Cell Sci 117: 3153-64
28. Elias KL, Price RL, Webster TJ. 2002. Enhanced functions of osteoblasts on nanometer diameter carbon fibers. Biomaterials 23: 3279-87
29. Price RL, Ellison K, Haberstroh KM, Webster TJ. 2004. Nanometer surface roughness increases select osteoblast adhesion on carbon nanofiber compacts. J Biomed Mater
Res A 70: 129-38
30. Schindler M, Ahmed I, Kamal J, Nur EKA, Grafe TH, Young Chung H, Meiners S. 2005. A synthetic nanofibrillar matrix promotes in vivo-like organization and
morphogenesis for cells in culture. Biomaterials 26: 5624-31
31. Schwartz Z, Boyan BD. 1994. Underlying mechanisms at the bone-biomaterial interface. J Cell Biochem 56: 340-7
32. Dalby MJ, Riehle MO, Johnstone H, Affrossman S, Curtis AS. 2002. In vitro reaction of endothelial cells to polymer demixed nanotopography. Biomaterials 23: 2945-54 33. Nur EKA, Ahmed I, Kamal J, Schindler M, Meiners S. 2005. Three dimensional
nanofibrillar surfaces induce activation of Rac. Biochem Biophys Res Commun 331: 428-34
34. Park J, Bauer S, von der Mark K, Schmuki P. 2007. Nanosize and vitality: TiO2 nanotube diameter directs cell fate. Nano Lett 7: 1686-91
35. Partridge MA, Marcantonio EE. 2006. Initiation of attachment and generation of mature focal adhesions by integrin-containing filopodia in cell spreading. Mol Biol
Cell 17: 4237-48
36. Wu C-T KF-H, Hwang H-Y. 2006. Self-aligned tantalum oxide nanodot arrays through anodic alumina template. Microelectronic Engineering 83: 1567-70
37. Busch S, Barnhart R, Martin G, Fitzgerald M, Yates M, Mao S, Thomas C, Jackson R. 1994. Human hepatic triglyceride lipase expression reduces high density lipoprotein and aortic cholesterol in cholesterol-fed transgenic mice. Journal of Biological
Chemistry 269: 16376
38. Schwartz C, Ghidoni J, Kelley J, Sprague E, Valente A, Suenram C. 1985. Evolution of foam cells in subcutaneous rabbit carrageenan granulomas: I. Light-microscopic and ultrastructural study. American Journal of Pathology 118: 134
39. Pan HA, Hung YC, Su CW, Tai SM, Chen CH, Ko FH, Steve Huang G. 2009. A Nanodot Array Modulates Cell Adhesion and Induces an Apoptosis-Like Abnormality in NIH-3T3 Cells. Nanoscale Research Letters 4: 903-12
40. Ahsan F, Rivas I, Khan M, Torres Suarez A. 2002. Targeting to macrophages: role of physicochemical properties of particulate carriers--liposomes and microspheres--on the phagocytosis by macrophages. Journal of Controlled Release 79: 29-40
41. Brodbeck W, Shive M, Colton E, Ziats N, Anderson J. 2002. Interleukin-4 inhibits tumor necrosis factor-[alpha]--induced and spontaneous apoptosis of
biomaterial-adherent macrophages* 1. Journal of Laboratory and Clinical Medicine 139: 90-100