行政院國家科學委員會專題研究計畫 成果報告
「國土空間型態或結構」的定義與功能--由永續發展觀點--
研究成果報告(精簡版)
計 畫 類 別 : 個別型 計 畫 編 號 : NSC 95-2415-H-004-023-SSS 執 行 期 間 : 95 年 08 月 01 日至 97 年 07 月 31 日 執 行 單 位 : 國立政治大學地政學系 計 畫 主 持 人 : 蔡育新 計畫參與人員: 碩士班研究生-兼任助理人員:楊珮欣 碩士班研究生-兼任助理人員:李婉菁 報 告 附 件 : 出席國際會議研究心得報告及發表論文 處 理 方 式 : 本計畫可公開查詢中 華 民 國 97 年 10 月 07 日
行政院國家科學委員會補助專題研究計畫
■ 成 果 報 告
□期中進度報告
(計畫名稱)
「國土空間型態或結構」的定義與功能--由永續發展觀點
計畫類別:■ 個別型計畫 □ 整合型計畫
計畫編號:NSC 95-2415-H-004 -023 -SSS
執行期間:2006 年 8 月 1 日至 2008 年 7 月 31 日(展延一年)
計畫主持人:蔡育新
共同主持人:無
計畫參與人員:楊珮欣、李婉菁
成果報告類型(依經費核定清單規定繳交):■精簡報告 □完整報告
本成果報告包括以下應繳交之附件:
□赴國外出差或研習心得報告一份
□赴大陸地區出差或研習心得報告一份
■出席國際學術會議心得報告及發表之論文各一份
□國際合作研究計畫國外研究報告書一份
處理方式:除產學合作研究計畫、提升產業技術及人才培育研究計畫、列管
計畫及下列情形者外,得立即公開查詢
□涉及專利或其他智慧財產權,□一年□二年後可公開查詢
執行單位:國立政治大學地政學系
I (二)中、英文摘要及關鍵詞(keywords) 1990 年代以來,空間型態的相關研究不少,尤其聚焦於都會、都市、與鄰里空間尺 度,然而區域或國家較大空間尺度層級的空間型態,其定義與功能並不全然清楚。本研 究計畫的目的為探討國土空間結構的定義、及其於永續發展的目標體系下所扮演的角 色。研究內容有以下五點:(一)總體分析國土空間結構的定義、種類、功能、與呈現 方式。(二)個體分析國土空間結構的空間組成元素,並剖析其與經濟、社會、與環境 永續的關連性。(三)探討國土空間結構可利用的量化指標。(四)比較國土空間結構與 都會、都市與鄰里空間結構的關連性與異同性。(五)分析國土空間結構成效、或探討 為何無法評估的原因。研究方法主要為文獻回顧、及一項國際性官方與學者問卷調查質 性分析。資料來源包含二手文獻與一手問卷調查。研究對象為有區域層級以上計畫的國 家或地區,包括台灣、日本、韓國、與以色列等亞洲國家,荷蘭、德國、丹麥、愛爾蘭、 西班牙、葡萄牙、與希臘等歐歐洲國家、及美國。 關鍵詞:國土計畫、「國土空間結構」、「國土空間型態」
Abstract
A vast body of research has shed lights on urban form or built environment at neighborhood, city, and metropolitan levels. However, few research characterize built environment at the national level (“national spatial structure,” for short.) This research aims to address five issues of national spatial structure: first, the definitions, types, and function of national spatial structure in national spatial planning; second, the spatial elements of national spatial structure, and their connections with
sustainable development; three, quantitative indicators to characterize national spatial structure; then, a comparison analysis on national spatial structure and urban form at smaller geographic scales in terms of the above aspects; and finally, an evaluation analysis on the spatial structure plan of national spatial plan. To conduct this research, a literature-review style research will be employed. In addition, an international survey will be compiled to solicit data about the above five issues from planners and academics of those countries with national/regional spatial plans, or the like.
(三) 報告內容
Introduction
Most of past research on urban form has been concentrated at the spatial levels of metropolitan area, city, or neighborhood. Three dimensions of urban form of built environment-density, diversity, and design- (Cervero and Kockelman, 1997) has been commonly applied. Some archetypal urban forms has been proposed to conceptualize various types of urban form, such as compact versus
“sprawl,” mono-centric, and decentralized urban form (Tsai, 2005). Probably more focus-attracting topics have been relevant to the impacts of different urban form, such as the impacts on travel behavior (Crane,2000;Boarnet & Crane, 2001;Ewing & Cervero,2001;Cervero,2002; Handy Cao, 與 Mokhtarian, 2005), travel-induced pollution, energy consumption, infrastructure, and even health issues (Lawrence and Engelke, 2005; Lawrence et al., 2005). Solutions for such problems
incorporate land-use-based prescription, such as new urbanism, compact development, and smart growth.
However, urban form or built environment at the larger form, such as national level, is not clear, which however been applied in some national level spatial planning. This concept of
built-environment form at the national level may be better symbolized as “national spatial structure.” What is unclear about urban form or built environment ranges from the fundamental concept,
definition and functions, to its empirical evidence. The unclear concept of “national spatial structure” may be underscored by on the one hand, the limited application cases of national-level spatial plans worldwide, mostly implemented in Europe, and some Asia nations, and on the other hand, limited research focusing on this topic, plus most of related being report-based, rather than more
research-robust academic papers.
Research Purposes
This research aims to address the definition of “national spatial structure” and roles that it can functions in the realm of promoting sustainability. To fulfill these Research tasks consists of 1) the definition, types, functions of “national spatial structure,” 2) the (spatial) elements constituting “national spatial structure,” and their relationship with social, economic, and environmental sustainability, 3) variables quantifying “national spatial structure”
Research Methods
This research is conducted by incorporating two types of data sources- literature and an international survey. The international survey instrument (a few pages of the survey instrument is in the appendix) is designed for academics, planners, and planning officials of countries which have ever involved in “national spatial planning” and regional-level planning, composed of Taiwan, Japan, South Korea, and Israel of Asia, and the Netherlands, Germany, Denmark, Ireland, Spain, Italy, the United Kingdom, Sweden, Belgium, France, and Greece of Europe, totaling 14 countries.
National-Level Spatial Planning: Survey Results
The response rate was some 21 percent, not particularly ideal, possibly due to the following reasons: first, the nature of the large scope of national level spatial planning (national spatial planning for short hereafter) issue which is not easy to comprehend; second, limited relevant information (such as evaluation reports, papers) on national spatial planning; and/or the vagueness of national spatial planning in terms of the existence of official plan as opposed to other forms of plans/documents with the essence or contents of national spatial planning. The valid questionnaires were 14, from nine nations, mostly in Europe, i.e., Germany (1 response), Israel (1), Italy (1), Slovenia (1), Slovenia (1), Sweden (2), Taiwan (2), The Netherlands (1), and United Kingdom (4). Among these 14
questionnaires, two were filled out by governmental officials, and the rest were from academics.
National-level Spatial Planning
Among of surveyed nations, eight countries are reported to have national spatial plans of some sort, of which Sweden discontinued its “national plan” since it was not considered as an effective tool the objectives set up. National spatial plans first appear among the valid response cases in the 1940s, which includes United Kingdom (1947), Italy (1942), Germany (1949), and followed by Israel (1950), The Netherland (1958), Taiwan (the 1970s), and Slovenia (1986). However, the question soliciting this information reveals the inconsistence of recognition of “national spatial plan” among some
interviewees, the national spatial plans of which may not has hold a lawful position, or it only exists in other form. The inexistence of an official “national spatial plan” may imply the difficulty of spatial plan at the national level.
Germany’s constitution of 1949 indicated that spatial planning should achieve equivalent living conditions in all regions of Germany. Planning on the national level is in Germany quite weak, and the most important level is the federal states. However, it is hard to say in which phase they are, because there are no real phases; the changes are a continuing process. Some new tasks came to spatial planning due to the German reunification in 1990 to increase the standard of living in East Germany.
In Sweden, in the 1960´s a national physical plan was developed mainly to guide the location of new oil refineries. However, the national physical plan was discontinued in the 1980s, since then rather than a ‘national plan,’ national government has had the ambition to steer land use planning via special (sector) legislation for, for instance, the environment, recreation, roads. Thus national government provides a framework for spatial planning, under which most of planning responsibilities lies with the municipalities. Each municipality is obliged to have a comprehensive plan, covering its entire territory. The plan should be in accordance with national laws and should show the intended land use in a long term perspective.
In the United Kingdom, It takes the form Planning Policy Guidance Documents on specific topics rather than a spatial plan. They are produced continuously as needed rather than in phases.
However, National Spatial Planning in the United Kingdom has never been done for the whole country, and also never in England; but National Spatial Plans for the whole devolved territories of Scotland and Wales have existed since devolution in 1997. Both the Scottish and Welsh plans are currently under revision in a second round of preparation at this time (May 2007). It is expected that drafts will be available in 2008.
However, whether a nation has implemented a “national plan” or owned such a plan in many cases is subject to individual judgment and hard to reach identical conclusion, such as the cases of the United Kingdom and Taiwan. For example, in the UK, although one would normally date a national planning policy back to the Town and Country Planning Act, 1947 there are earlier examples of planning legislation from 1909 and 1919, although these Acts were weak and poorly enforced. Indeed one could trace `planning policy’ further back to some of the Public Health legislation in the last quarter of the nineteenth century. If one is talking about Spatial Planning in terms of say the European Spatial Development Perspective (ESDP) then it is much more recent and I would date that to the last decade. Since the late 1990s and especially over the last five years spatial plans for the
countries making up the United Kingdom (i.e. England, Scotland Wales and Northern Ireland) have been developed as have spatial plans for the regions and even sub-regions (including some
city-regions). So the situation is rather complex.
In one interviewee’s view spatial planning in the ESDP sense is still quite new to the UK the focus has traditionally been on land-use planning and development control (deriving from the 1947 Act) and this was significantly weakened during the 1980s. Although over the last decade or so planning has experienced something of a renaissance, today it is increasingly seen as an aid to enhance economic competitiveness. Current proposals to reform the planning system would, if implemented, significantly reduce local democratic control over the system. The intention is to speed up the planning process vis-à-vis certain national infrastructure developments that are deemed of strategic importance for national (economic) development. Even though, it would not be said there is a `National Spatial Plan’ for the UK. As a result, whether a ’National Spatial Plan’ exists or not is a complex question for many academics.
Intended “National Spatial Structure”
Half of eight responding countries reported there is intended ‘National Spatial Structure,’
consisting of Israel, Slovenia, Taiwan, and the Netherland. However, it is also a tough inquiry for the interviewees and others since the notion of ‘National Spatial Structure’ is vague, and hard to define, which also lead to inconsistent answers among interviewees from the same country.
There is no real national spatial structure given by the ministry in Germany. Nonetheless new guiding principles has been made together by the ministry with the states in June 2006, which holds a map with macro-regions with metropolises in its cores. The plan is to connect the surrounding areas to the metropolitan core to form supraregional partnerships. The goal is also that weak and peripheral areas can participate in economic growth in the cores and some other good developing regions. There are three guiding principles, one concerning growth and innovation, another concerning securing basic infrastructure for the public and the third managing the cultural landscape.
The national spatial structure of the Republic of Slovenia is defined in its spatial development strategy adopted in 2004. It base on three spatial systems: settlement, infrastructure and landscape. The national spatial structure therefore base on the efficient interlinking of these three systems in a
unique spatial structure that corresponds to the international challenges with the national/regional spatial potentials. On the basis of the National development Strategy the Parliament has adopted the program on the national development projects 2007 - 2023. It consists of the list of the main
developmental projects that are concentrated in the main cities.
Since the 1960s several white papers have been produced dealing with regional differences in Sweden, as regard to income per capita, population changes, supply of public services, etc. Up till the late 1990s some studies concluded that the national policy should support employment growth in the regions lagging behind. As a consequence several national authorities have been relocated from the capital city Stockholm to smaller cities in other regions during the last decades. Furthermore, the lagging regions have got transport subsidies and other kinds of support.
In the Netherland, Nota Ruimte (National Spatial Strategy for the Netherlands) (2005), promotes a layer approach (surface layer, network layer, occupation layer) and four main objectives: 1) strengthening the international competitive position of the Netherlands, 2) strong cities and a vibrant dynamic countryside, 3) preserving and developing important national and international values, and 4) ensuring public safety. It includes the division between built and non-built environment, the national infrastructure network, and the ‘national ecologic main structure’ (the most important nature areas). Moreover, 6 ‘urban networks’ are defined, which are supposed to be the most important concentrations of employment and the most important infrastructure hubs.
Finally, in the UK, even though none specific pattern of ‘National Spatial Structure’ is established, a polycentric urban strategy is followed in accordance with the guidelines in the ESDP. The main determinant is a hierarchy of service settlements from major cities down to important service towns.
Boarnet, M. G. and R. Crane, 2001. Travel by Design: The Influence of Urban Form on Travel. New York: Oxford University Press.
Cervero, R., 2002. Built Environments and Mode choice: Toward a Normative Framework. Transportation Research D, Vol. 7, 2002, pp. 265-284.
Cervero, R., and K. Kockelman, 1997. Travel Demand and the 3Ds: Density, Diversity, and Design. Transportation Research D, Vol. 2, 1997, pp. 199-219.
Crane, Randall, 2000. The Influence of Urban Form on Travel: An Interpretive Review. Journal of Planning Literature, Vol. 15, No. 1, pp.3-23.
EU,2005。European Spatial Development Perspective (ESDP)
http://europa.eu.int/comm/regional_policy/sources/docoffic/official/reports/som_en.htm (Checked on 12/26/2005)
Ewing, R., and R., Cervero, 2001. Travel and the Built Environment: A Synthesis. Transportation Research Record, 1780, pp. 87-114.
Handy, S., Cao, X., Mokhtarian, P.L., 2005b. Does Self-selection Explain the Relationship Between Built Environment and Walking Behavior? Empirical Evidence from Northern California. Journal of the American Planning Association, forthcoming.
Lawrence D. F. and Engelke, P 2005. “Multiple Impacts Of The Built Environment on Public Health: Walkable Places And the Exposure To Air Pollution.” International Regional Science Review. Lawrence, D. F., et al, 2005. Linking Objective Physical Activity Data with Objective Measures of
Urban Form. American Journal of Preventive Medicine. Volume 28, No. 2S
Kockelman, K., K., 1997. Travel Behavior as Function of Accessibility, Land Use Mixing, and Land Use Balance: Evidence from San Francisco Area. Transportation Research Record, 1607, pp. 116-125.
Schwanen, T., Mokhtarian, P.L., 2005a. What affects commute mode choice: neighborhood physical structure or preferences toward neighborhoods? Journal of Transport Geography 13, 83-99. Susan Handy, Xinyu Cao, Patricia Mokhtarian, 2005a. Correlation or causality between the built Tsai, Y. H., 2005. Quantifying Urban Form: Compactness versus ‘Sprawl,’ Urban Studies, Vol. 42, No.
(四)計畫成果自評 本計畫成果內容依原計畫執行,但因回收率較預期稍低,又進行第二輪問卷調查, 但問券回收仍不甚理想,樣本數仍低。然因本研究本為質性與量性綜合的研究,因此質 性研究比重因此調高。 此研究已有初步研究成果,與部份研究上的新發現,將於後續相關研究持續進行。 研究成果可區分為政策應用與學術價值兩方面:其政策應用價值在於國土計畫與區域計 畫空間結構的應用方式;其學術價值在於,探討國土空間結構的定義、呈現形式等。研 究成果將就文獻上不足進行補充,預期於近期內投稿 SSCI 國際期刊。
National-level Spatial Planning, in a narrow sense, could refer to planning tools, public policies, and plans used by public sectors to influence the spatial distribution of people and activities at national level (Wikipedia).
“National Spatial Structure,” in a narrow sense, could refer to the spatial distribution pattern of people Appendix A: Example Questions of Survey Instrument
II. National-level Spatial Planning and Intended “National Spatial Structure” of Your Country
1. Please indicate which of the following statements that best describes the status of “national-level spatial planning” in your country.
2 It has never been applied in my country, but it is being considered right now.
1 It has never been applied in my country. Please stop here. Your assistance is very much appreciated.
3 It has been applied in my country since the 1960s, and it is in phase 1 2 3 4 5
4 It was once applied in my country, but was discontinued in year _______. Why was it discontinued?
(Please use as much space as you need below.)
____________________________________________________________________________________
____________________________________________________________________________________
2. Does/did your national-level spatial plan or the like adopt an intended “national spatial structure?”
0No. (Please skip to Question 5.)
1 Yes. What is the latest version of the intended “national spatial structure?”
6. Please tell us what policies/plans have ever been applied to encourage and concentrate development in certain centers or corridors, and how effective have they been to date? (“1” being “minimal effectiveness,” and “7” being “significant effectiveness.”)
Policies or Plans Tools
Applied?
Effectiveness on Encouraging and Concentrating Development Minimal Moderate Significant
1. Highway/Expressway Policies/Plans Yes
No 1 2 3 4 5 6 7
2. High-speed Rail Policies/Plans Yes
No 1 2 3 4 5 6 7
3. Mass Rapid Transit Policies/Plans Yes
No 1 2 3 4 5 6 7
4. Conventional Railroad Policies/Plans Yes
No 1 2 3 4 5 6 7
5. Airports Policies/Plans Yes
No 1 2 3 4 5 6 7
6. Seaport Policies/Plans Yes
No 1 2 3 4 5 6 7
7. Water Supply Policies/Plans Yes
No 1 2 3 4 5 6 7
8. Power Station Policies/Plans Yes
No 1 2 3 4 5 6 7
9. New University Policies/Plans Yes
No 1 2 3 4 5 6 7
10. Science Park Policies/Plans Yes
No 1 2 3 4 5 6 7
11. Expedited Entitlement Review for Private Development Projects
Yes
No 1 2 3 4 5 6 7
12. Underwriting of Land Costs for Private Development Projects
Yes
No 1 2 3 4 5 6 7
13. Assistance with Land Acquisitions for Private Development Projects
Yes
No 1 2 3 4 5 6 7
14. Tax Abatement for Private Development Projects
Yes
No 1 2 3 4 5 6 7
行政院國家科學委員會補助專題研究計畫
■ 成 果 報 告
□期中進度報告
(計畫名稱)
「國土空間型態或結構」的定義與功能--由永續發展觀點
計畫類別:■ 個別型計畫 □ 整合型計畫
計畫編號:NSC 95-2415-H-004 -023 -SSS
執行期間:2006 年 8 月 1 日至 2008 年 7 月 31 日(展延一年)
計畫主持人:蔡育新
共同主持人:無
計畫參與人員:無
■出席國際學術會議心得報告及發表之論文各一份
執行單位:國立政治大學地政學系
(五)附件:出席國際學術會議心得報告 報告人姓名 蔡育新 服務機構 及職稱 國立政治大學地政學系 助理教授 時間 會議 地點 2008 年 7 月 6 日至 7 月 11 日 本會核定 補助文號 計畫編號: NSC 95-2415-H-004 -023 -SSS 流水號: 94WFD0600458 會議 名稱 (中文) 2008 美國大學都市計畫學會與歐洲大學都市計畫學會聯合年會 (英文) Fourth Joint Congress of Association of Collegiate Schools of Planning
and Association of European Schools of Planning 發表
論文 題目
(中文) 混和土地使用對房價的影響:解析可及性、密度與混合使用 (英文) Impact of Mixed Use on House Prices—Disentangling Accessibility,
Density and Mixed Use. 報告內容: 一、參加會議經過 個人於會議議程開始前數日,即先抵達美國密西根州安納堡市(Ann Arbor)的密西根 大學(University of Michigan),以利用其北美洲前五大典藏規模的圖書館,蒐集國內尚 無的學術期刊論文。研討會期間,除第三日發表論文外,另每日參加相關領域的數場論文 發表,並與數位發表人交換心得。 二、與會心得 此國際會議參與人數、發表論文的質與量,因為少數次歐美聯合年會,因此原已為大 規模的研討會,幾乎擴大兩倍為超大型國際會議。於會議中與不少國際專家學者進行學術 交流與意見交換,除獲得專家學者對個人發表論文的建議外,另不例外的,在此全美最大 規模之一的都市計畫研討會中,與過去的教授、同學、與同事再次聯絡上。 三、攜回資料名稱及內容
Fourth Joint Congress of Association of Collegiate Schools of Planning and Association of European Schools of Planning (CD ROM).
0
(六)附件:出席國際學術會議論文 (論文進行中,請勿引用)
Abstract
One of the primary objectives of transit-oriented development (TOD) is to provide affordable housing in rapid transit station areas for transit-dependent
households. However, this objective could be hampered due to high housing prices in station areas, leading to gentrification issue. Past research already shed lights on the impacts of density, mixed-use (i.e., TOD tools), and accessibility on housing prices. However, a few gaps remain: First, the relationship between accessibility, density, and mixed-use is still puzzled. Second, the relationship between mixed use and housing prices at different spatial scales seems not clear. Finally, the role of higher floor area ratio (one type of high density tool) to reduce housing prices through smaller land share of per-unit-floor-area is not yet clear since it is also positively correlated with building cost, and per-unit-land-area prices.
This empirical research aims to fill in the above gaps by conducting the tasks below. The first task is to analyze the concepts, variables, and relationship between accessibility, density, and mixed use in the housing prices realm. The second task is to evaluate the impact of mixed use on housing prices, for which three hypotheses are developed: mixed use at different spatial scale affects housing prices differently; the more the types of other uses, the higher the housing prices; quantity-based
accessibility affects housing prices. To accomplish this task, hedonic price modeling is applied for the empirical case of Taipei, Taiwan. The primary data sources include 2001 Taipei Real Estate Database, 2000 Taipei Land Use Database for each address in the city. Geographic information systems is applied to develop mixed-use and accessibility data.
The research findings suggest that mixed use at space scale within a block or smaller, deducts more residential value due to degrading residential amenities, than the added value from the improved accessibility. Mixed-use at
self-and-surrounding-blocks level, however, benefits residents more than the negative impact it brings on. The research results also suggest more types of compatible residential-needs uses in neighboring blocks afford residents to accomplish various types of daily-life activities within walking distance. This research also reveals that higher quantity of one type of land use does not significantly improve level of actual accessibility, reflected on housing prices.
land uses provides better accessibility—friendly mixed-use environment, which, however, leads to higher housing prices. The increased housing prices are likely to prevent transit-dependents, mostly low income people, from moving in, which happens to contradicts one of TOD’s goals, and results in unfulfilled consumer demand of residential self-selection. Hence this research suggests raising floor area ratio cap, which on the one hand, may lead to lower housing price per unit floor area,
and on the other hand, increases housing supply in TOD areas.
The already attention-grabbing new urbanism, transit-oriented development (TOD), and compact city (Cervero and Kockelman, 1997; Grant, 2002), when gas hike and global warming are hitting us global-wide, are very likely to gain a lot more spotlights than before from not only planning academia, but also planners, and even government officials, and general public. These significant, dramatic changes in the primary, dominant energy source and weather affect so many aspects of the daily life of almost everybody at the astonishing global scale, which seems not have happened in the history of human beings. Without the long-term panacea and solutions within our sights, the market demand for more energy-efficient, low carbon-dioxide-emission urban form may gradually grow stronger.
With the expectation of potentially growing market demand for energy and
emission-efficient urban form, including TOD, a few policy, theoretical and methodological gaps remain further efforts. First, one of the primary goals of TOD is to provide
affordable housing in rapid transit station areas for transit-dependent households.
However, this goal could be hampered due to the generally higher housing prices in station areas, on the one hand. On the other hand, if accessibility level can be raised by higher, compatible mixed use, housing prices may increase as a reasonable economic response. This housing price increase due to mixed use of TOD tools, unfortunately, conflict its goal.
Secondly, the distinction between mixed use and density is clear. However, when assessing their impacts on energy consumption, travel behavior (Ewing, et al., 1996), and housing prices, more than occasionally the establishment of impact mechanism
automatically involve not only the concept of accessibility, but also its measurement variables. For example, both density and mixed-use affect accessibility, leading to impact on travel mode choice, trip distance, etc. When accessibility variables are introduced, their concepts, definitions, and impact become complex due to its blending with density and mixed use. In addition, only limit past research shed lights on the impact of
mixed-use on housing prices (Cao and Cory, 1981; Cervero and Duncan, 2004); the extent to which mixed use at different spatial scales (e.g., in-building (vertical), in-block, and self-and-surrounding-block mixed use) seems not yet clear. Finally, how high floor-area
2
ratio, as significant TOD tool for controlling density affects housing price is not clear, given the ground that it could affect several aspects of housing prices, including raising
per-unit-land-area value, lowering land area share of per unit floor area, and increasing building cost per unit floor area.
The purposes of this empirical research are two folds: to disentangle the concepts, variables, and relationship between accessibility, density, and mixed use in the housing prices realm; to evaluate the impacts of mixed use as well as accessibility and density on housing prices, for which three hypotheses are developed: (1) from the spatial perspective, mixed use at different spatial scale affects housing prices differently, (2) from the
perspective of number of land use types, the more the types of other uses, the higher the housing prices, and (3) from perspective of quantity of land uses (e.g., floor area),
quantity-based accessibility affects housing prices. To accomplish this task, hedonic price modeling is applied for the empirical case of Taipei, Taiwan. The primary data sources include year 2001 Taipei Real Estate Database, 2000 Taipei Land Use Database for each address in the city. Geographic information systems is applied to develop mixed-use and accessibility data.
Relationship between accessibility, mixed use, and density
Mixture of land use in a metropolitan area is a nature, and accessibility level is contributed by density and mixed use policies. In a metropolitan area, self-sustaining to a large degree, diverse land uses coexist within the boundary; within a metropolitan area, each and every type of land use provides acceptable accessibility to users in terms of travel time or distance, and quantities. In other words, for being self-sustained purposes, certain types and enough quantity of land uses are required, and the spatial arrangement of diverse land uses by such policy as overall spatial allocation of land uses, mixed use and density provide certain levels of accessibility.
Narrowing down to the accessibility of residential areas (households or resident to other uses, it can further be broken down by type of other uses or activities, the degree of compatible/incompatible, good or harm they cause, mostly a blend of both, and the degree of direct needs, and frequency at which households need to physically go to the land use sites to conduct activities. From perspective of type of other uses or activities,
accessibility ranges from one single land use (e.g., park accessibility, and rapid transit accessibility), to multiple land uses (e.g., work accessibility, which occurs in diverse land uses). It can also be classified by degree of compatibility/incompatibility, which can be defined by the degree of negative impact that they cause to residential areas. Furthermore, It can as well be classified by the degree of good and harm as a whole that a land use bring
to the house, e.g., Not-In-My-Backyard (NIMBY), and Yes-In-My-Backyard (YIMBY). In addition, some land uses are of direct need for residents (such as commercial areas for shopping), but some are of indirect needs (such as garbage dumping site). Some are of frequent needs (such as shopping), but some are of less frequent needs (such as city hall). Accessibility may not a neutral term; it may mostly implies to some land use in need.
From the perspective of spatial distribution of land use, as oppose to transportation perspective, level of accessibility is determined by spatial planning/ land use planning for a metropolitan area. In this regard, two most essential, important tools of land-use planning are spatial allocation and arrangement of land uses, and the level of intensity to which a parcel is planned to be utilized; the former includes land use map showing the overall spatial relationship for all land uses, and mixed-use ordinances specifying for smaller spatial scale arrangement among land uses, and the latter involves density policy, floor area ratio ordinances. Based on this ground, both mixed use and density of planning tools or input contribute to accessibility of an evaluation index or output.
The concept of mixed use is quite clear, but the definition is quite diverse. From the perspective of accessibility of residents, mixed land use can be defined as the mixture of residential and other uses to which residents will go to serve their needs (i.e., direct-needs perspective) once in a while (frequency perspective) within a relatively small distance (e.g., within self-and-surrounding blocks) (residential-need land use for short hereafter).
Mixture of land use at large spatial exist by nature, such as in a city. Spatial scale partially affects definition of various different types of mixture, such as jobs/housing balance of large spatial scope, and mixed land use of small scope. Another dimension distinguishing them is type of activities/trip purposes, i.e., work and non-work trips.
Variables measuring accessibility, attributed to mixed use and density
This section analyzes and organizes accessibility variables based on the above concept that both mixed use and density attribute to level of accessibility. Past research has
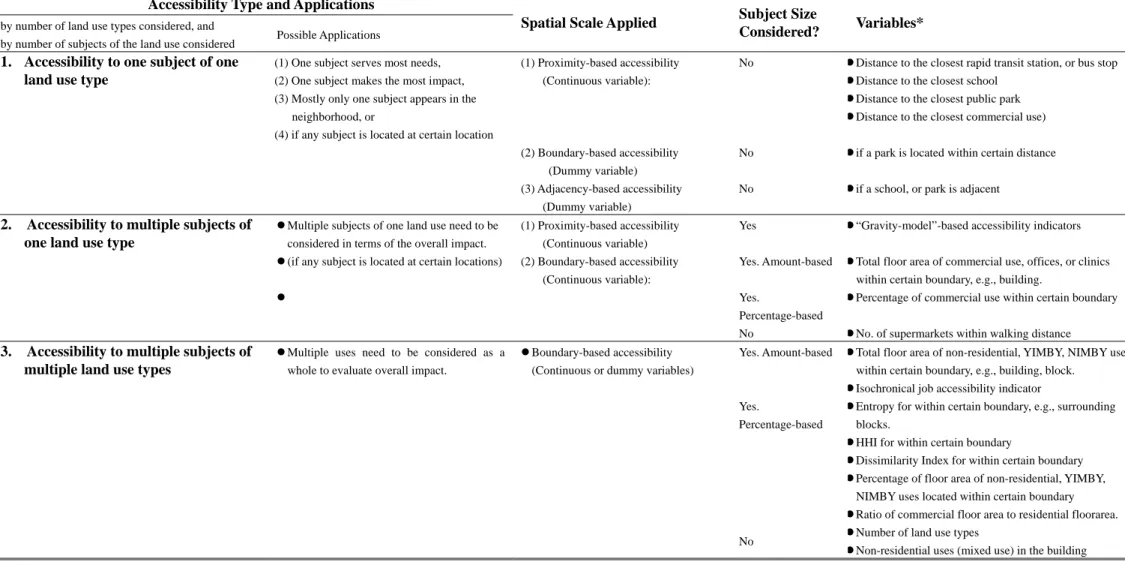
applied a number of variables characterizing accessibility and mixed use, some of which are intermingled, and others involve proximity variables. This complex relationship among them remains a challenge to disentangle and classify them. Accessibility variables in this research are classified from the facets of (1) number of subjects (e.g., single or multiple subjects of commercial use), and number of land use types, (i.e., single or multiple land use types), incorporated to measure accessibility, (2) spatial scale applied to assess accessibility, e.g., proximity-based accessibility, boundary-based accessibility, and adjacency-based accessibility, and (3) if size of subject, e.g., floor area, is considered to
4 quantifying accessibility (Table 1):
1. Accessibility to one subject of one land use type: This type of accessibility variables is probably suitable for measuring those land use of which one single, major object (1) serves the most needs (e.g., a public park), (2) makes the most difference for the impact in
question, (3) is the only one object of this land use appearing in the neighborhood, or (4) is examined if it is located at certain location (e.g., if a park is adjacent or not) (Table 1). For this type of accessibility, usually proximity measured by distance is applied, such as distance to the closest mass rapid transit station, a park (Song, 2005). Boundary-based and adjacency-based accessibility variables can also be developed, such as if a park is located within walking distance, and if a park is located adjacent to the housing,
respectively. The selection of the variables is highly dependent on the situations, such as adjacency-based variables applied to measure if a view exists or not.
2. Accessibility to multiple subjects of one land use type: If single-object accessibility variables cannot quantify the effect of the single land use in question, then multiple-subject accessibility variables can be applied alternatively (Table 1). There are basically two ways of measure multiple subjects of one use jointly: one way mimics gravity model, in which impact can be calculated by summing up the magnitude of each subject and weighting it by reciprocal of squared distance, or the like (e.g., 1/d)). For the gravity model-based variables, the closer the subject, the higher the accessibility is; the larger the size of the subject, the higher the accessibility is. The other way is to count the magnitude of the all the subjects located within certain boundary, that is to weight them by “one” if the subjects are located within it, and vice versa. The latter are chosen for two reasons, at least:
Table 1 Accessibility Variables: By Number of Land Use Types Considered, by Number of Subjects of the Land Use Considered, by Spatial Scale, and by Size/Quantity
Accessibility Type and Applications
Spatial Scale Applied Subject Size
Considered? Variables*
by number of land use types considered, and
by number of subjects of the land use considered Possible Applications
1. Accessibility to one subject of one land use type
(1) One subject serves most needs, (2) One subject makes the most impact, (3) Mostly only one subject appears in the
neighborhood, or
(4) if any subject is located at certain location
(1) Proximity-based accessibility (Continuous variable):
No z Distance to the closest rapid transit station, or bus stop z Distance to the closest school
z Distance to the closest public park z Distance to the closest commercial use) (2) Boundary-based accessibility
(Dummy variable)
No z if a park is located within certain distance
(3) Adjacency-based accessibility
(Dummy variable)
No z if a school, or park is adjacent
2. Accessibility to multiple subjects of one land use type
z Multiple subjects of one land use need to be considered in terms of the overall impact.
(1) Proximity-based accessibility (Continuous variable)
Yes z “Gravity-model”-based accessibility indicators z (if any subject is located at certain locations) (2) Boundary-based accessibility
(Continuous variable):
Yes. Amount-based z Total floor area of commercial use, offices, or clinics within certain boundary, e.g., building.
z Yes.
Percentage-based
z Percentage of commercial use within certain boundary No z No. of supermarkets within walking distance
3. Accessibility to multiple subjects of multiple land use types
z Multiple uses need to be considered as a whole to evaluate overall impact.
z Boundary-based accessibility (Continuous or dummy variables)
Yes. Amount-based z Total floor area of non-residential, YIMBY, NIMBY uses within certain boundary, e.g., building, block.
z Isochronical job accessibility indicator
Yes.
Percentage-based
z Entropy for within certain boundary, e.g., surrounding blocks.
z HHI for within certain boundary
z Dissimilarity Index for within certain boundary z Percentage of floor area of non-residential, YIMBY,
NIMBY uses located within certain boundary z Ratio of commercial floor area to residential floorarea.
No z Number of land use types
8
1. for purposes of easy calculation, or the impact of the subject only works within the boundary.
Multiple uses considered: Single land use may affect accessibility, however, multiple uses of those with direct needs to residents may work together to constitute level of convenience, or self-sustainment of a neighborhood. A bunch of variables has been developed, ranging from number of land use types (Levine, et al., 2005), to variables measuring distribution of different land uses or percentage-based variables, such as Entropy (Cervero and Duncan, 2004.), and Herfindahl-Hirschman Index (HHI), ratio of commercial, industrial and public use to housing units (Song, 2005), to variables counting the subject size, such as 30-miunte isochronical job accessibility indicator (Table 1). Entropy measures the extent to which land uses are equally distributed. HHI is similar but use a different way of weighting in the calculation. These variables are probably by far the best ones that researchers can apply, but they both are not sensible in differentiating cases of the same overall distributions regardless which land use is of the highest distribution. For example, Entropy of a case with a 3:7 distribution is the same of case 2 with a 7:3 distribution.
The entangling of accessibility with mixed-use and density is well expressed in Table 1. All types of accessibility variables in Table 1 can adopt any spatial scale necessary. However, when focusing on the spatial scale that is adopted when measuring mixed use, e.g., self-and-surrounding blocks, one block, or one building, all the accessibility variables are attributed by mixed-use. While only those accessibility whose subject size is counted by floor area or the like (i.e., amount-based) are attributed by density given the boundary is the same.
Impact of accessibility, density and mixed use on housing prices
How neighboring land uses affects residential prices can be analyzed from at three perspectives, at least—spatial-scale, number-of-types, and (subject-/land-use-) size perspectives. From spatial-scale perspective, spatial relationship between two land use types exist if one interact with the other, either voluntarily or unavoidably, either with positive effect or negative. Multiple impacts of one land use type, including both positive and negative, complicates its spatial relationship with housing. For instance, given others equal, individuals are likely to live closer to transportation facilities since proximity reduces transportation costs; meanwhile, however, proximity also bring in negative impact, such as noise (Boyle and Kiel, 2001). Based on the joint effects of positive and negative effects (or utilities and dis-utilities) of another use on housing, four types of archetypal spatial preference can be identified for different types of land use—(1) the closer, the better, (2) close, but not too close, (3) far, but not too far, and (4) the farther, the better. For instance, for a hypothetical YIMBY land use, its preferred spatial relationship to housing can be “the closer, the better;” on the contrary, YIMBY land use is of the “the farther, the better” category. However, most land uses may reveal different
combinations of positive and negative impacts at different distance. Hence, their spatial relationship can be in-between the above two extreme cases. Another side distance-based hypothesis is adjacency is the best, such as view-based preference.
The above four types of preferred archetypal spatial relationship of housing with other land uses; while multiple land uses are considered simultaneously, the dimension of the number of land use types (types-perspective for short hereafter), affecting overall level of accessibility and negative impacts, may also demand analysis in terms of affecting housing prices. Theoretically, the more the types of residential-need land use, the higher the accessibility is, which in turn, leads to higher housing prices if not offset by accompanying negative impacts. There has been a few ways quantifying accessibility to all uses, that is, the mixed-use accessibility, as opposed to quantity-based accessibility.
Size (of subject or land-use)-based accessibility (quantity-based for short hereafter) may also affect housing prices positively and negatively. However, it is unclear whether more opportunities are better than just enough opportunities; just enough quantities for each kind of uses may, may work equally well as a vast amount of this use, just like one convenient stores may serve as well as a bunch of convenient stores. In addition, it is not clear about the extent to which improving opportunities and increasing exposure to cancel out each other.
Research hypotheses and methods
To evaluate the impact of mixed use on housing prices, accessibility and density have been incorporated to provide better theoretical framework. Utilities and dis-utilities of housing and neighborhood characteristics are reflected on housing prices in hedonic pricing models. By the same token, housing prices in the hedonic pricing models can reflect the utilities impacts of other land uses on residential unit can, including accessibility, contributed by mixed-use and density. Based on the previous sections, mixed use, as a policy tool, can affect housing prices via the changes in accessibility it attributes to, together with density among others.
Three research hypotheses about the impacts of mixed use on housing prices are developed: first, from spatial-scale aspect, mixed use at different distance affects housing prices differently. The impacts can be further broken down by types of uses, and from aspects of single use versus aggregated measure of various uses. If types of residential mixed use are confined to residential-need uses, then the impacts can fall into the first three types of four archetypal relationships, i.e., “the closer, the better,” “close, but not too close,” and “far, but not too far.” Second, from number-of-types aspect, the more the residential-need types, the higher the housing prices are. Third, from the land-use-size perspective, overall magnitude of the land use size (e.g., floor area ratio) affects housing prices positively. Another side-hypothesis worthy of testing is the impact of floor-area-ratio (FAR)
permitted on housing prices: floor-area-ratio permitted, representing density within a building, as well as affecting area-wide density, can affect housing prices in at least three aspects: higher FAR permitted
10
increasing the value of per unit land area due to more space to utilize, lowered share of land cost per unit floor area, and increasing building cost per unit floor area due to more building floors associated with higher FAR permitted.
To examine these research hypotheses, hedonic pricing models are developed for Taipei, Taiwan as an empirical study. Taipei provides a good case where mixed-use is popular, and the spectrum of mixed use is relatively wide, composed of in-building, vertical mixed use, in-block and between-block mixed use of horizontal mixture. The primary data sources to include 2001 Taipei Real Estate
Database (Taipei City Government, 2001), 2000 Taipei Land Use Database (Taipei Revenue Service, 2000), providing land use of each address. After goecoding between these two databases, 761 sale cases of residential unit are gathered. Geographic Information Systems (GIS) is the major tool to develop mixed-use, accessibility variables.
Development of Taipei residential mixed-use hedonic pricing models
To evaluate the impacts of mixed use, two hedonic pricing models are developed: a
per-unit-floor-area housing price model, and a total housing price model, which is mostly applied in housing appraisal.
Mixed-use variables include number-of-types-based (e.g., Entropy, HHI), quantity-based accessibility (e.g., total land/floor area of non-residential uses) at spatial scales smaller than
self-and-surrounding block, i.e., in-block, and in-building scale (Table 2), which is in more accord to neighborhood spatial scale of mixed use. Keep in mind that total land/floor area of non-residential uses are attributed by not only mixed-use, but also density. Other mixed use variables, such as continuous variable of “percentage of total land/floor area of residential-needs land use”, dummy variable of “mixed-use block,” and adjacency-based dummy variable of “park located across the street” are all developed. Control variables are also broken down by spatial scales: residence, building, block, self-and-surrounding-block, and district, including floor area, floor where the residence was located, age of building, number of building stories, FAR permitted, zoning type, total floor area in the block, and city district where the residence was located (Table 2).
The land use incorporated to measure mixed-use-based accessibility for residential are confined to seven compatible, residential-needs types, which are commercials, offices, medical, schools, cultural, religion, and parking. Both residential-incompatible and non-residential-needs land uses are not intended subjects for mixture with residential, and hence are excluded in calculating mixed-use-bases accessibility. Residential-incompatible uses, in theory, are less likely to be allowed or planned to reside near residential. NYMBY uses, for example, are likely be kept as far as possibly from residential areas by planners in principle, or buffered away if closeness is inevitable.
Non-residential-needs land uses, though compatible or with other positive benefits, by definition, barely serve their needs, such as agriculture.
Table 2 Variables applied in developing Taipei residential mixed-use hedonic price models
Variable Alternative Variable(s)
Residence Characteristics:
Floor area of the residence (Meter2)
Residence located on the first floor (1=Yes; 0=No)
Building Characteristics:
Age of the building (Year) Number of floors (Floor) Building types:
1-2-story building (brick-made building ) (1=Yes; 0=No)
3-5-story building (condominium without elevators) (1=Yes; 0=No) >= 6-story building (condominium with elevators) (1=Yes; 0=No) Zoning*:
Maximum building coverage rate permitted (%) Maximum floor-area rate permitted (%) Residential/Commercial zoning type*:
Residential I (1=Yes; 0=No) Residential II (1=Yes; 0=No) Residential III (1=Yes; 0=No) Residential III-1 (1=Yes; 0=No) Residential III-2 (1=Yes; 0=No) Residential IV (1=Yes; 0=No) Commercial I (1=Yes; 0=No) Commercial II (1=Yes; 0=No) Commercial III (1=Yes; 0=No) Commercial IV (1=Yes; 0=No)
Width of front road (Meter)
Total floor area of the building (Meter2) Total floor area of residential use in the building
Block Characteristics:
Total floor area in the block (Meter2) Total floor area of residential use in the block (Meter2)
Characteristics of Self-and-Surrounding Blocks
Total floor area in the self-and-surrounding blocks (Meter2) Total floor area of residential use in self-and-surrounding
blocks (Meter2) District** Bei-tou District** (1/0) Da-an District (1/0) Da-tong District (1/0) Nan-gang District (1/0) Nei-hu District (1/0) Shi-lin District (1/0) Song-shan District (1/0) Wen-shan District (1/0) Xin-yi District (1/0) Zhong-shan District (1/0) Zhong-zheng District, (1/0)
Accessibility to non-residential uses —mixed use at different spatial scales
Building scale:
Total floor area of commercial use in the building (Meter2)
Total floor area of non-residential use in the building (Meter2) Percentage of floor area of non-residential uses located in the building (%)
Non-residential uses (mixed use) in the building (1/0) Self-Block Scale:
Total floor area of commercial use in the block (Meter2) Total floor area of commercial use useful for residents in the block (Meter2)
Total floor area of commercial use not useful for residents in the block – Hotels (Meter2)
Total floor area of clinics in the block (Meter2) Total floor area of offices in the block (Meter2) Total land area of schools in the block (Meter2)
12
Total floor area of religious use in the block (Meter2)
Total land/floor area of parking lots in the block (Meter2)
Total land/floor area of public facilities/offices in the block (Meter2)
Total land/floor area of residential-needs uses in the block (Meter2) Percentage of total land/floor area of residential-needs
uses in the block (%)
residential-needs mixed-use block: non-residential uses located in the block (1/0)
Total land/floor area of non-residential uses in the block (Meter2) Percentage of total land/floor area of non-residential uses
in the block (%)
Mixed-use block: non-residential uses located in the block (1/0)
Self-and-Surrounding Block Scale:
Total floor area of commercial use in self-and-surrounding blocks (Meter2)
Total floor area of commercial use useful for residents in self-and-surrounding blocks (Meter2)
Total floor area of commercial use not useful for residents in self-and-surrounding blocks– Hotels (Meter2)
Total floor area of clinics in the self-and-surrounding blocks (Meter2)
Total floor area of offices in self-and-surrounding blocks (Meter2)
Total land area of schools in self-and-surrounding blocks (Meter2) School located across the street (1/0)
Total land area of private education/community service in self-and-surrounding blocks (Meter2)
Total floor area of religious use in self-and-surrounding blocks (Meter2)
Total land/floor area of parking lots in self-and-surrounding blocks (Meter2)
Total land/floor area of public facilities/offices in self-and-surrounding blocks (Meter2)
Total land/floor area of residential-needs uses in self-and-surrounding blocks (Meter2)
Percentage of total land/floor area of residential-needs uses in self-and-surrounding blocks (%) residential-needs mixed-use block: non-residential uses
located in self-and-surrounding blocks (1/0) Total land/floor area of non-residential uses in self-and-surrounding
blocks (Meter2)
Percentage of total land/floor area of non-residential uses in self-and-surrounding blocks (%)
Mixed-use block: non-residential uses located in self-and-surrounding blocks (1/0) Entropy of self-and-surrounding blocks HHI of self-and-surrounding blocks Park located across the street (1/0)
Squared straight-line distance from residence to closest school [(10 Meter)2]
Squared straight-line distance from residence to closest park [(10 Meter)2] Squared straight-line distance from residence to closest Taipei Metro station [(10 Meter)2]
Squared straight-line distance from residence to closest park [(10 Meter)2]
Total residential floor area in the block (100 Meter2)
* Zoning controls for three primary aspects of land use in Taipei, i.e., maximum building coverage rate, maximum floor area rate, and permitted land use types. Non of residential and commercial types, except for Residential I, does not permit mixed-use of residential, commercial uses; in other words, most of residential and commercial zoning types explicitly allow certain types of mixed use of residential and commercial uses. When maximum building coverage rate and floor area rate a controlled for, residential/commercial zoning types represent the degree of mixed use permitted.
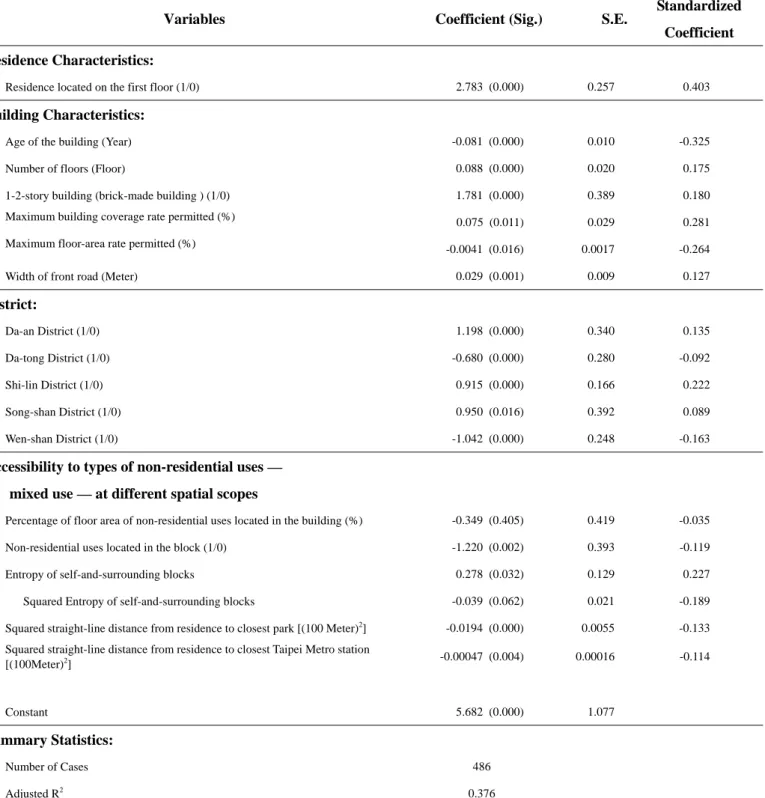
Empirical results of Taipei residential mixed-use hedonic pricing models
The results of per-unit-floor-area Taipei hedonic pricing model (Table 3) show that being located on the first-floor increases residential sale price of per-square-meter floor area by 28 thousands New Taiwan (NT for short hereafter) dollars. The reasons for the increased prices include, first, first-floor-housing carries higher potential for being converted to commercial use, might reflect conventional preference of Taiwanese for “living right on land, usually has independent entrance, may have front and back yard or space.
Residence one year older decreases per-square-meter floor area by .81 thousand NT dollars (Table 3). The sale price per square meter of 1-2-story short buildings is higher than that of taller buildings by 17.8 thousands NT dollars. This is largely due to the higher share of land cost, between 50-100 percent, of this type of buildings. Buildings of higher maximum building coverage rate (BCR) permitted are welcomed by a great portion of Taiwanese since conventional notion holds that higher BCR cap permitted is better in terms of more interior living space, better use of land, and/or lower building cost. However, higher MBCR, on the contrary, provide less open space or even green space for the buildings, and also for the city as a whole.
Interestingly, buildings with each 100 percentage points more of FAR permitted leads to a decrease of residential sale price per-square-meter floor area by four thousand NT dollars (Table 3). Higher FAR permitted can affect residential price per unit floor area in various aspects, including higher value of land, potential higher building cost per unit floor area, lower share of land cost per unit floor area, and possible lower amenity due to higher density. The joint effect of various aspect shows that increasing FAR permitted can reduce sale price per unit floor area. In addition, the higher the number of building stories, the higher the sale price per unit floor area is, echoing the higher building cost.
Compared to the base district, Wan-hua District, sale price per square meter of residential floor area is higher in Da-an District, Shi-Lin District, and Song-shan District by some 12.0, 9.2, and 9.5 thousand NT dollars, respectively, and lower in Da-tong District and Wne-shan district by 6.8 and 10.4 thousand NT dollars, respectively.
14
Table 3 2000 Taipei residential mixed-use hedonic price model— sale-price-per-unit-floor-area model
Variables Coefficient (Sig.) S.E. Standardized Coefficient
Residence Characteristics:
Residence located on the first floor (1/0) 2.783 (0.000) 0.257 0.403
Building Characteristics:
Age of the building (Year) -0.081 (0.000) 0.010 -0.325
Number of floors (Floor) 0.088 (0.000) 0.020 0.175
1-2-story building (brick-made building ) (1/0) 1.781 (0.000) 0.389 0.180
Maximum building coverage rate permitted (%) 0.075 (0.011) 0.029 0.281
Maximum floor-area rate permitted (%) -0.0041 (0.016) 0.0017 -0.264
Width of front road (Meter) 0.029 (0.001) 0.009 0.127
District: Da-an District (1/0) 1.198 (0.000) 0.340 0.135 Da-tong District (1/0) -0.680 (0.000) 0.280 -0.092 Shi-lin District (1/0) 0.915 (0.000) 0.166 0.222 Song-shan District (1/0) 0.950 (0.016) 0.392 0.089 Wen-shan District (1/0) -1.042 (0.000) 0.248 -0.163
Accessibility to types of non-residential uses — mixed use — at different spatial scopes
Percentage of floor area of non-residential uses located in the building (%) -0.349 (0.405) 0.419 -0.035
Non-residential uses located in the block (1/0) -1.220 (0.002) 0.393 -0.119
Entropy of self-and-surrounding blocks 0.278 (0.032) 0.129 0.227
Squared Entropy of self-and-surrounding blocks -0.039 (0.062) 0.021 -0.189
Squared straight-line distance from residence to closest park [(100 Meter)2] -0.0194 (0.000) 0.0055 -0.133
Squared straight-line distance from residence to closest Taipei Metro station
[(100Meter)2] -0.00047 (0.004) 0.00016 -0.114 Constant 5.682 (0.000) 1.077 Summary Statistics: Number of Cases 486 Adjusted R2 0.376 *
Accessibility to other land uses for residents are largely contributed by density and mixed use policy, in particularly at within the walking distance scale, given transportation design, policy, and condition equal. On the one hand, given others equal, mixed use provides types of non-residential uses; on the other hand, density alone, determines the quantity of non-residential uses. Based on this concept, mixed use related variables are classified into accessibility to types of non-residential, and quantity of non-residential uses. Certainly, certain variables could not be perfectly classified into the categories.
The impacts of type-based accessibility or degree of mixed use on sale price per square meter of residential floor area vary at building, self-block, and self-&-surround blocks scopes; the impacts, to certain degree, agree with the hypothesis—close, but not too close (Table 3). At the
self-and-surrounding-block scope, the statistical results of mixed use represented by Entropy and squared Entropy, reveals that more even distribution of eight types of land uses statistically increases sale price per unit floor area. At the self-block scope, mixed use, measured by if non-residential uses exist in the block, statistically decreases, however, sale price per unit floor area. At the even smaller spatial scope-building- mixed use, represented by percentage of floor area of non-residential uses located in the building, nonetheless, not statistically affect sale price, thought the impact is negative.
The impact of quantity-based accessibility to non-residential uses on sale price per square meter of residential floor area is not statistically significant (Table 3). Higher accessibility to park and mass rapid transit, represented by the squared straight-line distance form residence to the closest park, and Taipei Metro station, respectively increase sale price per square meter of residential floor area.
Among all the characteristics affecting sale price per square meter of residential floor area, entropy is the fifth most significant factor, with residence located on the first floor, and age of the building as the two most significant characteristics (Table 3).
Hypotheses testing and simulation analysis
The impacts of mixed use on housing prices of this empirical model partly support hypothesis 1 that mixed use at different distance affects housing prices differently, and the spatial relationship can be characterized as “close, but not too close,” to certain degree. Mixed use at in-block scales trims down per-unit-floor-area housing price, but it raise it at the self-and-surrounding-block scale;
mixed-use at in-building scale though reduces housing price but not statistically significant. The second hypothesis--the more the residential-need types, the higher the housing prices are-is supported by this empirical model: the more evenly distributed the residential and residential-needs land use, the
16
higher the housing price per-unit-floor-area is at the self-and-surrounding-block scale. The third hypothesis-- overall magnitude of the land use size (e.g., floor area ratio) affects housing prices positively—is not supported, possibly implying enough quantity of one land use serves residents as well as a great amount of the same land use.
The results of the model support the side-hypothesis: FAR permitted statistically affects housing prices, and this effect is positive-higher FAR permitted raises housing prices, as joint result of higher per-unit-land-area value, lowered share of land cost per unit floor area, and increased building cost per unit floor area, indicating the effect of lowered land cost per unit floor area outbeat higher land price per unit area on the per unit floor area price, given others equal, including number of building floors.
However, given the number of building stories increases housing prices, and on the contrary, higher FAR permitted reduces per-floor-area sale price, it is quite puzzling if higher FAR be applied to reduce sale price since number of building stories and FAR permitted are correlated. Given the number of building stories and others equal, higher FAR permitted reduces the share of land per unit floor area, and leading to lowered land cost per unit floor area, and hence the lower residential price per floor area. On the other hand, given the same FAR permitted and others equal, the more stories a building was built, the higher the building cost per unit floor area, leading to higher residential price per unit floor area.
As a result, it is in interesting to know the direction and quantity of the impacts the overall density in a building, as reresented by FAR and number of building stories, on residential
unit-floor-area prices. Two sets of simulation are conducted to forecast the impact of FAR permitted and number of building stories by applying the results of the Taipei residential mixed-use hedonic price model: given others equal and the building coverage rates of these two sets at 35% and 50%, respectively, each set of simulation is composed of different levels of FAR and number of building stories. Providing different levels of FAR as deviations from a base case, for example, FAR equals 120%, and number of building stores equals four for the 35% BCR set (Figure 1.a), the price
difference is displayed. In each scenario, number of building stories is calculated from their given FAR and BCR; hence, the building stories and FAR are positively correlated.
Figures 1.a and 1.b both reveal that overall the compounding effects of increased FAR and number of building stories on per-unit-floor-area housing price is negative, that is, higher FAR and building stories as a whole leads to lower per-unit-floor-area housing price. In Figure 1.a, the base case is Residential II, whose FAR permitted equals 120 percent, BCR equals 35 percent, and hence the number of building stories is four. Scenarios 1 through 6 are developed with different, but higher FAR and building stories than the base case, and each of them, as a result, has lower residential price per square meter of floor area by from $760 NT to $3,000 NT. These trends apply to Figure 5.b for BCR of 50 percent.
Figure 1.a Price Difference between Scenarios with Various FAR and Building Stories – Building Coverage Rate: 35% ‐ ‐$760 ‐$1,500 ‐$1,875 ‐$2,250 ‐$2,625 ‐$3,000 ‐3,500 ‐3,000 ‐2,500 ‐2,000 ‐1,500 ‐1,000 ‐500 0 Base Case: FAR=120%, 4 Stories Scenario 1: FAR=140%, 4 Stories Scenario 2: FAR=175%, 5 Stories Scenario 3: FAR=210%, 6 Stories Scenario 4: FAR=245%, 7 Stories Scenario 5: FAR=280%, 8 Stories Scenario 6: FAR=315%, 9 Stories Price Difference Per Square Meter of Floor Area (NT Dollars)
Figure 1.b Price Difference between Scenarios with Various FAR and Building Stories – Building Coverage Rate: 50% ‐ ‐$930 ‐$1,860 ‐$2,790 ‐$3,720 ‐$4,650 ‐$5,580 ‐6,000 ‐5,000 ‐4,000 ‐3,000 ‐2,000 ‐1,000 0 Base Case: FAR=400%, 8 Stories Scenario 1: FAR=450%, 9 Stories Scenario 2: FAR=500%, 10 Stories Scenario 3: FAR=550%, 11 Stories Scenario 4: FAR=600%, 12 Stories Scenario 5: FAR=650%, 12 Stories Scenario 6: FAR=700%, 13 Stories Price Difference Per Square Meter of Floor Area (NT Dollars)
Conclusions and policy implications
mixed use at space scale within a block or smaller, deducts more residential value due to
degrading residential amenities, than the added value from the improved accessibility. Mixed-use at self-and-surrounding-blocks level, however, benefits residents more than the negative impact it brings on. This research finding suggests that surrounding-block mixed use is superior to in-building mixed-use as well as in-block mixed use in terms of simultaneously seeking neighborhood amenities, and high accessibility to daily-life activities. This suggestion is developed to provide better quality of life, while weighs less on the goal of lower housing price. This suggestion could not only apply to new development area, such as TOD station areas, urban renewal area, and possibly new communities in general.