Using Kernel Discriminant Analysis to Improve
the Characterization of the Alternative Hypothesis
for Speaker Verification
Yi-Hsiang Chao, Wei-Ho Tsai, Member, IEEE, Hsin-Min Wang, Senior Member, IEEE, and Ruei-Chuan Chang
Abstract—Speaker verification can be viewed as a task of
mod-eling and testing two hypotheses: the null hypothesis and the al-ternative hypothesis. Since the alal-ternative hypothesis involves un-known impostors, it is usually hard to characterize a priori. In this paper, we propose improving the characterization of the alterna-tive hypothesis by designing two decision functions based, respec-tively, on a weighted arithmetic combination and a weighted geo-metric combination of discriminative information derived from a set of pretrained background models. The parameters associated with the combinations are then optimized using two kernel dis-criminant analysis techniques, namely, the kernel Fisher discrim-inant (KFD) and support vector machine (SVM). The proposed approaches have two advantages over existing methods. The first is that they embed a trainable mechanism in the decision func-tions. The second is that they convert variable-length utterances into fixed-dimension characteristic vectors, which are easily pro-cessed by kernel discriminant analysis. The results of speaker-ver-ification experiments conducted on two speech corpora show that the proposed methods outperform conventional likelihood ratio-based approaches.
Index Terms—Kernel Fisher Discriminant (KFD), likelihood
ratio, speaker verification, support vector machine (SVM).
I. INTRODUCTION
S
PEAKER verification is usually formulated as a hypoth-esis testing problem and solved using a likelihood ratio (LR)-based decision function [1]. Given an input utterance , the goal is to determine whether or not was spoken by the target (hypothesized) speaker. Let us consider the following hy-potheses:is from the target speaker
is not from the target speaker (1) Manuscript received January 30, 2008; revised June 09, 2008. Current version published October 17, 2008. This work was supported in part by the National Science Council of Taiwan, R.O.C., under Grant NSC94-2213-E-001-009. The associate editor coordinating the review of this manuscript and approving it for publication was Dr. Joseph Campbell.
Y.-H. Chao and R.-C. Chang are with the Institute of Information Science, Academia Sinica, Taipei, Taiwan 115, R.O.C., and also with the Department of Computer Science, National Chiao Tung University, Hsinchu, Taiwan 300, R.O.C. (e-mail: [email protected], [email protected]).
W.-H. Tsai is with the Department of Electronic Engineering, National Taipei University of Technology, Taipei, Taiwan 106, R.O.C. (e-mail: whtsai@ntut. edu.tw).
H.-M. Wang is with the Institute of Information Science, Academia Sinica, Taipei, Taiwan 115, R.O.C. (e-mail: [email protected]).
Color versions of one or more of the figures in this paper are available online at http://ieeexplore.ieee.org.
Digital Object Identifier 10.1109/TASL.2008.2004297
The LR-based decision function can be expressed as accept
accept (reject ) (2)
where , , is the likelihood that hypothesis
gives the utterance , and is a decision threshold. and are called the null hypothesis and the alternative hypothesis, respectively. Although can be modeled straightforwardly using speech utterances from the target speaker, does not in-volve any specific speaker, and thus lacks explicit data for mod-eling. As a result, various approaches have placed special em-phasis on better characterization of . One simple approach involves pooling all the speech data from a large number of background speakers, and training a single speaker-independent model , called the world model or the universal background model (UBM) [1]. During a test, the logarithmic LR measure that an unknown utterance was spoken by the claimed speaker can be evaluated by
(3) where is a target speaker model trained using speech from the claimed speaker. The larger the score of , the more likely it is that was spoken by the claimed speaker.
Instead of using a single model, an alternative approach is to
train a set of models using speech from
sev-eral representative speakers, called a cohort [2], which simu-lates potential impostors. This leads to the following logarithmic LRs, where the alternative hypothesis can be characterized as follows.
1) The likelihood of the most competitive cohort model [3], i.e.,
(4) 2) The arithmetic mean of the likelihoods of the cohort
models [4], i.e.,
(5) 3) The geometric mean of the likelihoods of the cohort
models [3], i.e.,
(6) 1558-7916/$25.00 © 2008 IEEE
In a well-known score normalization method called T-norm [6], is divided by the standard deviation of the log-likeli-hoods of the cohort models.
The LR measures in (3)–(6) can be collectively expressed in the following general form [1]:
(7) where represents a certain function that combines the likelihoods of a set of so-called background models . For example, if the background model set is generated from a cohort, letting be the maximum function
gives , while the arithmetic mean gives , and
the geometric mean gives . When is an identity
function, , and , (7) becomes .
In essence, there is no theoretical evidence to indicate what sort of is optimal, so the selection of is usually ap-plication and training data dependent. Simple functions, such as the arithmetic mean, the maximum, and the geometric mean, are heuristics that do not involve an optimization process. Thus, the resulting system is far from optimal in terms of verifica-tion accuracy. To handle the speaker-verificaverifica-tion problem more effectively, it is necessary to devise a decision function with a trainable mechanism, such that one hypothesis can be optimally separated from another. To this end, we formulate the character-ization of the alternative hypothesis as a problem of optimally combining the discriminative information derived from a set of pretrained background models, and design the decision function based on two perspectives: a weighted geometric combination (WGC) and a weighted arithmetic combination (WAC) of the likelihoods of the background models. In contrast to the
geo-metric mean in and the arithmetic mean in ,
both of which are independent of the system training, our com-bination scheme treats the background models unequally ac-cording to how close each model is to the target model. The unequal nature of the background models is quantified by a set of weights optimized in the training phase. Since the optimiza-tion is related to the verificaoptimiza-tion accuracy, the resulting decision function is expected to be more effective and robust than those of conventional methods. Thus, the task is to determine the as-sociated weights. To obtain a reliable set of weights, we regard the WGC- and WAC-based decision functions as nonlinear dis-criminant classifiers. Then, we apply kernel-based techniques, namely the kernel Fisher discriminant (KFD) [7], [8] and sup-port vector machine (SVM) [9], to solve the weights, by virtue of their good discrimination ability.
In recent years, a number of SVM-based speaker verification techniques have been developed [10]–[14]. One of the main is-sues with using SVMs for speaker verification is that the number of training samples represented by frames is usually too large to handle efficiently. For this reason, the concept of a sequence kernel [10]–[14] was proposed to compare speech utterances at the sequence level instead of the frame level. However, con-structing a proper sequence kernel for utterance-based SVMs is an issue that requires further investigation. In this paper, as the proposed WGC and WAC methods convert variable-length utterances into fixed-dimension characteristic vectors, the de-rived kernel processes play the same role as the sequence kernel
method, but they have the advantage of not having to specifi-cally design the kernel functions.
In addition, most existing SVM-based speaker verification approaches only use a single background model, i.e., the world model, instead of multiple background models, to characterize the alternative hypothesis. For example, Bengio et al. [13] pro-posed the following decision function:
(8) where , , and are adjustable parameters estimated using SVM. The input to SVM comprises the two-dimensional vector . An extended version of (8) using the Fisher kernel and the LR score-space kernel for SVM was investigated in [14]. In contrast, our framework integrates more available information from multiple background models into a characteristic vector as the input to SVM, which makes it easier to distinguish one hypothesis from another. The results of speaker verification experiments conducted on both the XM2VTS database and the ISCSLP2006-SRE database show that the proposed methods outperform all of the above-men-tioned approaches.
The remainder of this paper is organized as follows. Section II introduces the design of the decision function used in our methods. Section III presents the kernel discriminant analysis techniques that we use to find the weight vector. Sections IV and V describe the concepts related to the charac-teristic vector and the background model selection methods, respectively. Section VI details the experiment results. Then, in Section VII, we present our conclusions.
II. PROPOSEDDECISIONFUNCTIONS
To characterize the alternative hypothesis, we generate a set of background models using data that does not belong to the null hypothesis. Instead of the arithmetic mean or the geometric mean mentioned earlier, our goal is to design a function that can optimally exploit the information available from back-ground models. In this section, we present our design approach, which characterizes the alternative hypothesis in two ways: by a weighted geometric combination (WGC) and by a weighted arithmetic combination (WAC). Each combination can be viewed as a generalized and trainable version of conventional approaches.
A. Weighted Geometric Combination (WGC)
We begin by defining the function in (7) in terms of a weighted geometric combination as
(9)
where is the weight of the likelihood ,
. This function assigns different weights to back-ground models according to their individual contribution to the alternative hypothesis. It is clear that (9) is equivalent to the
simple geometric mean when , ; i.e., it is
additional advantage of WGC is that it avoids the problem of . This problem can arise with the simple geometric mean because some values of the likeli-hood may be rather small when the background models are irrelevant to an input utterance , i.e., . However, if a weight is attached to each background model, defined in (9) may be less sensitive to very small likelihood values, and hence should be more robust than the simple geometric mean. It is also clear that (9) will reduce to a maximum function if
, and , .
By substituting (9) into (7), and taking the logarithmic form, we obtain
accept reject accept
reject (10)
where is an weight vector,
the new threshold , and is
an vector in the space expressed as
(11) The implicit idea in (11) is that the input utterance can be represented by a characteristic vector .
B. Weighted Arithmetic Combination (WAC)
We can also define the function in (7) in terms of a weighted arithmetic combination as
(12)
where is the weight of , . Similar
to the weighted geometric combination, (12) considers the in-dividual contribution of background models to the alternative hypothesis by assigning a weight to each likelihood value. It is clear that (12) is equivalent to the arithmetic mean when , . It is also clear that (12) will reduce to a
max-imum function if , and
, . Suppose that all the background models are Gaussian mixture models (GMMs) [4]. Then, (12) constitutes a two-layer GMM, in which one layer represents each background model and the other layer represents the combination of back-ground models.
By substituting (12) into (7) and reversing (7), we obtain
accept reject accept
reject (13)
where is an weight vector,
the new threshold , and is an
1 characteristic vector in the space , expressed by (14)
III. KERNELDISCRIMINANTANALYSIS
The process of representing an utterance as a character-istic vector in (11) or (14) can be regarded as , where 1is a nonlinear mapping function. If we replace the
threshold in (10) or in (13) with a bias , the decision func-tions in (10) and (13) can be rewritten as
(15) where forms a nonlinear discriminant classifier for . The classifier translates the goal of solving an LR test problem into one of optimizing and , such that the utterances of target speakers and nontarget speakers can be separated. To realize this classifier, we need three distinct data sets: one for generating each target speaker’s model, one for generating the background models, and one for optimizing and . Since the bias plays the same role as the decision threshold of the LR test defined in (2), which can be determined through a tradeoff between the false acceptance and the false rejection rates, our main goal here is to find .
To solve the weight vector , we propose using two kernel-based discriminant techniques, namely the KFD [7], [8] and SVM [9], because of their ability to separate samples of target speakers from those of nontarget speakers efficiently.
A. Kernel Fisher Discriminant (KFD)
Suppose that we have training utterances
for hypothesis , , or 1. The goal of KFD is to locate the weight vector that maximizes the between-class scatter, while minimizing the within-class scatter. According to [7], the solution of must lie in the span of all mapped training utter-ances; therefore, we can represent as
(16)
where
, , and is the
combi-nation coefficient. Substituting (16) into (15), we obtain (17)
where the inner product of two vectors and is ex-pressed by a kernel function . Such a kernel function is also called the sequence kernel [10], because it takes two utter-ance sequences, and , as inputs. The goal therefore changes
from finding to finding , which
maximizes
(18) and are computed by
(19) and
(20)
respectively, where is an vector with element
; is an matrix with element
; is an identity matrix; and
is an matrix in which all elements are equal to . Following [8], the solution to , which maximizes defined in (18), is taken as the leading eigenvector of . B. Support Vector Machine (SVM)
The weight vector can also be solved with SVM. In this case, the goal is to find a separating hyperplane that maximizes the margin between the classes. Following [9], can be ex-pressed as
(21)
which yields
(22)
where each training utterance , , is labeled by
either (a null hypothesis) or (an alternative hy-pothesis). The optimal coefficients
can be determined by maximizing the objective function (23)
subject to the constraints and ,
, where is a penalty parameter [9]. This process can be performed with quadratic programming techniques [15]. Note that most elements of are equal to zero, and training samples
associated with nonzero are called support vectors. A few support vectors play a key role in deciding the optimal margin between classes in SVM.
C. Mercer Kernels
The effectiveness of the above KFD or SVM approaches de-pends essentially on how the kernel function is designed. A kernel function must be symmetric, positive definite, and con-form to Mercer’s condition [16]. There are a number of kernel functions [16]. However, since we have converted speech utter-ances into characteristic vectors, the kernel function takes the form
(24) Equation (24) indicates that the sequence kernel function with two input utterances, and , forms a dot product kernel with two input characteristic vectors, and . Alternatively, if we use the closure property of Mercer kernels [16] to form a kernel function
(25) where is a tunable parameter, then is equivalent to the following radial basis function (RBF) kernel with two inputs
and
(26)
IV. CONCEPTSRELATED TO THECHARACTERISTICVECTOR In this section, we compare the proposed classifiers with sev-eral approaches related to the characteristic vector. It is worth noting that the major advantage of our classifiers lies in a train-able mechanism, which tries to optimally exploit useful infor-mation from background models, rather than make an ad hoc modification or use a combination of existing approaches. A. Direct Fusion of Multiple LRs
The most intuitive way to improve the conventional LR-based speaker verification method would be to fuse multiple LR mea-sures directly. Similar to the fusion approaches in [17] and [18], we define a fusion-based LR as
accept
reject (27)
where , and
(28) As with WGC and WAC, the weight vector can be trained using the methods described in Section III. A preliminary result reported in [19] shows that, compared to approaches that use a
single LR, such a fusion scheme improves speaker verification performance noticeably. However, we found that direct fusion is often dominated by one particular LR, or it is limited by some inferior LRs.
B. Relation to the Anchor Modeling Approach
The concept of our methods is similar to that of the anchor modeling approach [20], [21] used in speaker indexing and speaker identification applications. The objective of the anchor modeling approach is to construct a speaker space based on
a set of pretrained representative models ,
called anchor models. Then, any speech utterance can be projected into the space, and represented as a characteristic vector [20]
(29) The speaker of an unknown utterance can be identified by computing the distance between the characteristic vector and the typical vectors of the target speakers. The characteristic vector defined in (29) is similar to the characteristic vector used in this study. However, to find the location of a target speaker in the speaker space, the anchor modeling approach only considers the projection of the speech utterance from the target speaker, which is different from the proposed discriminative framework. More specifically, the decision functions based on WGC and WAC characterize a target speaker by locating the boundary that optimally separates the characteristic vectors of a target speaker from those of nontarget speakers; hence, the proposed methods are expected to be more effective than the anchor modeling approach.
V. BACKGROUNDMODELSELECTION
In general, the more speakers that are used as background models, the better the characterization of the alternative hy-pothesis will be. However, it has been found [2]–[5] that using a set of preselected representative models is usually more effective and efficient than using the entire collection of available speakers. For this reason, we propose selecting background models, including cohort models used in
, , and , and one world model used
in , to form the characteristic vector. As a result, the proposed decision functions based on WGC and WAC can be viewed as generalized and trainable versions of ,
, , or .
We consider two widely used methods for selecting cohort models [4]. One selects the closest speaker
models for each target speaker;
and the other selects the closest speaker models
, plus the farthest speaker
models , for each target speaker.
Here, the degree of closeness is measured in terms of the pairwise distance defined in [4]
(30) where and are speaker models trained using the th speaker’s utterances and the th speaker’s utterances
, respectively. As a result, each target speaker has a
se-quence of background models, or
, for (11) and (14). VI. EXPERIMENTS
We conducted the speaker-verification experiments on two databases: the XM2VTS database [22] and the ISCSLP2006 speaker recognition evaluation (ISCSLP2006-SRE) database [24].
For the performance evaluation, we used the detection error tradeoff (DET) curve [26], which shows the tradeoff between the false-alarm probability and the miss probability based on their corresponding Gaussian deviates. We also measured the NIST detection cost function (DCF) [27], which reflects the per-formance at a single operating point on the DET curve. The DCF is defined as
(31) where and are the miss probability and the false-alarm probability, respectively; and are the respec-tive relarespec-tive costs of the detection errors; and is the a priori probability of the target speaker.
A. Evaluation on the XM2VTS Database
The first set of speaker verification experiments was con-ducted on speech data extracted from the XM2VTS multimodal database [22]. In accordance with “Configuration II” described in [23], the database was divided into three subsets: “Training,” “Evaluation,”2 and “Test.” For our experiments, we used the
“Training” subset to build each target speaker’s model and the background models, and the “Evaluation” subset to estimate the decision threshold in (2), and the parameters and in (15). The accuracy of speaker verification was then evalu-ated on the “Test” subset. As shown in Table I, a total of 293 speakers3in the database were divided into 199 clients (target
speakers), 25 “evaluation impostors,” and 69 “test impostors.” Each speaker participated in four recording sessions at approx-imately one-month intervals, and each recording session con-sisted of two shots. In each shot, the speaker was prompted to utter three sentences:
1) “0 1 2 3 4 5 6 7 8 9.” 2) “5 0 6 9 2 8 1 3 7 4.”
3) “Joe took father’s green shoe bench out.”
Using a 32-ms Hamming-windowed frame with 10-ms shifts, each utterance was converted into a stream of 24-order feature vectors, each consisting of 12 Mel-scale frequency cepstral co-efficients [28] and their first time derivatives.
We used 12 (2 2 3) utterances per target speaker from ses-sions 1 and 2 to train the target speaker model, represented by a GMM with 64 mixture components. For each target speaker, we used the utterances of the other 198 clients in sessions 1 and
2This is usually called the “Development” set in the speech recognition
community. We use “Evaluation” in accordance with the configuration of the XM2VTS database.
3We omitted two speakers (ID numbers 313 and 342) because of partial data
TABLE I
CONFIGURATION OF THEXM2VTS SPEECHDATABASE
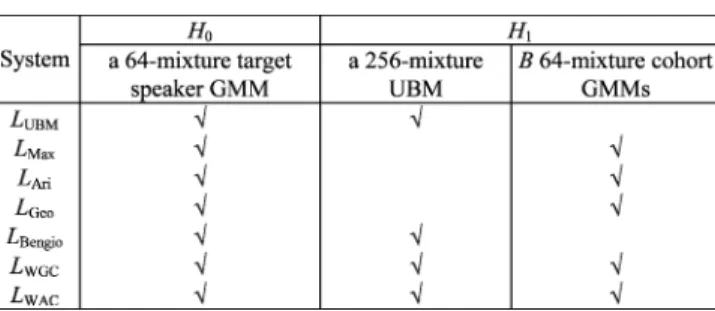
TABLE II
SUMMARY OF THEPARAMETRICMODELSUSED INEACHSYSTEM
2 to generate the world model (UBM), represented by a GMM with 256 mixture components. We then chose speakers from those 198 clients as the cohort. In the experiments, was set to 20, and each cohort model was also represented by a GMM with 64 mixture components. Table II summarizes all the parametric models used in each system. To estimate , , and , we used six utterances per target speaker from session 3, along with 24 (4 2 3) utterances per evaluation-impostor over the four ses-sions, which yielded 1194 (6 199) target speaker samples and 119 400 (24 25 199) impostor samples. However, because a kernel-based technique can be intractable when a large number of training samples are involved, we reduced the number of im-postor samples from 119 400 to 2250 using a uniform random selection method. In the performance evaluation, we tested six utterances per target speaker from session 4 and 24 utterances per test-impostor over the four sessions, which produced 1 194 (6 199) target speaker trials and 329 544 (24 69 199) im-postor trials.
1) Weighted Geometric Combination Versus Geometric Mean: The first experiment evaluated the proposed weighted geometric combination of background models, i.e.,
defined in (10). The set of background models was comprised of 1) the world model and the 20 closest cohort models (“w_20c”), or 2) the world model and the ten closest cohort models, plus the ten farthest cohort models (“w_10c_10f”). The weight vector was optimized by kernel-based discrimination solutions (KFD or SVM). We derived the following eight WGC-based systems:
1) KFD with defined in (24) and “w_20c”
(“WGC_dot_KFD_w_20c”);
2) KFD with defined in (24) and “w_10c_10f”
(“WGC_dot_KFD_w_10c_10f”);
3) SVM with defined in (24) and “w_20c”
(“WGC_dot_SVM_w_20c”);
4) SVM with defined in (24) and “w_10c_10f”
(“WGC_dot_SVM_w_10c_10f”);
5) KFD with defined in (26) and “w_20c”
(“WGC_RBF_KFD_w_20c”);
6) KFD with defined in (26) and “w_10c_10f”
(“WGC_RBF_KFD_w_10c_10f”);
7) SVM with defined in (26) and “w_20c”
(“WGC_RBF_SVM_w_20c”);
8) SVM with defined in (26) and “w_10c_10f”
(“WGC_RBF_SVM_w_10c_10f”).
Both SVM and KFD used an RBF kernel function with . We used the SSVM tool [29] to implement the SVM experiments, where the parameter of SVM was set to 1. For the performance comparison, we used three systems as our base-lines:
1) (“GMM-UBM”);
2) with the 20 closest cohort models (“Geo_20c”); 3) with the ten closest cohort models plus the ten
farthest cohort models (“Geo_10c_10f”).
Fig. 1 shows the speaker verification results of the above sys-tems evaluated on the XM2VTS “Test” subset in terms of DET curves. Fig. 1(a) and (b) compare the DET curves derived by KFD-based systems and SVM-based systems, respectively.
From Fig. 1, we observe that all the WGC-based systems with kernel functions or outperform the baseline systems “GMM-UBM,” “Geo_20c,” and “Geo_10c_10f.” We also ob-serve that “Geo_10c_10f” in Fig. 1(a) yields the poorest perfor-mance. This is because the simple geometric mean may pro-duce some singular scores if any cohort model is poorly
matched to the input utterance , i.e., . In
con-trast, the results show that the WGC-based system sidesteps this problem with the aid of the weighted strategy. In addition, both Fig. 1(a) and (b) show that the WGC-based systems with outperform the WGC-based systems with . Thus, in the subsequent experiments, we focused on investigating the per-formance achieved by the kernel-based discrimination solutions using the kernel function .
2) Weighted Arithmetic Combination Versus Arithmetic Mean: The second experiment evaluated the proposed weighted arithmetic combination of background models, i.e.,
defined in (13). We implemented the WAC-based systems using the kernel-based discrimination solution in four ways:
1) KFD with “w_20c” (“WAC_RBF_KFD_w_20c”); 2) KFD with “w_10c_10f” (“WAC_RBF_KFD_w_10c_10f”); 3) SVM with “w_20c” (“WAC_RBF_SVM_w_20c”); 4) SVM with “w_10c_10f” (“WAC_RBF_SVM_w_10c_10f”). In the above cases, SVM and KFD used an RBF kernel function
with . For the performance comparison, we used three systems as our baselines:
1) (“GMM-UBM”);
2) with the 20 closest cohort models (“Ari_20c”); 3) with the ten closest cohort models plus the ten
farthest cohort models (“Ari_10c_10f”).
Fig. 2 shows the results of the above systems evaluated on the XM2VTS “Test” subset in terms of DET curves. Clearly, all the WAC-based systems based on either KFD or SVM out-perform the baseline systems “GMM-UBM,” “Ari_20c,” and
Fig. 1. Geometric mean versus WGC: DET curves for the “Test” subset in the XM2VTS database.
“Ari_10c_10f.” We also observe that the performances of SVM and KFD are similar.
3) Discussion: An analysis of the experiment results based
on the DCF with , , and is
given in Table III. In addition to the above systems, we evaluated four related systems:
1) with the 20 closest cohort models (“Max_20c”);
2) using an RBF kernel function with
(“GMM-UBM/SVM”);
Fig. 2. Arithmetic Mean versus WAC: DET curves for the “Test” subset in the XM2VTS database.
TABLE III
DCFS FOR THE“EVALUATION”AND“TEST” SUBSETS IN THEXM2VTS DATABASE
3) with a fusion of five baseline LR
mea-sures, namely, “GMM-UBM,” “Max_20c,” “Ari_20c,” “Ari_10c_10f,” and “Geo_20c,” by KFD (“Fusion_KFD”);
4) with a fusion of five baseline LR
mea-sures, namely, “GMM-UBM,” “Max_20c,” “Ari_20c,”
“Ari_10c_10f,” and “Geo_20c,” by SVM
(“Fu-sion_SVM”).
In the fusion systems, KFD and SVM used an RBF kernel function with . We did not include “Geo_10c_10f” in the implementation of the fusion systems because of its poor perfor-mance. For each approach, the decision threshold was carefully
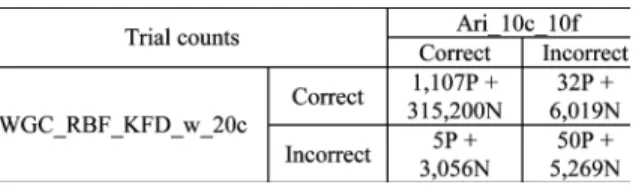
TABLE IV
COMPARISON OFERRORSMADE BY“WGC_RBF_KFD_W_20C”AND
“ARI_10C_10F,” WHEREPANDN DENOTE THENUMBER OFPOSITIVE
(TARGETSPEAKER) TRIALS AND THENUMBER OFNEGATIVE(IMPOSTOR) TRIALS, RESPECTIVELY. THEREARE1,194PAND329 544NINTOTAL
tuned to minimize the DCF using the “Evaluation” subset, and then applied to the “Test” subset.
Several conclusions can be drawn from Table III. First, the two direct fusion systems, “Fusion_KFD” and “Fusion_SVM,” as well as “GMM-UBM/SVM,” outperform the baseline LR systems. Second, the proposed WGC- and WAC-based systems not only outperform all the baseline LR systems, “GMM-UBM,” “Max_20c,” “Ari_20c,” “Ari_10c_10f,” and “Geo_20c,” they are also better than the fusion systems and the “GMM-UBM/SVM” system. The WGC- and WAC-based SVM systems are better than the “GMM-UBM/SVM” system because they consider multiple background models (including the world model), whereas the “GMM-UBM/SVM” system only con-siders the world model. Third, the WGC-based systems slightly outperform the WAC-based systems. Fourth, both KFD and SVM perform well in terms of finding nonlinear discrimination solutions. From the actual DCF for the “Test” subset, we observe that “WGC_RBF_KFD_w_20c” achieved a 30.68% relative improvement compared to “Ari_10c_10f” – the best baseline LR system. Table IV compares the correlation of correct and incorrect decisions between “WGC_RBF_KFD_w_20c” and “Ari_10c_10f” for the actual DCF [27]. Based on McNemar’s
test [30] with a significance , we can conclude
that “WGC_RBF_KFD_w_20c” performs significantly better
than “Ari_10c_10f,” since the resulting .
B. Evaluation on the ISCSLP2006-SRE Database
We also evaluated the proposed methods on a text-in-dependent single-channel speaker verification task con-forming to the ISCSLP2006 Speaker Recognition Evaluation (ISCSLP2006-SRE) Plan [25]. Unlike the XM2VTS task, the ISCSLP2006-SRE database was divided into two subsets: a “Development Data Set” and an “Evaluation Data Set.” The “Development Data Set” contained 300 speakers. Each speaker made two utterances, each of which was cut into one long segment, which was longer than 30 s, and several short segments. In the experiments, we collected each speaker’s two long segments to build a UBM with 1024 mixture Gaussian components, and used the two long segments per speaker to train each speaker’s 1024-mixture GMM through UBM-MAP adaptation [1]. For each speaker, speakers’ GMMs were chosen from the other 299 speakers as the cohort models. The remaining short segments of all the speakers were used to estimate , , and . In the implementation, each short segment served as a positive sample for its associated speaker, but acted as a negative sample for each of the 20 randomly selected speakers from the remaining 299 speakers. This yielded 1551
positive samples and 31 020 (1551 20) negative samples for estimating or . Moreover, we used 1551 positive samples and 1551 randomly selected negative samples to estimate in the proposed systems.
The “Evaluation Data Set” contained 800 target speakers that did not overlap with the speakers in the “Development Data Set.” Each target speaker made one long training utterance, ranging in duration from 21 to 85 s, with an average length of 37.06 s. This was used to generate the speaker’s 1024-mixture GMM through UBM-MAP adaptation. For each target speaker, speakers’ GMMs were chosen from the 300 speakers in the “Development Data Set” as the cohort models. In addition, there were 5933 test utterances (trials) in the “Evaluation Data Set,” each of which ranged in duration from 5 seconds to 54 s, with an average length of 15.66 s. Each test utterance was associated with the claimed speaker’s ID, and the task involved judging whether it was true or false. The answer sheet was released after the evaluation finished.
The acoustic feature extraction process was same as that ap-plied in the XM2VTS task.
1) Experiment Results: The GMM-UBM [1] and T-norm [6] systems are the current state-of-the-art approaches for the text-independent speaker verification task. Thus, in this part, we focus on the performance improvement of our methods over these two baseline systems. As with the GMM-UBM system, we used the fast scoring method [1] for likelihood ratio compu-tation in the proposed methods. Both the target speaker model and the cohort models were adapted from the UBM . Be-cause the mixture indices were retained after UBM-MAP adap-tation, each element of the characteristic vector was computed approximately by only considering the mixture components corresponding to the top scoring mixtures in the UBM [1]. In our experiments, was set to 5, and was set to 20.
The experiment results of the XM2VTS task showed that there was no significant performance difference between the two cohort selection methods used to construct the character-istic vector . Thus, in the following experiments, we only used one type of characteristic vector, i.e., the vector associated with the UBM and the 20 closest cohort models (“w_20c”), to com-pute WGC- and WAC-based decision functions. This yielded the following four systems:
1) using SVM with and “w_20c”
(“WGC_RBF_SVM_w_20c”);
2) using KFD with and “w_20c”
(“WGC_RBF_KFD_w_20c”);
3) using SVM with and “w_20c”
(“WAC_RBF_SVM_w_20c”);
4) using KFD with and “w_20c”
(“WAC_RBF_KFD_w_20c”).
We compared the proposed systems with the GMM-UBM system, the T-norm system with the 50 closest cohort models (“Tnorm_50c”), and Bengio et al.’s system (“GMM-UBM/ SVM”). The kernel parameters for SVM and KFD were same as those used in the XM2VTS task. Following the ISCSLP2006-SRE Plan, the performance was measured by the
DCF with , , and . In each
system, the decision threshold was tuned to minimize the DCF using the (1551 31 020) samples in the “Development Data
Fig. 3. Baseline systems versus WAC and WGC: DET curves for the ISCSLP2006-SRE “Evaluation Data Set.” The stars and circles indicate the actual and minimum DCFs, respectively.
TABLE V
MINIMUMDCFS ANDACTUALDCFS FOR THEISCSLP2006-SRE “EVALUATIONDATASET”
Set,” and then applied to the “Evaluation Data Set.” Table V summarizes the minimum DCFs and the actual DCFs derived from 5933 trials in the “Evaluation Data Set,” and Fig. 3 shows the experiment results for all systems in terms of DET curves. It is clear that all the proposed systems outperform “GMM-UBM,” “Tnorm_50c,” and “GMM-UBM/SVM.” The actual DCFs in Table V show that “WGC_RBF_KFD_w_20c” achieved a 52.72% relative improvement over “Tnorm_50c.” Table VI compares the correlation of correct and
incor-rect decisions between “WGC_RBF_KFD_w_20c” and
“Tnorm_50c” for the actual DCF. Based on McNemar’s test
with a significance level , we can conclude that
“WGC_RBF_KFD_w_20c” performs significantly better than
“Tnorm_50c,” since the resulting value .
VII. CONCLUSION
We have presented two novel WGC- and WAC-based deci-sion functions for solving the speaker-verification problem. The functions improve the characterization of the alternative hypoth-esis by combining the likelihoods of all the background models based on two perspectives: a weighted geometric combination
TABLE VI
COMPARISON OFERRORSMADE BY“WGC_RBF_KFD_W_20C”AND“ TNORM_50C”, WHEREPANDN DENOTE THENUMBER OFPOSITIVE(TARGET
SPEAKER) TRIALS AND THENUMBER OFNEGATIVE(IMPOSTOR) TRIALS, RESPECTIVELY. THEREARE347PAND5,586NINTOTAL
and a weighted arithmetic combination. These combinations are more effective and robust than the simple geometric mean and arithmetic mean used in conventional approaches. The new de-cision functions are treated as nonlinear discriminant classifiers that can be solved by using kernel-based techniques, such as the Kernel Fisher Discriminant and Support Vector Machine, to optimally separate samples of the null hypothesis from those of the alternative hypothesis. The results of experiments on two speaker verification tasks show notable improvements in perfor-mance over classical approaches. Finally, it is worth noting that the proposed methods can be applied to other types of data and hypothesis testing problems.
ACKNOWLEDGMENT
The authors would like to thank the anonymous reviewers and the associate editor, Dr. Joseph Campbell, for their careful reading of this paper and the constructive suggestions.
REFERENCES
[1] D. A. Reynolds, T. F. Quatieri, and R. B. Dunn, “Speaker verification using adapted Gaussian mixture models,” Digital Signal Process., vol. 10, no. 1, pp. 19–41, 2000.
[2] A. E. Rosenberg, J. DeLong, C. H. Lee, B. H. Juang, and F. K. Soong, “The use of cohort normalized scores for speaker verification,” in Proc.
ICSLP, Banff, AB, Canada, 1992, pp. 599–602.
[3] C. S. Liu, H. C. Wang, and C. H. Lee, “Speaker verification using nor-malized log-likelihood score,” IEEE Trans. Speech Audio Process., vol. 4, no. 1, pp. 56–60, Jan. 1996.
[4] D. A. Reynolds, “Speaker identification and verification using Gaussian mixture speaker models,” Speech Commun., vol. 17, pp. 91–108, 1995.
[5] A. Higgins, L. Bahler, and J. Porter, “Speaker verification using ran-domized phrase prompting,” Digital Signal Process., vol. 1, no. 2, pp. 89–106, 1991.
[6] R. Auckenthaler, M. Carey, and H. Lloyd-Thomas, “Score normaliza-tion for text-independent speaker verificanormaliza-tion system,” Digital Signal
Process., vol. 10, no. 1, pp. 42–54, 2000.
[7] S. Mika, G. Rätsch, J. Weston, B. Schölkopf, and K. R. Müller, “Fisher discriminant analysis with kernels,” in Proc. Neural Netw. r Signal
Process. IX, Madison, WI, 1999, pp. 41–48.
[8] S. Mika, “Kernel Fisher discriminants,” Ph.D. dissertation, University of Technol., Berlin, Germany, 2002.
[9] C. Burges, “A tutorial on support vector machines for pattern recog-nition,” in Data Mining and Knowledge Discovery. New York: Springer, 1998, vol. 2, pp. 121–167.
[10] W. M. Campbell, J. P. Campbell, D. A. Reynolds, E. Singer, and P. A. Torres-Carrasquillo, “Support vector machines for speaker and language recognition,” Comput. Speech Lang., vol. 20, no. 2–3, pp. 210–229, 2006.
[11] W. M. Campbell, J. P. Campbell, T. P. Gleason, D. A. Reynolds, and W. Shen, “Speaker verification using support vector machines and high-level features,” IEEE Trans. Audio, Speech, Lang. Process., vol. 15, no. 7, pp. 2085–2094, Sep. 2007.
[12] W. M. Campbell, D. E. Sturim, and D. A. Reynolds, “Support vector machine using GMM supervectors for speaker verification,” IEEE
Signal Process. Lett., vol. 13, no. 5, pp. 308–311, May 2006.
[13] S. Bengio and J. Mariéthoz, “Learning the decision function for speaker verification,” in Proc. ICASSP, Salt Lake City, UT, 2001, pp. 425–428.
[14] V. Wan and S. Renals, “Speaker verification using sequence discrim-inant support vector machines,” IEEE Trans. Speech Audio Process., vol. 13, no. 2, pp. 203–210, Mar. 2005.
[15] V. Vapnik, Statistical Learning Theory. New York: Wiley, 1998. [16] R. Herbrich, Learning Kernel Classifiers: Theory and Algorithms.
Cambridge, MA: MIT Press, 2002.
[17] S. Ben-Yacoub, “Multi-modal data fusion for person authentication using SVM,” in Proc. AVBPA, Washington, DC, 1999, pp. 25–30. [18] H. T. Cheng, Y. H. Chao, S. L. Yen, C. S. Chen, H. M. Wang, and Y. P.
Hung, “An efficient approach to multi-modal person identity verifica-tion by fusing face and voice informaverifica-tion,” in Proc. ICME, Amsterdam, The Netherlands, Jul. 2005, pp. 542–545.
[19] Y. H. Chao, W. H. Tsai, H. M. Wang, and R. C. Chang, “A kernel-based discrimination framework for solving hypothesis testing problems with application to speaker verification,” in Proc. ICPR., Hong Kong, China, 2006, pp. 229–232.
[20] D. E. Sturim, D. A. Reynolds, E. Singer, and J. P. Campbell, “Speaker indexing in large audio databases using anchor models,” in Proc.
ICASSP, Salt Lake City, UT, 2001, vol. 1, pp. 429–432.
[21] Y. M. Charlet, “Speaker recognition by location in the space of refer-ence speakers,” Speech Commun., vol. 48, pp. 127–141, 2006. [22] K. Messer, J. Matas, J. Kittler, and J. L. Maitre, “XM2VTSDB: The
extended M2VTS database,” in Proc. AVBPA, Washington, D.C., 1999. [23] J. Luettin and G. Maitre, “Evaluation protocol for the extended M2VTS
database (XM2VTSDB),” IDIAP-COM 98-05, IDIAP, 1998. [24] T. F. Zheng, Z. Song, L. Zhang, M. Brasser, W. Wu, and J. Deng, “CCC
speaker recognition evaluation 2006: Overview, methods, data, results, and perspective,” in Proc. ISCSLP, Kent Ridge, Singapore, Dec. 2006, pp. 485–493.
[25] “Evaluation plan for ISCSLP’2006 special session on speaker recogni-tion,” Chinese Corpus Consortium (CCC), 2006.
[26] A. Martin, G. Doddington, T. Kamm, M. Ordowski, and M. Przybocki, “The DET curve in assessment of detection task performance,” in Proc.
Eurospeech, Rhodes, Greece, 1997, pp. 1895–1898.
[27] D. A. v. Leeuwen, A. F. Martin, M. A. Przybocki, and J. S. Bouten, “NIST and NFI-TNO evaluations of automatic speaker recognition,”
Comput. Speech Lang., vol. 20, pp. 128–158, 2006.
[28] X. Huang, A. Acero, and H. W. Hon, Spoken Language Processing. Upper Saddle River, New Jersey: Prentice-Hall, 2001.
[29] Y. J. Lee and O. L. Mangasarian, “SSVM: Smooth support vector ma-chine for classification,” Computat. Optimization Applicat., vol. 20, no. 1, pp. 5–22, 2001.
[30] L. Gillick and S. J. Cox, “Some statistical issues in the comparison of speech recognition algorithms,” in Proc. ICASSP, Glasgow, U.K., 1989, pp. 532–535.
Yi-Hsiang Chao received the B.S. degree in information management from Tatung University, Taipei, Taiwan, R.O.C., in 1999 and the M.S. degree in com-puter science from National Chiao Tung University, Hsinchu, Taiwan, in 2001.
He is currently pursuing the Ph.D. degree in the Department of Computer Sci-ence, National Chiao Tung University.
In 2001, he joined the Spoken Language Group, Chinese Information Pro-cessing Laboratory, Institute of Information Science, Academia Sinica, Taipei, Taiwan, as a Research Assistant. His research interests include pattern recogni-tion, speech processing, and neural networks.
Wei-Ho Tsai (M’04) received the B.S. degree in electrical engineering from National Sun Yat-Sen University, Kaohsiung, Taiwan, R.O.C., in 1995 and the M.S. and Ph.D. degrees in communication engineering from National Chiao Tung University, Hsinchu, Taiwan, in 1997 and 2001, respectively.
From 2001 to 2003, he was with Philips Research East Asia, Taipei, Taiwan, where he worked on speech processing problems in embedded systems. From 2003 to 2005, he served as Postdoctoral Fellow at the Institute of Informa-tion Science, Academia Sinica, Taipei, Taiwan. He is currently an Assistant Professor at the Department of Electronic Engineering and Graduate Institute of Computer and Communication Engineering, National Taipei University of Technology, Taiwan. His research interests include spoken language processing and music information retrieval.
Hsin-Min Wang (S’92–M’95–SM’05) received the B.S. and Ph.D. degrees in electrical engineering from National Taiwan University, Taipei, Taiwan, R.O.C., in 1989 and 1995, respectively.
In October 1995, he joined the Institute of Information Science, Academia Sinica, Taipei, Taiwan, as a Postdoctoral Fellow. He was promoted to Assistant Research Fellow and then Associate Research Fellow in 1996 and 2002, respec-tively. He was an Adjunct Associate Professor with National Taipei University of Technology and National Chengchi University. He was a board member and chair of academic council of ACLCLP. He currently serves as Secretary-General of ACLCLP and as an editorial board member of International Journal of Com-putational Linguistics and Chinese Language Processing. His major research interests include speech processing, natural language processing, spoken dia-logue processing, multimedia information retrieval, and pattern recognition.
Dr. Wang was a recipient of the Chinese Institute of Engineers (CIE) Tech-nical Paper Award in 1995. He is a life member of ACLCLP and IICM and a member of ISCA.
Ruei-Chuan Chang received the B.S., M.S., and Ph.D. degrees in computer sci-ence from National Chiao Tung University, Hsinchu, Taiwan, R.O.C., in 1979, 1981, and 1984, respectively.
In August 1983, he joined the Department of Computer and Information Sci-ence at National Chiao Tung University as a Lecturer. Now he is a Professor of the Department of Computer and Information Science. He is also an Asso-ciate Research Fellow at the Institute of Information Science, Academia Sinica, Taipei, Taiwan.