國 立 交 通 大 學
機械工程學系
碩士論文
低熱值燃料於微型渦輪引擎之實驗分析
The Experimental Analyses of a Micro Gas Turbine
by Using Low Heating Value Fuels
研究生 :蕭仁浩
指導教授 :陳俊勳 教授
中 華 民 國 九 十 七 年 六 月
低熱值燃料於微型渦輪引擎之實驗分析
The Experimental Analyses of a Micro Gas Turbine
by Using Low Heating Value Fuels
研究生 :蕭仁浩 Student : Ren-Hao Hsiao
指導教授:陳俊勳 Advisor : Chiun-Hsun Chen
國 立 交 通 大 學 機 械 工 程 學 系
碩 士 論 文 A Thesis
Submitted to Department of Mechanical Engineering College of Engineering
National Chiao Tung University In Partial Fulfillment of the Requirements
For the Degree of Master of Science
In
Mechanical Engineering July 2007
Hsinchu, Taiwan, Republic of China
中 華 民 國 九 十 七 年 六 月
低熱值燃料於微型渦輪引擎之實驗分析
學生:蕭仁浩 指導教授:陳俊勳
國立交通大學機械工程學系
摘要
利用已開發完成的燃油氣微型渦輪引擎作為載具,渦輪
轉子直徑大小為 4 公分,將此以燃油為燃料的系統重新改裝
成為適合低熱值生質能氣體燃料之微渦輪引擎燃燒系統
(MGT)並解決潤滑管路及啟動之問題,並使用不同濃度之
甲烷燃料模擬低熱值燃料,並擷取燃料壓力、質量流量、引
擎轉速等及 MGT 系統重要溫度,經過數據分析後,再根據
此燃燒動力系統之性能來進行後段發電系統的設計與建立,
從實驗數據得出使用 60%甲烷混合 40%二氧化碳之低熱值燃
料在可達最高轉速 47,500 RPM 下無法有效發電,在使用 90%
甲烷混合 10%二氧化碳在渦輪引擎轉速 85,000 RPM 下可得
170 W 之發電量,最後依照實驗數據建立完成一低熱值生質
能汽電共生系統的建立與實場示範操作,並使其系統穩定好
操作以便利用,作為未來分散發電的選擇之一。
The Experimental Analyses of a Micro Gas Turbine
by Using Low Heating Value Fuels
Student: Ren-Hao Hsiao Advisor: Prof.Chiun-Hsun Chen
Institute of Mechanical Engineering National Chiao Tung University
ABSTRACT
Based on the low-heating-value fuel obtained from the bio-process
from marsh gas by removing H2S, it develops a micro gas turbine (MGT)
with turbine wheel diameter 40mm by modifying the system from a liquid-fuel burning gas turbine system into a gas burning one to generate the combustion power, which is used to drive a generator to produce the electricity. It is a co-generation process, which can be one of the potential candidates for the distributed power supply systems. In the experiment, the pressure and the volume flow rate of fuel, rotational speed of turbine and the temperatures of important parts of MGT have acquired. According to the data, the better generator can be chosen, and
the output by using 90% CH4 with 10% CO2 reaches about 170W at
85,000 rpm. When low-heating-value fuel of 60% CH4 was applied, the
power output was extremely low. Also, this research would be compared to gasoline to ensure its practical utilization. Finally, the MGT system also intends to evaluate the possibilities of the system integration with other renewable energy resources, such as the wind and solar powers.
致謝
在交大兩年碩士生活中,首先要感謝陳俊勳老師,才能完成本篇 論文及順利的完成研究所學業,老師耐心的諄諄教誨,總是可以不厭 其煩的細心指導,並在研究上給予許多指導與建議,也讓我學習到為 學該有的態度及凡事認真踏實的精神,在此對老師致上最高的敬意。 此外也感謝盧定昶教授、何無忌博士與吳國光博士在百忙之中還細心 的對本篇論文做出許多精闢的看法,在此一併致上萬分感謝。 研究生活中有實驗室成員們的互相幫忙,才能如此順利,特別感 謝俊翔學長在實驗及論文上的指導與建議,以及文耀、振忠、遠達、 彥成、榮貴、瑭原、耀文、家維等學長們的熱心幫忙,還有宏一、昇 宏、彥佐、靖山等同期戰友們,有了你們的勉勵與支持讓我更充滿活 力面對挑戰,另外,致瑋、振稼、金輝、智欽、育祈、長新等學弟們 的陪伴,讓我的研究生活更充滿樂趣與回憶。 最後,由衷感謝的是我的父母親,在忙碌的學業中提供舒適便利 的生活環境讓我無後顧之憂的專心求學,在遭遇困難時給我精神上最 大的鼓勵,讓我總是可以克服問題突破難關,最後順利完成學業。CONTENTS
ABSTRACT (Chinese)………...I ABSTRACT (English)………...II CONTENTS……….III LIST OF TABLES……….V LIST OF FIRGURES………...…VI NOMENCLATURE……….…..IX CHAPTER 1 INTRODUCTION………1 1.1 Motivation ………..1 1.2 Literature Review………...41.3 Scope of Present Study………...9
CHAPTER 2 EXPERIMENTAL APPARATUS………..11
2.1 Experiment Layout ………..11
2.2 Parameters of Tests ………..12
2.3 The micro gas turbine system………...12
2.3.1 Micro gas turbine………...12
2.3.2 Transmission………....13 2.3.3 Fuel supply………..…13 2.3.4 Start system……….14 2.3.5 Generator……….14 2.3.6 Lubrication………..14 2.4 Measurement Instrumentations……….15 2.4.1 Temperature measurement ………..15 2.4.2 Turbine rpm measurement………...15
2.4.5 Generator output Measurement………...16
2.4.6 Data Acquisition………..16
CHAPTER 3 Experimental Procedures and Uncertainty Analysis…..…18
3.1 Safety Notes………...18
3.2 Beginning………...18
3.3 End………...………...20
3.4 Uncertainty Analysis………20
3.4.1 Analyses of the propagation of Uncertainty …………...21
3.4.2 The Asymmetric Uncertainties of Thermocouple ……..22
3.4.3 The Experimental Repeatability………..23
CHAPTER 4 RESULTS AND DISCUSSION……….25
4.1 The tests with different fuels with no load………...27
4.1.1 The pressures and volume flow rate of fuel at MGT with no load...………..27
4.1.2 The temperature of MGT without load………30
4.1.3 Thermal efficiency………...31
4.2 The MGT tests with generator………..34
4.2.1 The pressures, volume flow rate of fuel, and temperatures at MGT with generator….……….34
4.2.2 The choice of the generator system….………35
4.2.3 Output of electric power………..35
CHAPTER 5 CONCLUSIONS AND FUTURE WORKS………...37
5.1Conclusions………...37
5.2 Future Works………....38
TABLES
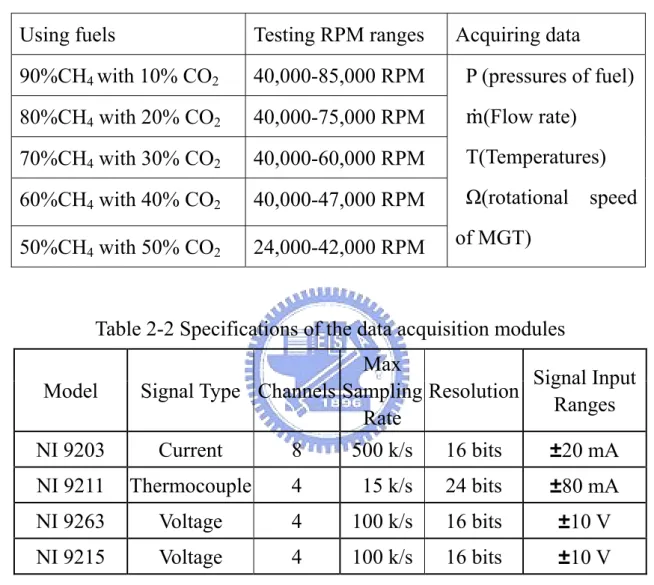
Table 2-1 Parameters of tests ... 43
Table 2-2 Specifications of the data acquisition modules ... 43
Table 2-3 Fuel properties (0℃, 1atm) ... 43
Table 2-4 Different concentration percentage of mixed fuel ... 44
Table 2-5 Specification of the MGT ... 44
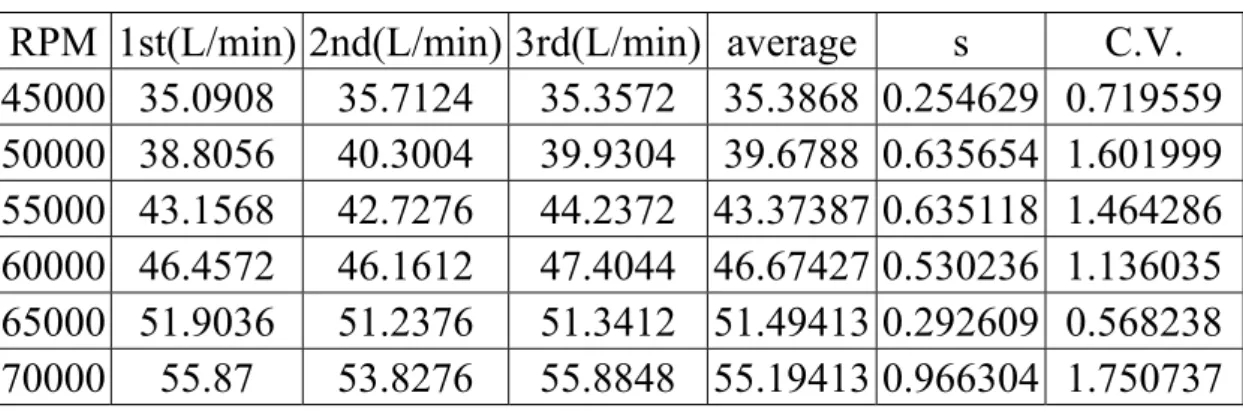
Table 3-1 Experimental repeatability for 60% CH4 of volume flow rate ... 44
Table 3-2 Experimental repeatability for 70% CH4 of volume flow rate ... 44
Table 3-3 Experimental repeatability for 80% CH4 of volume flow rate ... 45
Table 3-4 Experimental repeatability for 90% CH4 of volume flow rate ... 45
Table 4-1 Test Conditions without load ... 45
Table 4-2 Cylinder pressure and fuel volume flow rate ... 46
Table 4-3 The pressure and volume flow rate of the fuel to reach idle speed ... 46
Table 4-4 Test conditions with generator ... 47
Table 5-1 The volume flow rate of the fuel to reach idle speed ... 47
Table 5-2 The pressure of the fuel to reach idle speed... 47
FIGURES
Fig. 1-1 The structure of project ... 49
Fig. 1-2 The basic structure of the MGT generator ... 49
Fig. 2-1 Experiment layout ... 50
Fig. 2-2a Experiment Layout ... 50
Fig. 2-2b Experiment Layout ... 50
Fig. 2-3a The picture of WREN MW54 Turbine engine ... 51
Fig. 2-3b MGT schematic dimension ... 51
Fig. 2-4 The picture of diffuser ... 52
Fig. 2-5 The picture of turbine ... 52
Fig. 2-6 the picture of compressor ... 53
Fig. 2-7 the picture of combustion chamber and fuel pipes ... 53
Fig. 2-8a The picture of turbine engine with transmission ... 54
Fig. 2-8b The schematic dimension of turbine engine with transmission ... 54
Fig. 2-9 Alternator and regulator ... 55
Fig. 2-10 Methane battle & pressure valve & flow meter ... 55
Fig. 2-11 Three way switch and one way valve ... 56
Fig. 2-12 The blower ... 56
Fig. 2-13 Lubricant pipe ... 57
Fig. 2-14 The picture of thermal couple (K-type) ... 57
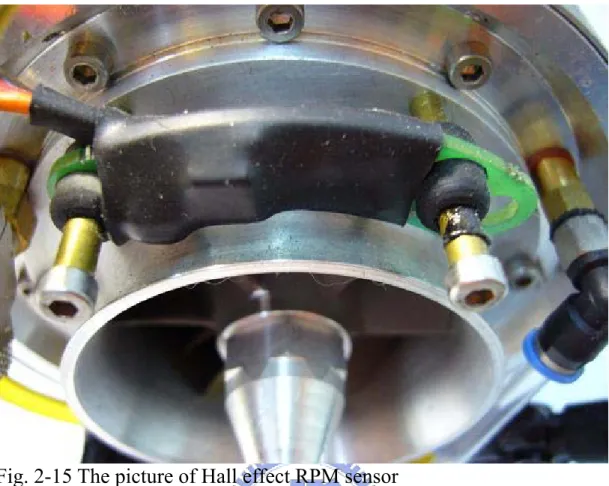
Fig. 2-15 The picture of Hall effect RPM sensor ... 58
Fig. 2-16 The pressure meter... 58
Fig. 2-17 mass flow meter ... 59
Fig. 2-18b Analog Input Module ... 60
Fig. 2-18c Analog Output Module ... 60
Fig. 2-18d Thermocouple Differential Analog Input Module ... 61
Fig. 2-18e Simultaneous Analog Input Module ... 61
Fig. 3-1 The relationship of temperature and error ... 62
Fig. 4-1a The pressure of Low-heating-value fuel at different rpms .... 67
Fig. 4-1b The pressure of Low-heating-value fuel at 50% CH4 ... 67
Fig. 4-2a Volume flow rate of Low-heating-value fuel at different RPMs ... 68
Fig. 4-2b Volume flow rate at 50% CH4 ... 68
Fig. 4-3a Volume flow rate of CH4 in different fuels ... 69
Fig. 4-4a 50% CH4 rpm without load ... 70
Fig. 4-4b 50% CH4 temperatures without load ... 70
Fig. 4-5a 60% CH4 rpm without load ... 71
Fig. 4-5b 60% CH4 temperatures without load ... 71
Fig. 4-6a 70% CH4 rpm without load ... 72
Fig. 4-6b 70% CH4 temperatures without load ... 72
Fig. 4-7a 80% CH4 rpm without load ... 73
Fig. 4-7b 80% CH4 temperatures without load ... 73
Fig. 4-8a 90% CH4 rpm without load ... 74
Fig. 4-8b 90% CH4 temperatures without load ... 74
Fig. 4-9 The picture of combustion chamber (oil) ... 75
Fig. 4-10 The picture of combustion chamber using 70% CH4 (gas) ... 75
Fig. 4-11 Thermal efficiency of 80% and 90% CH4 ... 76
Fig. 4-13 Output of generator using 90% CH4 ... 77
Fig. 4-14 Output of generator using 80% CH4 ... 77
Fig. 4-15 Output of generator using 70% CH4 ... 78
Fig. 4-16 Output of generator using 60% CH4 ... 78
Fig. 4-17 Output of generator using 99.5% C3H8 ... 79
NOMENCLATURE
a Diameter of combustion chamber
A Cross-section area
pan
A Cross-section area of combustion chamber
h Convection heat transfer coefficient
g
T True gas temperature
t
T Temperature measured by thermocouple probe
w
T Wall temperature of thermocouple
w
A Cross-section area of thermocouple probe
R
u Relative uncertainty of each independently measured quantity
T1 Temperature of compressor inlet
T2 Temperature of compressor outlet
T3 Temperature of turbine inlet
T4 Temperature of turbine outlet
Constant-volume specific heat Greek Symbol
ε Emissivity of the thermocouple
σ Stefan Boltzmann constant
α Absorptivity of the thermocouple m Volume flow rate
Chapter 1
Introduction
1.1 Motivation
Now, the utilization of renewable energy and development of new energy sources are main energy policies of government. A large amount of biogas derived from wastes is an optimal source of fuel at present. Generally, there is about 50% of methane contained in marsh gas. Methane is lighter than both air and natural gas with similar thermal physical. Gotten from rubbish, methane can be the fuel resource, or cause air pollution.
The high concentration of methane gas in the atmosphere may cause explosion or plants fading. The most important one is that methane gas can cause the greenhouse effect 24 times more than that carbon dioxide
(CO2). The greenhouse effect is the international problem. After the
agreement of “The Kyoto Protocol”, there are some influences on the economy development, and the industrial structures have been changed. So it is an important environment protection problem to control the greenhouse-effect gas. The generation of electric power by the methane gas can reduce the greenhouse effect and increase power sources simultaneously.
Recently, people pay intensive attention to find the new sources of energy, to save the energy, and to answer the environmental consciousness. National Science Council awarded a three-year research
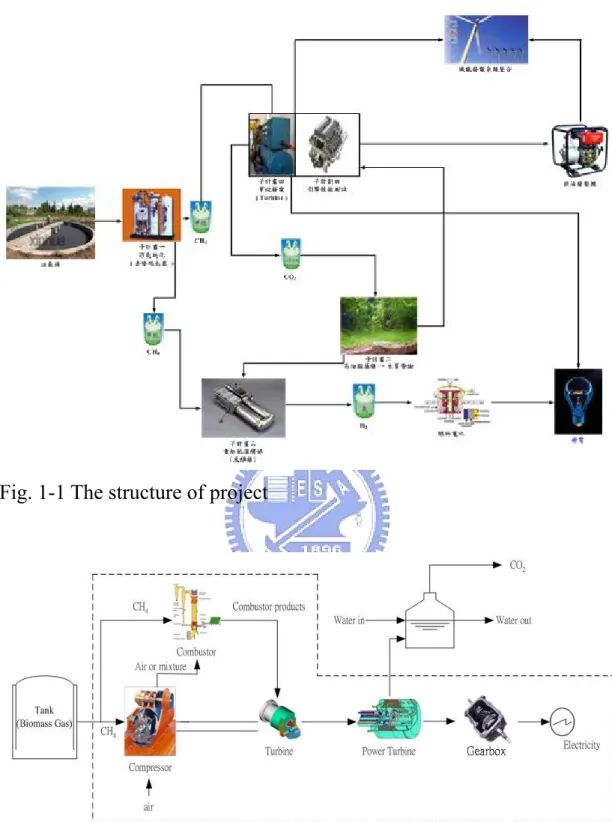
project to our laboratory from 2006 to 2008. Fig. 1-1 shows the
infrastructure of project, which was divided into four subprojects. The
goal for the subproject 1 is to upgrade the utilization efficiency of biogas
by removing H2S and improve the power generation rate. The CO2
emitted from biogas will also be reduced by chemical methods. In the
subproject 2, the focus of research is the production of biodiesel from
high lipid-content algae utilizing waste CO2. The purpose of the
subproject 3 is to develop a process that may effectively produce
hydrogen from primary products of biomass (including alcohols, methane of subproject 1 and biodiesel of subproject 2). In the subproject 4, based on the low-heating-value fuel obtained from the bio-process to removing
H2S from marsh gas (Subproject 1), it will be developed a micro gas
turbine (MGT) by modifying the burner from a liquid-fuel burning gas turbine system into a gas-burning one to generate the combustion power, which is used to drive a generator to produce lectricity. It is a co-generation process, which can be one of the potential candidates for the distributed power supply systems.
The research of this thesis is focus on subproject 4. Figure 1-2 shows the basic structure of a MGT generator. Gas turbine is a system device which supplies jet propulsion and/or power. Gas turbine can make the much stronger gas flows than a piston engine during the common continuous processes of running. The strength of gas flow can be change to axial power by a gear box with turbine. If the axis connects with a generator, then the gas turbine can be used to generate electric power.
technologies for small-scale power generation. There are less moving parts in a micro gas turbine with less friction loss, lower vibrating, lower electricity costs, high reliability and less maintaining cost. Besides, the size of micro gas turbine is smaller and its weight is lighter so that it can generate a high power-to-weight ratio and lower emissions.
It can be located on sites with space limitations for the production of power, and the waste heat recovery can be used to achieve efficiencies of more than 80%. It is also more efficient compared with the reciprocating engine, because of its simple structure and less moving parts. In terms of power density, gas turbine is also better than the reciprocating engine.
The fuel of micro gas turbine can use the methane gas to replace the traditional oil fuel to generate electric power. The methane gas is obtained from the purified marsh gas through bio-process. According to the present biochemical technique, there still exists a little amount of
impurity gases, such as carbon dioxide (CO2), which cannot be removed
completely. It would dilute the concentration of pure methane gas so that the micro gas turbine is not easily to operate. In addition to the concern of heat value, the phase state of liquid is different from that gas. This difference would cause the mismatch of the gas turbine system.
The components of gas turbine can be roughly divided into three parts: compressor, turbine wheel and combustion chamber. With introducing the low heating value fuel, its total volume flow has a much greater mass fraction of air than that with a liquid fuel. Consequently, the reaction behaviors in combustion chamber are also changed. Therefore the gas turbine should be tuned to fit the application low heating value
fuel. When the system is microminiaturization, it can be used in many kinds of electric power demands, for instances, like electric vehicles, motorcycles, portable generators, even PCs and notebooks.
1.2 Literature Review
According to Jan Peirs et al.’s researches [1][2], a micro turbine with a rotor diameter of 10mm was used to generate electric power, and the fuel used was liquid fuel. It was well-known that the performance of both turbine and compressor were clearly limited by the maximum attainable speed. Consequently, the first goal was to increase both turbine and compressor speeds. Secondly, the turbine and compressor needed to redesign to match each other’s characteristics to increase their efficiencies. The micro turbine developed at MIT was a radial turbine with a rotor diameter of 4mm, manufactured lithographically in Si or SiC. The micro turbine developed at Stanford University used an axial-radial turbine with a diameter of 12mm. A 10mm diameter axial micro turbine with generator was developed and successfully tested to speed up to 160,000 rpm. It generated a maximum mechanical power of 28W with an efficiency of 18%. Power and efficiency were mainly limited by the tolerable maximal speed of the ball bearings. When coupled to a small generator, it generated 16W of electrical power, and the efficiency for the total system was 10.5%. The rotor was tested up to 130,000 rpm with 330℃ compressor air. The size of the micro turbine was so small that could be widely applied, but some researchers were wondering why not
established the micro gas turbine generator systems, whose capacities were up to hundreds of kW. However, the size scale was too large to be portable. Wen [3] studied the micro turbine generator system that introduced the experimental foundation for a 375hp micro turbine generator system, which included inlet and exhaust sections, testing frame, operating control system and measurement system. Besides, the micro turbine generator system had to be coupled with the operating control system, which included starter system, fuel supply system, lubrication system, ignition system and secondary air supply system of combustor. And he completely designed and constructed the measurement devices and data acquisition system that were needed for measuring
engine baseline performance. Wang [4] studied a 150 kW micro turbine
generator set with twin rotating disk regenerators by testing and analyses. Using the PC-based data acquisition system, the engine speed, turbine inlet temperature, exhaust temperature, compressor inlet and discharge pressure, and fuel flow rate were measured. The generator set was tested by using load bank to establish the baseline performance including temperature, pressure, horsepower, fuel consumption, and speed. He used a software program (GasTurb) to predict the performance of the micro turbine generator set at different operating conditions in order to compare with the test results. The thermal efficiency of 28% was predicted at full load with regeneration, whereas in the case of no regeneration, thermal efficiency was only 14%.
Yamashita et al. [5] studied a MGT, operating with the experimental conditions using low-heating value fuels simulated in terms of the
dilution of LPG (liquefied petroleum gas) with N2. Efficiencies at each
system component were calculated from the measured temperature and pressure. The obtained results were summarized as follows: Under the condition of a fixed volume flow rate of the supplied fuel, TIT (turbine inlet temperature) is deterioration of the overall system efficiency. As the
LPG-N2 mixing ratio is increased, NOx emission is decreased, and CO is
increased because of the incomplete combustion occurring at the combustor. The MGT system was successful in operating at the fuel condition of 43% heating value of LPG, indicating the acceptability to such low-heating value fuels without any modification of the combustor.
Kousuke et al. [6~8] and Shuji et al. [9] studied the micromachining gas turbine, which was under development at Tohoku University. In the micro gas turbine, the heat transferred from the high temperature components, such as the combustor and the turbine to the low temperature ones, such as the compressor, was very large because the distance to separate the high temperature from low temperature components was closer than that of the general turbine. So, the temperature gradient in micro turbine became large if the highest and lowest temperatures in both turbines were the same. Therefore, the micro gas turbine could not be directly reduced the scale as the same structure of the macro-scale gas turbine because the thermal efficiency would be too low. The performance test of their gas turbine has been started, and ran up to 566,000 rpm, which is approximately 65% of the design speed. The compressor performance has been successfully measured along a constant speed line at 55% of the design speed, and indicated that the
temperature gradient increases with a decrease of MGT size if the highest and lowest temperatures for both large and small scale gas turbines are the same. AS a result, the material of the micro gas turbine should be stronger than that of the large scale one and the MGT efficiency is expected to be reduced because the ratio of the heat loss to heat release increases. The heat loss is proportional to the surface area of the MGT’s case, temperature gradient across the wall, and heat conduction coefficient of wall material. On the other hand, the heat release is proportional to the volume of the MGT’s case and the space heating rate. At this scale of a micromachined combustor, the heat loss to heat release ratio is expected to be about 5%. It is still an order of magnitude larger than that of conventional gas turbine, but is much less than that of M.I.T’s, which is about 20%. Kousuke et al. [7][8] also indicated that when the requirement a pressure ratio of 3 by an impeller of diameter 10mm is achieved, the rotor s required to rotate at 870,000 rpm, which is not tolerable by today’s ball bearing technology. Hence, air bearing should be used. Among the air bearings, hydrodynamic air bearing is preferable because the extra air supply is not required. The hydroinertia bearings are employed in both radial and axial directions. The performance of the compressor was measured at 60% (530,000 rpm) of the rated rotational speed (870,000 rpm) by driving a turbine using compressed air. The measured pressure ratio was lower than the predicted one because the impeller’s tip clearance was larger than the designed value. During an acceleration process toward the rated rotational speed, the shaft was destroyed at the bearing at 566,000 rpm. At high speed, a large bearing
gap and very high rotor balance were required to achieve low viscous loss and to prevent the rotor from hitting the bearing at critical speed. Hence, a hydro-inertia gas bearing had been selected with half-split bearing sleeves. A hydro-inertia bearing was a type of static air bearing which had large bearing clearance to generate supersonic flow in the bearing gap. At present, a rotor speed as high as 770,000 rpm has been achieved in the test.
Li [10] manufactured a model chamber, which was geometrically
identical to prototype chamber, in the cold-flow tests. It was found that the pressure loss of flow through the liner hole is about 3% of the total pressure. And he also found the information about the flow rate of the holes. These are helpful to modify the chamber design. In the firing tests, it discussed the mixing effects by changing the fuel injection direction and by controlling the numbers of swirl holes. The results showed that upstream fuel injection mode dose play well in the short chamber length comparing with the side fuel injection mode.
Tsai [11] studied the gas turbine combustor design. The combustor had to design to meet some requirements, including high combustion efficiency over a wide operating envelop, stable operation, low pressure loss, low temperature pattern factor and low pollution emissions. In cold flow test, differential pressures as airflow penetrating the liner hole were measured to further understand its flow distribution. It was found that the jet dynamic pressure ratio K is found different from the one in large turbine combustors and K's value seems too small that the discharge coefficient Cd is quite sensitive to flow condition, resulting in the
variations of Cd and flow distribution.
Shiung [12] found that during the design of a micro engine combustor, it was always difficult to accurately arrange the inlet air distribution, because the suitability of the conventionally recommended Cd (discharge coefficient) based on large and small engines was questionable for micro-engine. The relationship between Cd and dynamic pressure ratio K (for micro-engines with K ranging from 1 to 4) was experimentally established. Then, with the aid of the oil flow techniques and pressure data, the inlet air distribution could be estimated.
1.3 Scopes of the present study
In this research, the original combustor of a micro gas turbine (WREN MW54) is modified first to burn the gaseous fuel, instead of the primary Jet A1, a liquid fuel. Now, the Jet A1 fuel is replaced by a
simulating biomass gas fuel of low heating value, CH4 mixed with CO2,
to generate the electric power. The use of mixture gaseous fuel is because the present biochemical technique cannot obtain very pure methane gas from the purified marsh gas. In other words, the bio-gas
inevitably contains certain impurity gases, such as carbon dioxide (CO2),
that are hard to remove completely. The quantity of impurity gas will dilute the concentration of pure methane so that the power of micro gas turbine is expected to be lower than the original designed value, burning with liquid fuel, even worst; it may not work at all.
The experimental study will vary some parameters in order to measure the power generation of such modified micro gas turbine. There
will be various mixture ratios of CH4 and CO2 of low-heating-value fuel
used in this study. The concentrations of CH4 in fuel are changed from
90% to 50%, and the ones of CO2 increase from 10% to 50%
simultaneously. Via this parametric study, it is intended to find the best operating parameters between pressure and flow rate to obtain the best output.
Chapter 2
EXPERIMENTAL APPARTUSES
2.1 Experiment layout
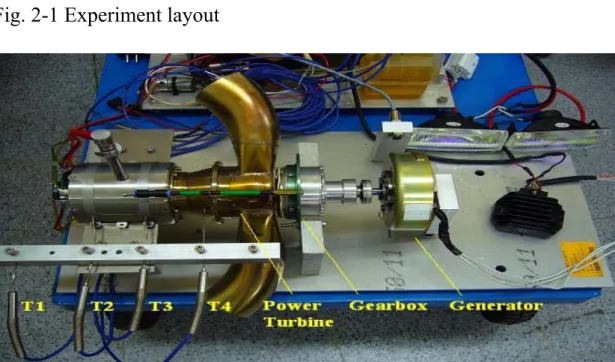
All the Experiment layouts are shown in Figs. 2-1 and 2-2. The micro gas turbine (MGT) and its schematic dimension of major parts are shown in Figs. 2-3a~b to 2-8a~b. Transmission gear box and generator, which are placed on a test frame, made of 6061 aluminum alloy, are shown in Fig. 2-8a and Fig. 2-9, respectively. Each of the parts is stably fixed on the frame. The blower used to start to drive MGT is connected with the MGT air inlet by a rubber tube. As soon as MGT reaches the idle rpm, the rubber tube is removed and MGT can be inhaled by its own power.
The generator is connected to MGT by the transmission gear box, which transforms the power, produced by the MGT, to axial work. And the axial work can drive generator to generate electric power. The fuel pressure and flow rate, at inlet nozzles of combustion chamber, can be adjusted by the pressure valve and flow meter. The MGT’s rotation speed is detected by an induction tachometer installed near the compression fans. The compressor’s inlet and outlet, the turbine’s inlet and outlet, and the exhaust temperatures are measured by thermocouples set up across the MGT’s case. All measured data are transferred to the disk storage using a PC-controlled data acquisition system.
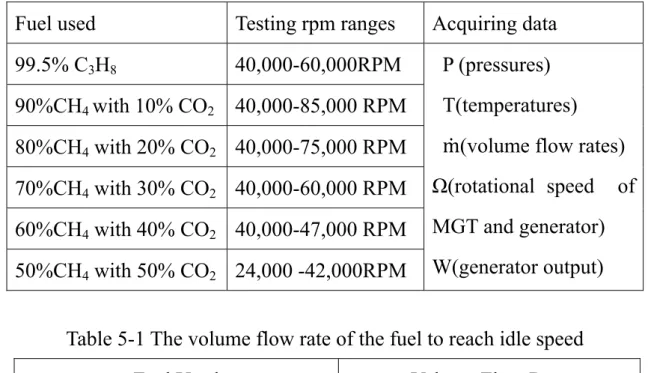
2.2Parameters of tests
The experimental parameters include fuel concentration (the volume
fraction ratio of CH4 to CO2) and turbine rpm. The fuels used are 99.5%
C3H8, 90% CH4 mixing 10% CO2, 80% CH4 mixing 20% CO2, and 70%
CH4 mixing 30%CO2, and 60% CH4 mixing 40% CO2, and50% CH4
mixing 50% CO2. The turbine rpm are 40000, 45000, 50000, 55000,
60000, 65000, 70000, and 75000, respectively. Each combustion test consists of five different fuels, and each fuel used is with eight different rpm. Each test condition is carried out twice for data consistence. If the low heating value fuel cannot reach up to the anticipated rpm, then, rpm range will be reduced.
2.3 The micro gas turbine system
2.3.1 Micro gas turbine
The MGT is modified from the one of MW54 MK III. The original oil fuel pipe, including the lubrication pipe, is changed to a single gas fuel pipe, and the lubrication pipe is moves to be an independent system, as shown in Fig. 2-2b.
MGT engine is optimized to generate large quantities of hot gas under specific pressure and uses these hot gases to pass through a second
stationary guide vane and turbine, mounted on a separate shaft. The 2nd
turbine, only used to drive the load, is considerably larger in diameter than that of the 1st stage, so it turns slower and with larger blades that can absorb a large amount of energy from the gases passing through it. This
enables a higher torque to be produced at an RPM which is relatively easy to provide further reduction to fit the application. This 2-shaft configuration allows considerable mismatch to be tolerated between power turbine and load.
The heart of the power unit is a single stage gas turbine using centrifugal compressor and axial turbine. Power is drawn from the exhaust gases by a second turbine, which drives the propeller via the gearbox. When the engine uses oil fuel, it is a powerful unit capable of delivering 6kW of smooth and quiet power.
2.3.2 Transmission
The power of gearbox comes from a large power turbine driven by the exhaust gas from the MGT. The power turbine is mounted on a shaft running in high temperature bearings. Lubrication and cooling for these bearings are from a fuel takeoff system supplied via a tube mounted above the engine, feeding via the rear of the gearbox. The input shaft drives a gearbox, comprising a two-stage reduction using helical gears, fully hardened for long life.
The gear box lubrication system is “wet sump,” i.e. oil, held within the gearbox, circulates by the action of the gears such that requires no external oil tank or services. The gearbox is charged with 20ml of automobile transmission oil (usually red in color). In normal use, the oil needs replacement every 20hrs running or 120 tests.
2.3.3 Fuel supply
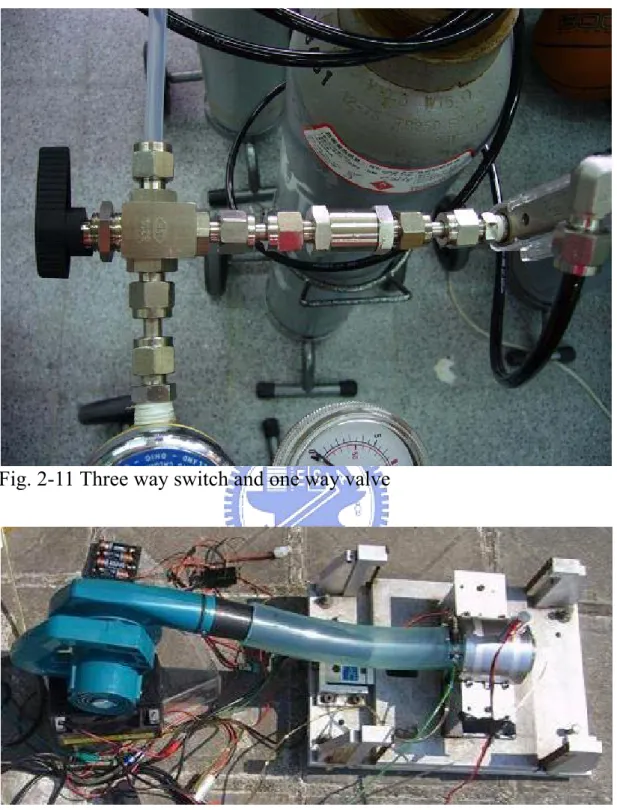
Two 10kg steel cylinders, shown in Fig 2-10, are used. Each cylinder connects to a pressure gauge. As shown in Fig 2-11, both
pressure gauges connect to the flow meter with a three-way switch and a one-way valve. The three-way switch can connect two different fuels. The higher heating value one is easier to ignite and drive the MGT. As the ignition of MGT occurs, switch the valve to the low heating value fuel. 1/8 inch Teflon pipe is used to connect the MGT because it can resist the heat. The gas fuel pressure and flow rate can be control easily. When the fuel needs to be changed, the bottle can be easily switched.
2.3.4 Start system
Blower shown in Fig 2-12 is used to push the MGT’s fan to rotate, and supply the MGT enough air to mixing with fuel. When MGT is turned off, the blower is also used to cool the temperature down. The spark plug is modified to easily ignite the fuel, and is connected with a 1.5V~3V battery or a voltage regulator that can supply enough electric power. If the voltage is too large, the spark plug might be burnt out. 2.3.5 Generator
As shown in Fig 2-9, a 170W alternating current generator (5TY 00 made by T-MORIC), whose resistance of coils are 0.56~0.84Ω at 20°C, is used to generate electric power by the axial work from the gearbox. It can output 14V 170W @ 5000RPM, and the regulator (SH640E-11 anti voltage 200V) can commutate AC to DC.
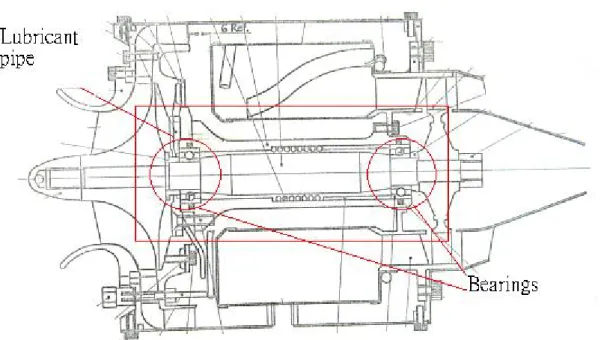
2.3.6 Lubrication
MGT can be worked at a very high rotational speed, so the lubrication of bearings is crucial. In the original system, the lubricating oil is pre-mixed with the oil fuel. When the fuel is emitted into combustion chamber, the lubricating oil and gas will splash to the
bearings.
When the MGT is modified, the fuel used becomes the gas, so the lubricating oil can no longer pre-mix with the oil fuel. The lubricating oil pipe now should be an independent component as shown in Fig. 2-13. The lubricating oil is emitted to the bearings directly by a pump that is controlled by a program. The program is design to control the pump to provide the lubricating oil every few seconds in order to protect the bearings.
2.4 Measurement instrumentation
2.4.1 Temperature measurement
The thermocouples shown in Fig 2-2a and Fig. 2-14 are installed at the MGT compressor’s inlet and outlet, turbine’s inlet and outlet, and exhaust in order to monitor the combustion situation. The highest temperature of the MGT engine is about 600-800°C at the inlet of turbine, so K-type thermocouples, ranged from -200 to 1260°C, are used.
2.4.2 Turbine RPM measurement
An electromagnetic induction kind of tachometer shown in Fig. 2-15 using hall-effect sensor is used to measure the rpm. When the generator turbine blades pass the sensor, which is a magnet in front of the blades, will produce a pulse, and the pulse can be delivered to the data acquisition system. Using a conversion program, the pulses can be transformed to rpm of engine.
2.4.3 Fuel pressure measurement
A mass flow meter shown in Fig. 2-16 has been installed on the fuel line ahead of the injector of the combustor chamber. The flow meter is calibrated to an accuracy of 1% of the full scales, and its acquiring data are volume flow rate which are already calculated by mass divided by density (1 ATM, 0℃).
2.4.4 Fuel flow rate measurement
The fuel supply system is the main component to start the MGT, and the flow rate of the fuel not only needs to be measured but also to be controlled. A mass flow controller (MFC) is a closed-loop device that sets, measures, and controls the flow of a particular gas or liquid. In this research, a HM5000 MFC produced by Tokyo Keiso Company is adopted and is shown in Fig. 2-17. The MFC is calibrated to measure and control the methane fuel.
2.4.5 Generator output Measurement
The output voltage of generator is too large for a data acquisition, so this work uses the cement resisters to cascade with the generator output, and the decrease of the voltage across the resistor can indicate the current of the generator’s output. Also the potential difference is small enough to be accepted by data acquisition. Then, the power is obtained by the multiplication of current and voltage.
2.4.6 Data Acquisition
Data acquisition can automatically gather signals from analog and digital measurement sources, such as sensors and devices, under tests. Data acquisition uses a combination of PC-based measurement hardware
and software to provide a flexible and user-defined measurement system. Usually, the researcher must calibrate sensors and signals before a data acquisition device acquires them. The specifications of these modules of National Instruments are shown in Table 2-2. National Instruments, a leader in PC-based data acquisition, offers a complete family of proven data acquisition hardware devices and the powerful and easy-to-use software that can extend to many languages and operating systems. NI CompactDAQ delivers fast and accurate measurements in a small, simple, and affordable system. A CompactDAQ Chassis shown in Figure 2-18a, a product of NI, is adopted because of the following advantages: plug-and-play installation and configuration, AC power supply and USB cable connection, mounting kits available for panel, enclosure, DIN-rail and desktop development, A380 metal construction, more than 5 MS/s streaming analog input per chassis, and Hi-Speed USB-compliant connectivity to PC. Different types of signal process modules are chosen to complete the data acquisition system, including NI 9203 Analog Input Module, NI 9211 Thermocouple Differential Analog Input Module, NI 9263 Analog Output Module, and NI 9215 Simultaneous Analog Input. All of them are shown in Figs 2-18b~e.
Chapter 3
Experimental Procedures and Uncertainty
Analysis
3.1 Safety Notes
(1) During operation and afterwards, caution must be made for some parts of the engine are so hot that may cause serious burns.
(2) Always have a fire extinguisher nearby when carrying out experiment.
CO2 or BCF is recommended, whereas dry powder, foam or water is
inappropriate.
(3) The engine should avoid running near flammable gases, liquids or materials.
(4) Keep all spectators away from the side and rear of the engine to a distance of at least 10m radius. If operating from a pit area, to take special care for safety distance is often difficult to maintain.
(5) Filling fuel to the MGT must be slow. If give too much fuel, the temperature will increase quickly that causes the breakdown of MGT. (6) MGT operates more than 450°C. Insure nothing will touch it to cause
fire.
3.2 Beginning
(1) Connect the blower to the MGT air inlet by the rubber tube, and connect the fuel pipe.
(2) Connect the lubricating oil pipe, and control the oil pump to fill the pipe with the lubricating oil without any air inside it because the air would become plugs in pipe to stop the pump. Then connect the spark plug power and insure the spark plug is igniting.
(3) Set up all measure sensors (RPM, temperature, pressure, flow rate, and power output), and connect them to notebook via cables.
(4) Use the propane to ignite at first, then, change the liquid fuel to low heating value gaseous fuel. Turn both of the bottles’ valves on, and set up the proper pressures for different fuels (99% propane at about 3bar, 90% methane at about 3~4bar, 80% methane at about 5~6bar, 70% methane at about 6~7bar, 60% methane at about 7bar, and 50% methane at about 8 bar). Switch the three-way valve from propane, and turn on the blower slowly and discontinuously. Then, turn the flow valve to a flow rate of 5L/min.
(5) When MGT is ignited, quickly switch the three-way valve to open the low-heating-value fuel and increase the fuel pressure and the blower flow rate slowly at the same time. If MGT is stall, turn off the flow valve and set up a higher pressure for low heating value fuel. Ignite by propane again and then switch to open the low-heating-value fuel. (6) Turn on the lubricating pump and carefully observe the temperature,
and keep the temperature below 500°C.
(7) When MGT reaches 40000RPM, the blower and the rubber tube can be removed.
(8) If MGT’s rotation rate is suitable, it is idling.
pressure and flow rate until it can be idling.
(10) Adjust the MGT rotation rate to 40000 RPM~75000RPM, and obtain the power outputs (voltage and current), temperatures, pressures, and flow rates.
3.3 End
(1) Turn off the flow rate control valve slowly and the lubricating pump. (2) Connect the blower with the MGT air inlet by the rubber tube, and use
the air sucked by blower to cool the MGT unit it is down to 50°C. (3) Turn off the valves of bottles.
3.4 Uncertainty Analysis
The accuracy of the experimental data should be confirmed before the analyses of experimental results are carried out because the exactitude of the data may not be very good. Uncertainty analysis (or error analysis) is a procedure used to quantify data validity and accuracy [13]. Experimental measured results are always having errors. Experimental errors can be classified into fixed (systematic) error and random (non-repeatability) error, respectively [13]. Fixed error is the same for each reading and can be removed by proper calibration and correction. Random error is different for every reading and hence cannot be removed. The objective of uncertainty analysis is to estimate the probable random error in experimental results.
single-sample and multi-sample experiments. If experiments could be repeated enough times by enough observers and diverse instruments, then the reliability of the results could be assured by the use of statistics [14]. Repetitive experiments would be called multi-sample ones. Experiments of the type, in which uncertainties are not found by repetition because of time and costs, would be called single-sample experiments.
3.4.1 Analyses of the Propagation of Uncertainty
Uncertainty analysis is carried out here to estimate the uncertainty levels in the experiments. Formulas for evaluating the uncertainty levels in the experiment can be found in many papers [14, 15] and textbooks [13~17]. They are presented as follows:
Suppose that there are n independent variables, x1,x2,…,xn, of
experimental measurements, and the relative uncertainty of each
independently measured quantity is estimated as ui. The measurements
are used to calculate some experimental result, R, which is a function of
independent variables, x1,x2,…,xn; R =R
(
x1, x2 ,..., xn)
.An individual xi, which affects error of R, can be estimated by the
deviation of a function. A variation, δxi, in xi would cause R to vary
according to i i i x x R R δ δ ∂ ∂ = (3.1)
Normalize above equation by dividing R to obtain
i i i i R x x R x R δ δ δ ∂ ∂ = ∂ ∂ = 1 (3.2)
Eq. (3.2) can be used to estimate the uncertainty interval in the result due to the variation in xi. Substitute the uncertainty interval for xi,
i i x i i R u x R R x u ∂ ∂ = (3.3)
To estimate the uncertainty in R due to the combined effects of
uncertainty intervals in all the xi’s, it can be shown that the best
representation for the uncertainty interval of the result is [15]
2 1 2 2 2 2 2 2 1 1 1 ... ⎥ ⎥ ⎦ ⎤ ⎢ ⎢ ⎣ ⎡ ⎟⎟ ⎠ ⎞ ⎜⎜ ⎝ ⎛ ∂ ∂ + + ⎟⎟ ⎠ ⎞ ⎜⎜ ⎝ ⎛ ∂ ∂ + ⎟⎟ ⎠ ⎞ ⎜⎜ ⎝ ⎛ ∂ ∂ ± = n n n R u x R R x u x R R x u x R R x u (3.4)
3.4.2 The Asymmetric Uncertainties of Thermocouple
The temperatures are measured by a 1mm diameter K-typed thermocouple, whose signals are sent to a PC-record. The accuracy of the thermocouple itself without coating is ±0.2%. Due to the effects of conduction, convection, and radiation, it is worthwhile to check the correctness of gas temperature measured by such K-typed thermocouple. Via an application of energy balance, i.e.,
Energy in = Energy out, or
Convection to the junction of thermocouple = Radiation from the junction of thermocouple + Conduction loss from the probe
Because of the fine thermocouple (1mm), the conduction term can be neglected. Then, the steady-state energy equation can be rewritten as follows. 0 ) ( ) ( − − 4 − 4 = w t w t g wh T T A T T A σ ε α (3.5)
In practice, the gas temperature is much higher than the wall
temperature of thermocouple, so the absorption term, 4
T
relatively low wall temperature of thermocouple can be removed from Eq. (3.5). According to Eq. (3.5), the expression of correlation is given as:
h T T Tg t t 4 εσ + = (3.6)
where Tg = the true gas temperature
Tt = the temperature measured by thermocouple probe
=
ε emissivity of the thermocouple
=
σ Stefan Boltzmann constant
=
h convection heat transfer coefficient at thermocouple wire
surface
Now, the analysis method of uncertainty can be utilized to obtain the uncertainty in the flame temperature from the correlation associated with
h, Tt, and ε. The relationship between temperature and error is shown
in Fig. 3-1.
3.4.3 The Experimental Repeatability
In order to confirm the accuracy and coincidence of the experiment, selecting one test under the specified mixing fuel, pressure and flow rate of the fuel has executed at three times to ensure the experimental repeatability. The following examples are illustrated to show the creditability in the previous statement. The volume flow rates for four different low heating value fuels and several different RPMs are selected to demonstrate the experimental repeatability. It recorded three measured data of volume flow rate and made an average value for each test. The three measured data, their averaged value, and the standard deviation are
difference value between the three volume flow rates and the coefficient of variation are also listed in Tables 3-1~3-4. The coefficient of variation
(C.V.) is defined as the ratio of the standard deviation s to the meanX,
where the standard deviation s is calculated as:
∑
==
N 1 i 2 i-
X
)
(X
N
1
s
(3.7) The coefficient of variation is a dimensionless number that allows comparison of the variation of data points in a data series around the mean. The averaged values are represented by curves. It can be seen in Figs. 3-2a~3-2d that in general the errors are within the acceptable range (<3%) and the repeatability shown in Figs. 3-3a~3-3d are really good. The volume flow rate, pressure and their corresponding characteristics will be discussed in detail in the next chapter.
CHAPTER 4
RESULTS AND DISCUSSION
The original MGT, whose fuel was liquid, was modified for using gaseous fuel. Therefore, the original pipes were also adjusted accordingly. In addition, the lubricant for bearings in original MGT was pre-mixed with oil fuel, now its supply system should be separated from the fuel pipes after modification.
In the experiment, the idling rpm, 45,000 rpm, was reached at first. In order to increase the efficiency of fuel usage, the data were acquired continuously for the rpm that was increased 5000 rpm at each step. And each step was maintained for about 10 seconds to ensure the engine can achieve a stable condition within that duration so the measured output data at each step were meaningful. Otherwise, the stop-and-run experiments would consume a lot of amount of gases that the time was consuming and the expense was not able to be handled.
In order to let the MGT be capable of working with the low-heating-value fuel, the fuel supply system needed to take enough pressure to ensure that it would have ample fuel density. For example,
when the fuel with 100% C3H8 was applied, MGT would only need 3bar
fuel pressure for idling, on the other hand, it would require 8bar fuel
pressure to achieve the condition when using 60% CH4 with 40% CO2 as
the low-heating-value fuel. In reality, MGT does not need such high pressure. What it needs is to provide a higher volume flow rate with the low-heating-value fuel. Unfortunately, the original fuel supply pipes in
the present study were too narrow to be able to reach the proper fuel supply rate. In other words, when low-heating-value fuel was at a low pressure, the MGT could not have enough fuel to burn. So the fuel’s pressure was expected to reach a maximum of 12bar for top performances. In the condition when the diameters of the fuel pipes were increased, the MGT could obtain enough fuel at low pressure. Besides, adding new fuel pipes from the fuel tank directly to the combustion chamber could achieve better fuel-efficiency. In such way, MGT could be modified more easily instead of changing all the fuel pipes.
Then, the corresponding sensors and actuators for the micro gas turbine system were also established. The temperatures were acquired by K-type thermal couples from four different parts of the MGT. There were compressor inlet, compressor outlet, turbine inlet, and turbine outlet. Besides, there were two tachometers. One indicated the rpm of MGT, and another measured the rpm of generator. The measurements, which could indicate the engine performance, would be analyzed and evaluated by
changing the low-heating-value fuel (CH4 mixed with CO2) with various
fuel flow rate.
As the design procedure was completed, the fabrication, component tests, and operation of the developed gas turbine engine system were performed for parametric study to establish the start-up (idling) and operation procedure. All of them will be discussed in details in Sections 4.1 and 4.2.
4.1 The tests with different fuels with no load
In this section, the MGT without load was testing. There were various low-heating-value fuels with different mixture ratios of methane (CH4) and Carbon dioxide (CO2). The concentrations of CH4 in fuel were
changed from 90% to 50%, and the ones of CO2 increase from 10% to
50%, correspondently. The test conditions are summarized in Table 4-1. The temperatures of major parts of MGT were measured under the given fuel and fuel flow rate, a function of gauge pressure of cylinder. The corresponding thermal efficiency was calculated accordingly. Finally, a performance comparison was given.
4.1.1 The pressures and volume flow rate of fuel at MGT with no load The pressure of fuel was the pressure of cylinder (bottle), which could be adjusted by a control valve, and it determined the fuel volume flow rate. The measured volume flow rates for each low-heating-value fuels as a function of pressure are listed in Table 4-2, and the volume flow rate is calculated from the mass flow rate. (CH4 density is 0.7168 g/L at 0
℃, 1 atm) It can be seen that the volume flow rate for each fuel almost is linearly proportional to the pressure. The resultant rotational speeds as a function of pressure for various low-heating-fuels are shown in Figs. 4-1a and 4-1b.
In the test of fuel using 90% CH4 with 10% CO2, it can approach
85,000 rpm when the pressure reaches the maximum of 12bar, whereas in
50% CO2 can reach as low as 24,000 rpm as shown in Fig. 4-1b. It is
because the test in Fig. 4-1b was carried out in the path from higher pressure to lower one, whereas the other tests in Fig. 4-1a were taken from the reverse order.
Obviously, the performance of MGT is influenced by combustible fuel concentration contained in the low-heating-value fuels. From Fig.4-1a, as expected, the higher heating-value fuel will have better performance because the fuel can supply more energy to MGT. Also, the lower heating-value fuel should have higher pressure in order to approach idle at 45,000 rpm.
Since the narrow fuel’s pipes, originally used for oil fuel, were not modified, the gas pressure was needed to increase to enhance the volume flow rate of low-heating-value gaseous fuel. As shown in Figs. 4-2a and 4-2b, they indicate that the MGT performance is proportional to the
concentration of CH4 in fuel and the volume flow rate. Therefore, if the
volume flow rate can be increased, the MGT will be expected to have better performance. Moreover, there are some difficulties to using low-heating-value fuel. The maximum rotational speed may be reached at a low rate which produces choking conditions at some point in the MGT. The choke may occur in the nozzle throats or in the annulus at outlet from the turbine depending on the design. If the rotational speed increases to higher rpm (>85,000 rpm), the choke phenomenon may have more affection to limit the rotation speed of turbine wheel. It is because the rotational speed is increasing with flow rate increasing, but the maximum pressure of fuel is reached first. Hence, the choke does not occur at
present tests. When choking occurs at the higher rotational speed, the turbine can be modified by increasing the gap between the turbine blades in order to let more mass flow through the turbine to increase the rotational speed and thrust. In the other hand, a large gap between the turbine blades may cause low efficiency. In this research, the equivalent ratio is calculated from:
O H CO O CH4+2 2→ 2+2 2 (4.1) Air: Fuel (CH4) = 18.125: 1
The air mass flow rate at primary zone that evaluates from the
compressor map at 45,000rpm is 321.12g/min, and the fuel mass flow rate is 26.87g/min. The A/F is 16.7 less than the equivalent ratio 18.1, but at 80,000rpm the A/F is 22.5 more than the equivalent ratio 18.1. Hence, the A/F increases when the rotational speed increases at 45,000~80,000rpm.
Besides, since the volume flow rate is proportional to the cylinder pressure as mentioned previously, both Figs.4-1 and 4-2 are expected to
be similar, and the relationship between pressure and fuel volume flow
rate is described by the linear regression equation.
5.54 4.2 (4.2) Now, the volume flow rates of low-heating-value fuel are replaced
by the ones of CH4, and the corresponding results are shown in Fig. 4-3.
From this figure, it can be seen that under the given compressor rotational
speed, the volume flow rates of CH4 from different low-heating-value
fuel are almost the same, indicating the stable combustions occur in this MGT even the different fuels are supplied.
4.1.2 The temperature of MGT without load
There are four temperatures measured, the acquisition positions are at compressor inlet (T1), compressor outlet (T2), turbine inlet (T3), and
turbine outlet (T4). The histories of all the temperatures and
corresponding rotational speeds for 5 different fuels are shown in Figs. 4-4~4-8. In each figure, the upper is rotational speed, whereas the lower
is the 4 measured temperatures. Note that in Figure 4-4 (50% CH4 with
50% CO2), the experiments were carried out from higher rotational speed
to lower one, whereas In Figs. 4-5~4-8, they were taken in reverse order. In general aspect, these figures show the same trend that both the inlet and outlet temperatures (T3 and T4) of turbine decrease with the increase
of rpm. It is because when the rpm of compressor increases, it brings more air to combustion chamber, and the temperature of turbine is cooled by this excess air. Liou and Leong [24], who used the same MGT but with an application of oil fuel, also found the same phenomena between 40,000 to 120,000rpm. However, when the MGT was over 120,000 rpm,
the temperature would increase with an increment of rpm in their work. Figures 4-4~4-8 show that the turbine inlet temperatures (T3) vary
slightly with different concentrations of CH4 in fuels. So do the turbine
outlet temperatures (T4). Also, the temperature differences between T3
and T4 for all of low-heating-value fuels are more or less the same. The
reason can be attributed to the results of Fig. 4-3 that under the same
compressor rotational speed, the amounts of CH4 burned are the same for
operation because the blower and fuel are controlled by human hands. If
the flow rate of air was supplied excessively, T3 and T4 would decrease
immediately. On the other hand, if the flow rate of fuel was supplied excessively, T3 and T4 would soon increase sharply.
Figure 4-9 shows the surface (case) conditions of combustion chamber by using oil fuel, whereas Figure 4-10 shows the one by using gaseous fuel. Apparently, the burning damage in Fig. 4-10 is worse. Obviously, the temperature of combustion chamber using methane is higher than that using liquid fuel, because the combustion chamber is designed to burn liquid fuel. If the gaseous fuel was used, the cooling system would not be enough. So, the cooling holes of combustion chamber should make some modifications if the high turbine efficiency is pursued.
4.1.3 Thermal efficiency
The efficiency of the air-standard Brayton cycle is found as follows:
η
1
QL QH1
C T T C T T1
T TT T TT (4.3) According to Sonntag et al. [25], because the working fluid does not go through a complete thermodynamic cycle in the MGT, the internal combustion engine operates on the so-called open cycle. However, for analyzing internal-combustion engines, it is advantageous to devise closed cycles that closely approximate the open cycles. One such approach is the air-standard cycle, which is based on the following assumptions:1. A fix volume of air is the working fluid throughout the entire cycle, and air is always an ideal gas. Thus, there is no inlet process or exhaust process.
2. The combustion process is replaced by a process transferring heat from an external source.
3. The cycle is completed by heat transfer to the surroundings. 4. All processes are internally reversible.
5. An additional assumption is often made that air has a constant specific heat, recognizing that this is not the most accurate model.
The thermal efficiency of the MGT is obtained from the efficiency of the air-standard Brayton cycle as shown in Eq. (4.3). Figure 4-11 is the thermal efficiency verse compressor rotational speed. For the fuels of
90%, 80% and 70% CH4, the efficiency decreases with a increase of
rotational speed. Based on Eq. (4.3), the thermal efficiency is influenced by T4, T3, and T2 (the outlet temperature of compressor). T2
increases with the rotational speed of compressor. As T2 increases, the
thermal efficiency decreases, but if T3 and T4 decrease in higher rpm,
thermal efficiency will expect to increase. Actually, thermal efficiency decreases, because the influence of increasing T2 is larger than decreasing
T3 and T4 in higher rpm. It is shown in Figs. 4-11 and 4-12 that
lower-heating-value fuels have more thermal efficiency than higher-heating-value fuels. Theoretically, thermal efficiency should not increase in lower-heating-value fuels. It is because the pressure and flow rate of lower-heating-value fuels are larger than higher-heating-value, and the mismatch of combustion chamber makes the flame be moved to
approach the T3 thermal couple. Hence, the T3 is increased. Besides, if
there are pressures, compressor efficiency and turbine efficiency in the MGT, cycle analysis could be used to present more accurate efficiency than the air-standard Brayton cycle. The definition of the efficiency of ideal cycle is unambiguous, but is not accurate for an open cycle with internal combustion. Knowing the compressor delivery temperature, composition of the fuel, and turbine inlet temperature required, a straightforward combustion calculation yields the A/F ratio necessary; and combustion efficiency can also be included to allow for incomplete combustion. Thus it will be possible to express the cycle performance unambiguously. The previous section dealt with the air-standard Brayton cycle, but work output and efficiency of all actual cycles are considerably less than those of the corresponding ideal cycles because of the effect of compressor, combustor, and turbine efficiencies and pressure losses in the MGT.
Assuming the compressor efficiency is ηc and the turbine efficiency
is ηt, and the actual compressor work and turbine work is given by:
Wca = ma(h2-h1)/ ηc (4.4)
Wta = (ma + mf)(h3a-h4) ηt (4.5)
Then, the actual output work is
Wact = Wta -Wca (4.6)
The actual fuel required to raise the temperature from 2a to 3a is
mf = (h3a - h2a)/ ηb(LHV) (4.7)
h4a = h3 -Wca (4.8)
The power turbine output work is
Wa = (ma + mf)(h4a-h5) ηt (4.10)
Thus, the overall adiabatic thermal cycle efficiency can be calculated from the following equation:
ηt = Wact + Wa/mf(LHV) (4.11)
4.2 The MGT tests with generator
In this section, the MGT with generator was under test, and the other test parameters were the same as those in the Sec. 4.1. However, an
additional new fuel, C3H8, was used in this section. Except the
temperature measurements, the electricity generated by generator is discussed as well. The test conditions are summarized in the following table (Table4-4).
4.2.1 The pressures, volume flow rate of fuel, and temperatures at MGT with generator
All the measured temperature trends of MGT with generator are similar to the ones of MGT without load. MGT does not drive the generator directly. Actually, the generator is driven by gearbox, which has a power turbine that is driven by the high temperature and pressure gas from the MGT. Apparently, generator has little influence on MGT.
The output of MGT is directly influenced by the fuel volume flow rate, which is proportional to the cylinder pressure as mentioned previously. If the volume flow increases, the performance would be better. Nevertheless, the volume flow rate in the MGT system is limited by the
fuel pipes, whose diameters were too narrow. The achievable volume flow rate cannot be over 58L/min, even if the highest pressure (12bar) was applied in the system. The pressure cannot exceed 12 bar, to prevent the pipe of MGT system from breakage.
4.2.2 The choice of the generator system
The loads of the MGT system are represented by two tungsten lights. When they operate in series, the resultant resistance is greater than the ones operated in parallel, and the current intensity becomes smaller. In other words, if the current is increased in circuit, the coils of generator will make more loading to MGT. Therefore, the series arrangement of load can be driven by the MGT with the low-heating-value fuels of 60%
and 70% CH4. On the other hand, the parallel arrangement of load can
only be driven by the MGT using the low-heating-value fuels of more than 80% CH4.
The choice of generator that can fit the MGT is really important. If the power of generator is too large, it will make excessive loading, and cannot be operated in suitable range. On the contrary, if the power generator is too low, it cannot supply enough loading, and the best performance cannot be measured. The worst condition is that the gear box of MGT system may be broken when it exceeds the limiting rotational speed.
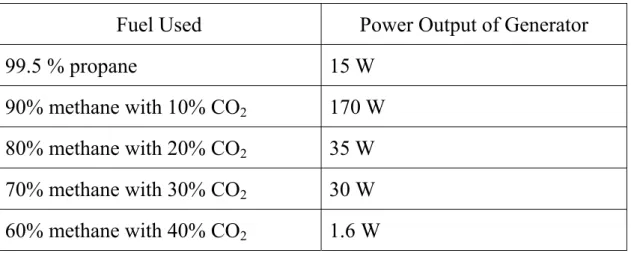
4.2.3 Output of electric power
full power. Figures 4-13~4-17 are the power generations as a function of rotational speed of generator by using different low-heating-value fuels
and 99.5% C3H8. In Fig.4-13, output by using 90% CH4 fuel reaches
about 170W, the maximum of generator. At the same time, output of generator has been controlled to maintain an output of 170W. Thus, if the MGT can be improved to have a better performance, the generator should
be changed also in order to facilitate the maximum output. As the CH4
concentration is lowered to 80%, as shown in Fig. 4-14, its heating value cannot support the generator to generate 170W output because the resultant rotational speed cannot reach the critical value of 85000rpm. Similar behaviors are expected to observe for further lower
concentrations of CH4, such as 70% and 60%, which are presented in Figs.
4-15 and 4-16. Fig. 4-16 is the power output by using low-heating-value
fuel of 60% CH4. The power is extremely low because MGT’s rpm is
too low to drive the generator. For the fuel of 50% CH4, the MGT can
reach the idle without load, but the generator cannot operate steadily. Thus, the output of using 50% CH4 fuel is not presented.
Finally, a case by using 99.5% C3H8 as the fuel is added. However,
as shown in Fig. 4-17, the resultant output is not better than one using the low-heating-value fuel of 90% CH4. It is because C3H8 can be liquefied at
around 5bar, so it cannot supply enough pressure to provide more fuel under present MGT system to generate more power to drive the rotational speed up to 85,000rpm.
CHAPTER 5
CONCLUSIONS AND FUTURE WORKS
5.1 Conclusions
In this research, the practicability of MGT system was examined when different low-heating-value fuels were applied. A commercial product of MGT, MW54, was adopted in this research. The combustion chamber of this turbine engine was re-fabricated by modifying the burner from a liquid-fuel burning system into a gas burning one. The obtained analysis results were summarized in section 5.1.1 for the MGT system without load and section 5.1.2 that the MGT system with load.
5.1.1 MGT tests without generator
1. A commercial micro gas turbine, which originally used liquid fuel could operate with gaseous fuel without a lot of modifications.
2. The present MGT system operated successfully under each tested condition, where the minimum heating-value of the fuel was
approximately 50% CH4 with 50% CO2.
3. The temperature of combustion chamber was higher when the Methane was used, because the combustion chamber was originally designed to burn liquid fuel.
4. The temperature of the combustion chamber decreased with the
increasing mixing ratio of CO2 to CH4. When the MGT system was
changed to burn the gaseous fuel, the combustion chamber should be more heat-resistant.
5. If the rpm of compressor increased in between 40,000 and 85,000rpm, it brought more air to combustion chamber, and the temperature of turbine was cooled by this excess air.
6. The air should be removed from the lubricant pipe.
7. In the test, using 90% CH4 with 10% CO2 as fuel, the compressor
could reach 85,000 rpm while the fuel pressure reached the maximum of 12bar.
8. The supply pressure of lubricant should be increased with the rising of compressor speed.
9. The original fuel supply pipes in this study were too narrow to be able to reach the higher fuel supply rate.
5.1.2 MGT tests with generator
1. The choice of a generator that can fit the MGT was really important.
2. When low-heating-value fuel of 60% CH4 was applied, the power
output was extremely low because MGT’s rpm was too low to drive the generator.
3. C3H8 can be liquefied at around 5bar, so it cannot supply enough
pressure to provide more fuel under the presented MGT system to generate more power.
5.2 Future Works
1. The data acquirement facilities for the MGT system could be enhanced to gather more measurement data such as gas components of MGT’s exhaust and pressure in the combustor chamber.
encourage better performance of the MGT system.
3. The collected data could be used to identify the parameters of simulation model in control system.
4. The researcher also considered the possibilities of integrating the system with other renewable energy resources, such as wind and solar power.
5. Adding new fuel pipes from the fuel tank directly to the combustion chamber could achieve better fuel-efficiency.
Reference
[1]. Peirs J., R. Dominiek, and V. Filip, “Development of an Axial Microturbine for a Portable Gas Turbine Generator”, Journal of Micromechanics and Microengineering: 190-195, 2003.
[2]. J. Peirs et al., “A Micro Gas Turbine Unit for Electric Power Generation: Design and Testing of Turbine and Compressor” ACTUATOR 2004, 9th International Conference on New Actuators, 14-16 June 2004, Bremen, Germany
[3]. Wen, Wen-Lung, “Study of Microturbine Generator System Testing Technology”, NTHU, 2001.
[4]. Wang, Chun-Hao, “Performance Investigation of a Microturbine Generator Set”, NTHU, 2003.
[5]. Daisuke Yamashita et al., “Experimental Evaluation on Low-Heating Value Fuel Acceptability of Micro Gas Turbine System Operation”, The 16th International Symposium on Transport Phenomena, ISTP-16, pp. 1-7, Prague, 2005.
[6]. Kousuke Isomura et al., “Development of Micromachine Gas Turbine for Portable Power Generation”, JSME Internation Journal, Series B: Fluids and Thermal Engineering, V.47, N.3, pp. 459-464, Micro Mechanical Engineering, August, 2004.
[7]. Kousuke Isomura et al., “Experimental verification of the feasibility of a 100W class micro-scale gas turbine at an impeller diameter of 10mm” Ishikawajima-Harima Heavy Industries Co., Ltd, 2006
[8]. Kousuke Isomura et al., “Development of high-speed micro-gas bearings for three-dimensional micro-turbo machines”