行政院國家科學委員會專題研究計畫 成果報告
以平衡計分卡之觀點探討競爭策略對財務及非財務績效之
影響-以銀行業為研究對象(3/3)
研究成果報告(完整版)
計 畫 類 別 : 個別型 計 畫 編 號 : NSC 96-2416-H-004-001- 執 行 期 間 : 96 年 08 月 01 日至 97 年 07 月 31 日 執 行 單 位 : 國立政治大學會計學系 計 畫 主 持 人 : 吳安妮 計畫參與人員: 學士級-專任助理人員:劉景良 報 告 附 件 : 出席國際會議研究心得報告及發表論文 處 理 方 式 : 本計畫涉及專利或其他智慧財產權,2 年後可公開查詢中 華 民 國 97 年 10 月 16 日
Information Asymmetry, Bargaining Power and Customer Profitability:
An Empirical Investigation on Bank-Client Relationship
Anne Wu
Department of Accounting College of Commerce National Chengchi University
Taipei, Taiwan
Information Asymmetry, Bargaining Power and Customer Profitability:
An Empirical Investigation on Bank-Client Relationship
Abstract
The widely accepted business wisdom tells us that maintaining a long-term relationship with customers is more profitable than acquiring new customers, but very limited empirical evidence supports this viewpoint. The inconsistent findings in prior research suggest that some factors may influence the customer lifetime-profitability relationship. In this study, we develop and test a framework in which information asymmetry and bargaining power play important roles in the bank-client relationship. We find that although the price premium is associated with the degree of information asymmetry, the patterns how price premium changes over a bank-client relationship differ for customers with different levels of relative bargaining power. Specifically, the bank chooses a decreasing pricing strategy to retain its customer, but takes a more aggressive increasing strategy with a lower-than-equilibrium initial price to acquire large customers. However, the increasing pricing strategy, although helps acquire important customers, brings in a greater risk of loosing customers. The bank should strengthen its relationship with firms by cross-selling more products and services to “lock-in” its customers. This study reveals a more complex nature of customer profitability, which is influenced by information asymmetry between a bank and its clients, and bargaining power of clients.
Key Words: Customer profitability; Bank-firm relationship; Information asymmetry; Bargaining power; Loan pricing.
1. Introduction
The widely accepted business wisdom tells us that maintaining a long-term relationship with customers is more profitable than acquiring new customers, because loyal customers usually purchase more products but require less service. This argument is the spirit of customer relationship management (CRM), and has caused the thriving popularity of loyalty programs in this decade (Reinartz & Kumar, 2002). However, very limited empirical evidence supports this argument (Reichheld & Teal, 1996; Smith & Wright, 2004). On the contrary, some theoretical (e.g., Dowling & Uncles, 1997) and empirical (e.g., Reinartz & Kumar, 2000) findings show this link is questionable. The inconsistency among empirical findings suggests that previous research has not considered some important factors in the customer lifetime-profitability relationship.
Factors influencing the customer lifetime-profitability relationship may vary across industries. In this study, we examine the customer relationship in the banking industry for several reasons. First, bank-client relationship is one of the most prevailing contractual relationships in modern economies. It is crucial for banks in managing credit risk and maximizing profits. For borrowers, it influences not only the cost of capital but also their credibility in open capital markets. For example, Slovin et al. (1992) found that renewals and initiations of loan agreement generate positive share price effects. Second, banks and clients usually maintain a close relationship. This intimate relationship provides us a perfect setting to examine how those two parties maximize their benefits by negotiating with each other in a competitive environment.
Information asymmetry has long been considered an important factor in designing bank loan contracts. Prior research has a consistent view on the positive association between the degree of information asymmetry and loan interest rates. However, prior literatures do not have uniform view on how loan interest rates change along the duration of bank-client relationship. Some researchers (e.g., Petersen & Rajan, 1994; Berger and Udell, 1995) argued that the incumbent bank learns private information about its customers and therefore reduces the information asymmetry between lenders and borrowers. This reduced information asymmetry gives the “inside” bank a monopolistic power to set a lower price to deter its “outside” competitors. Another group of researchers (e.g., Greenbaum et al. 1989; Sharpe 1990), although using the same theory, proposed that a bank may use an lower-than-equilibrium initial price to acquire a new customers if the bank expects to earn positive profits from the monopolistic power in the future. The discrepancy between two strands of literatures implies that there should be factors other than information asymmetry influencing how price changes over customers’ tenure.
Research in economics and marketing suggests that customers’ relative bargaining power is crucial in determining the price (e.g., Roth, 2006) and service cost (e.g., Kwak et al., 2006). While a bank and its customers keep negotiating and renegotiating on terms of loan contracts, customers’ relative bargaining power plays an important role in the negotiating process and influences the bank’s pricing strategy. Therefore, in our model we considered customers’ relative bargaining power as the determinant of the patterns of price changes over the duration of a bank-client relationship.
We collected a customer level dataset from an industrial bank in Taiwan and empirically tested our hypotheses. This dataset contains monthly transactional data from 766 customers, including both publicly traded companies and non-public companies. The dataset spans 60 months, from 2001 to 2005. We did both cross sectional and time series analyses and find that the loan price is positively associated with the degree of information asymmetry, and the pattern how price premium changes is influenced by the level of customers’ relative bargaining power. The result implies that the bank considers both information asymmetry and bargaining power while negotiating the loan interest rate with its customers. More specifically, the bank takes a decreasing pricing strategy to retain its customers with lower bargaining power, but an even more aggressive pricing strategy with a lower-than-equilibrium initial price to attract customers with higher bargaining power and higher expected future profit.
While the servicing and monitoring costs decrease over time in all samples, the question whether the bank can extract more profits from its old customers depends on its pricing strategy. Our empirical results show that customers’ profitability increases over time for customers who pay increasingly higher price, but it is less significant for those whose price also decreases over time. Although an increasing pricing strategy brings in increasing customer profitability for the bank, it does not mean that banks should take this strategy without consideration. We found that the price increases more rapidly for customers who eventually left the bank and those customers who left had weaker connection with the bank. Our finding shows that customers are not price takers in the corporate loan market. The bank should strengthen its relationship with clients by cross-selling more products and services to “lock-in” its customers
This study contributes to academics and practitioners in several ways. First, our model uses firms’ relative bargaining power as the key determinant in the bank-client relationship, solving the discrepancy in prior finance literatures. The combination of marketing and finance literatures sheds light on complex nature of bank-client relationship, how banks choose pricing strategies and how customers react to banks’ pricing strategies. Second, there is a lack of empirical studies on bank-client relationship in prior literatures. This study provides valuable empirical evidence on how the duration of bank-client relationship influences price, servicing and monitoring costs, cross-selling and customer profitability. Third, our results contribute to marketing and managerial accounting literatures in revealing that old customers are not necessarily less price-sensitive or profitable. The value of customer relationship is far more complicated, so that researchers should consider important factors, such as information asymmetry and bargaining power in banking industry, while investigating this issue. Lastly, our study provides useful implications for both banks and borrowers. These implications would help banks to manage their loan portfolio in order to maximize profits, and help clients to reduce their cost of capital through developing relationship with banks.
The remainder of this paper is organized as follows. Section 2 reviews prior literatures and develops the research hypotheses. Section 3 describes the research site, sample, data, and methodology. Section 4 presents the empirical results. Section 5 summarizes the implications of results and then offers concluding comments.
2. Literature Review and Hypotheses Development
2.1 Information Asymmetry and Bank-Client Relationship
One of the most important value of financial intermediaries in modern economy is that they provide a better mechanism to monitor borrowers’ use of capital and thus reduce information asymmetry and potential moral hazard problems, although indirect financing is usually more costly than direct financing (Fama, 1985). This viewpoint implies that financial intermediaries play an important role in markets where adverse selection and moral hazard problems are severe (Fama, 1985; Berger and Udell, 1995). The private information obtained in loan relationships helps reduce information asymmetry between lenders and borrowers. It also creates a monopolistic power against outside competitors so that the incumbent bank can extract economic rents from the relationship (Sharpe, 1990; Rajan, 1992).
According to the theory, the level of the monopolistic power depends on the degree of information asymmetry between potential lenders and borrowers in that market segment (Dell’Ariccia and Marquez, 2004; Gorton and Kahn, 2000). Therefore, the higher information asymmetry in the market allows the bank to extract more economic rents from its monopolistic power over its clients. Dell’Ariccia and Marquez’s (2004) framework explains how banks allocate their loan portfolio in different market segments according to the degree of information asymmetry. Their model predicts a positive association between loan interest rate and the degree of information asymmetry in that market segment. This issue has also drawn accounting researchers’ attention recently. For example, Hughes et al.’s (2007) model shows a positive association between the degree of information asymmetry and companies’ cost of capital, which is consistent with
Dell’Arriccia and Marquez’s (2004) theoretical prediction. Therefore, we predict a positive association between the loan price premium and customers’ information asymmetry.
H1: The loan price premium is higher for clients with higher information asymmetry.
According to the asymmetric information theory, the incumbent bank becomes an “insider” and has chance to collect and generate private information about the borrowers. The private information not only reduces information asymmetry between the lender and the borrower, but also gives the incumbent bank an advantage over other “outside” competing lenders. This information monopoly power enables the incumbent bank to extract economic rents from its relationship with clients (Sharpe, 1990). One of the economic rents is the benefit of lower monitoring cost. The lower information asymmetry implies that lenders can spend less effort to monitor borrowers to prevent potential moral hazard behaviors (Fama, 1985; Sharpe, 1990). This reduced monitoring effort benefits the bank in terms of decreasing monitoring costs over the duration of the relationship.
H2: The Costs of monitoring and serving a customer decrease over the duration of bank-client relationship.
While the relationship develops, the incumbent bank has chance to learn more about its customers’ demand and thus be able to cross-sell more products and services to existing customers. Cross-selling benefits banks in three ways. First of all, cross-selling is
usually a more cost-efficient channel to expand banks’ business (e.g. Goran, 1995). Secondly, banks have more opportunity to obtain private information about customers via multiple business relationship. Moreover, the multiple business relationship raises existing customers’ switching costs, which give the incumbent bank more bargaining power over its customer (Porter, 1991). Lastly, banks usually require their customers maintain deposits, which is also called compensating balances. Compensating balances can effectively reduce the client’s moral hazard behaviors. Therefore, we predict a positive relation between the number of contracts and customer tenure.
H3: The number of contracts between the bank and its customer increases over the duration of relationship.
2.2 Bargaining Power and bank-client relationship
Asymmetric information theory tells us the incumbent bank can extract economic rents from the private information obtained from its clients. In a competitive market, however, the bank may share this economic rent with its clients in the form of lower interest rates to retain valuable customers. That is, the interest rate would decrease over the duration of bank-client relation (Petersen & Rajan, 1994; Berger and Udell, 1995). Interestingly, some other literatures (e.g., Greenbaum et al., 1989; Sharpe, 1990), presented conditions under which banks subsidize clients in early periods with lower-than-equilibrium initial interest rates, and are reimbursed in later periods. This contradiction suggests that banks may have different pricing strategies (that is, increasing vs. decreasing) for clients with different characteristics.
We propose that the decreasing price premium suggested by the first line of research represents the normal condition under which the price is a positive function of cost. This strategy keeps the profit margin in a reasonable range and thus helps the incumbent bank deter potential outside competitors who do not have private information about the clients. On the other hand, the second line of research represents special conditions under which the customer has large expected future value to the bank. These customers are usually large firms who have more bargaining power over the bank. The bargaining power enables the borrower to acquire a lower-than-equilibrium rate, but decreases alone the relationship because of increased switching cost (Porter, 1991). The price premium then returns to the equilibrium level. This theoretical proposition is supported by prior empirical findings. Snyder (1998) indicates that suppliers are usually keen to serve large buyers that they tend to underbid each other aggressively. This aggressive bidding strategy to acquire large customers is especially reasonable in the banking industry because the bank would expect more future economic rents from larger customers. The influence of bargaining power on banks’ pricing strategy is also discussed in Gorton and Kahn’s (2000) paper. They argued that the initial price of bank loans is not set to default premium, but to efficiently balance bargaining power in later renegotiation. These findings suggests that the increasing pricing strategy with a lower-than-equilibrium initial price proposed by Greenbaum et al. (1989) is more feasible in market segments where customers have greater bargaining power. Therefore, we predict:
H4: Price premium increases over customers’ tenure for customers with higher bargaining power, but decreases for those with lower bargaining power.
The question whether long-term customers are more profitable has been discussed in marketing research for decades. However, the empirical evidence on this issue mixed. Some prior literatures (e.g. Reichheld & Teal, 1996; Smith & Wright, 2004) support the positive profitability-tenure relation, but other literatures (e.g., Reinartz & Kumar, 2000) do not support this view. The discrepancy among literatures suggests the need to get a closer look at this issue. Reinartz & Kumar (2000) examine the two major components of customer profitability: the price and the cost. In this study, we take a similar perspective and disaggregate the profitability into three fundamental components: price (P), quantity (Q), and costs (C). The relationship among these components and profit is listed in equation (1).
Profit = P * Q – C (1)
Assuming profit, price, cost and quantity are functions of customer tenure (t), we can take the derivative of t on both sides and get equation (2).
∂ Profit / ∂ t = (∂ P / ∂ t) * Q + P * (∂ Q / ∂ t) – ∂ C / ∂ t (2)
From equation (2), we know that whether profit decrease or increase over time (i.e. the sign of ∂ Profit / ∂ t) depends on the sign and magnitude of the three factors: ∂ P
/ ∂ t, ∂ Q / ∂ t, and ∂ C / ∂ t. In the setting of this study, we predict ∂ C / ∂ t is negative
(H2) and ∂ Q / ∂ t is positive (H3). The sign of ∂ P / ∂ t depends on customer’s relative bargaining power, that is, ∂ P / ∂ t is positive for customers with high bargaining power but negative for others (H4). Therefore, the sign of ∂ Profit / ∂ t also depends on customer’s relative bargaining power. For customers with high bargaining power, ∂
Profit / ∂ t should be positive. The sign of ∂ Profit / ∂ t, however, is not clear ex ante
because we don’t know the relative magnitudes of (∂ P / ∂ t) * Q and P * (∂ Q / ∂ t).
H5: Customer profitability increases over customers’ tenure for customers with higher bargaining power. But the direction is not clear for customers with lower bargaining power.
3. Research Method
3.1 Research Site and Sample Selection
We obtained our research data from the corporate loan department of a leading industrial bank in Taiwan. The case bank implemented its activity-based costing (ABC) system in 2001 and has been using its ABC information to calculate individual customer’s cost and profit. The customer base consists of both publicly traded and non-public companies. This research site provides us a perfect setting to investigate our research questions.
Our data spans for 60 months, from January 2001 to December 2005. We collected monthly, customer-level cost and revenue data from 766 firms who had transactions with the bank in our research period. In our sample, 335 of them are publicly traded companies, while 431 of them are non-public companies. We excluded firms with transactions in only one month because of the limitation of panel data analysis.
3.2 Variables
Dependent Variables
Price Premium: Firms usually keep more than one loan contracts with banks. To
evaluate the price premium for each customer in each month, we need to calculate the weighted average interest rate for each firm-month. In this study, however, we can not obtain the information about loan amount for individual loan contract. Therefore, we used a proxy, calculated by dividing the interest revenue by corresponding cost of capital, to evaluate price premium. This proxy is valid because the cost of capital for a bank is constant among its loan contracts.
Cross Sell: We used the number of contracts to measure how effective the
company can cross sell its products to existing customers. The more contracts a customer maintained with the bank, the more successful the bank cross sold its products to customers.
Operating Cost: The case bank has implemented activity-based costing system in
2001 for the loan department. Therefore, we extracted operation-related costs per customer per month from the ABC system as one of our dependent variables.
Profitability: We used two variables to measure a customer’s profitability for the
bank: profit and profit rate. The profit from a customer includes all the revenues from that customer, deducting the corresponding capital costs, monitoring costs and servicing costs. Profit, although represents a customer’s value to the bank, sometimes are not controlled by the bank. For example, a firm’s demand on capital varies with it business life cycle and economics. Therefore, we used profit rate, calculated by dividing profit by revenue, to evaluate the bank’s rate of return from its capital.
Independent Variables
Tenure: We measure the length of relationship (i.e. tenure) of each customer by
measuring the length (in month) between the month in which the transaction occurred and the month the customer had its first transaction with the bank. However, because of the limitation of data availability, we used the month in which a customer’s transaction first occurred in the database as the first month the customer started its business relationship with the bank.
Information Asymmetry: In this study, we used public/non-public as a proxy to
divide our samples into low/high information asymmetry groups. This proxy is valid for several reasons. First, like those in US, publicly traded companies in Taiwan are required to disclose their financial and operational information each quarter. The publicly available information increases the transparencies of these companies’ financial situation and thus hugely reduces the information asymmetry between the borrowers and lenders. Second, TEJ, an independent credit rating institution, evaluates and publishes a credit rating score for each publicly traded company each month. This mechanism provides an objective and independent evaluation on borrowers’ default risk, and further reduces the information asymmetry. On the other hand, there is neither financial information nor credit rating available for non-public companies.
Bargaining Power: Customers who bring in more revenue are usually more
important to the bank. They may have greater bargaining power while negotiating on contracts because the bank wants to keep these important customers (usually called key accounts). We used the median of average revenue per month to separate our samples
into two groups: firms with higher average revenue are those have greater bargaining power, and others are customers with lower bargaining power.
3.3 Estimation Models
We have multiple objectives in this research. First of all, we want to examine how information asymmetry and bargaining power influence customers’ profitability in the banking industry. Second, we want to investigate how customers’ profitability changes over customers’ lifetime and, more importantly, how information asymmetry and bargaining power influence this customer lifetime-profitability relationship. Therefore, we used both cross-sectional and time-series analyses to test our research hypotheses.
Cross Sectional Analysis
We first divided the customer base into four subgroups by information asymmetry and bargaining power. Then, in the cross sectional analysis, we used one-way ANOVA to examine whether price premium, cross sell and customer profitability are significantly different in the four subgroups.
Time Series Analysis
In the time series analysis, our purpose is to examine how customers’ tenure influences customers’ profitability. However, many client-specific characteristics, such as client size, industry and risk, may be associated with both the dependent and independent variables. Moreover, some of the characteristics such as client risk are unobservable and thus are difficult to be estimated. To control the correlated omitted variable problem,
Stock and Watson (2007, p.356) suggest that “fixed effects regression is a method for controlling for omitted variables in panel data when the omitted variables vary across entities but do not change over time”. The client-specific characteristics are relatively stable over time, especially our sample period spans only five years. Therefore, we used fixed effects regression models to control the impact from client-specific variables. We use the regression model listed below.
Price Premium i,t = β0 + β1 Tenure i,t + β2 Tenure Square i,t + γ2 D2i+…+ γn Dni+ ε i,t
i=1,2,…n; t=1,2,3,…,60
D2i=1 if i=2 and D2i=0 other wise, and so forth.
In the model, the dependent variable can be replaced by cross sell, operating cost, profit and profit rate, according to our research questions. The parameter estimation of
Tenure, β1,is what we are most interested in. Tenure Square is commonly seen in labor
economic research. We used this variable to examine whether the customer lifetime-profitability relationship is a linear or a curvilinear curve. Dummy variables D2…Dn are used typical in fixed effects panel data analyses to control variance from differences between subjects.
4. Results
4.1 Descriptive Statistics
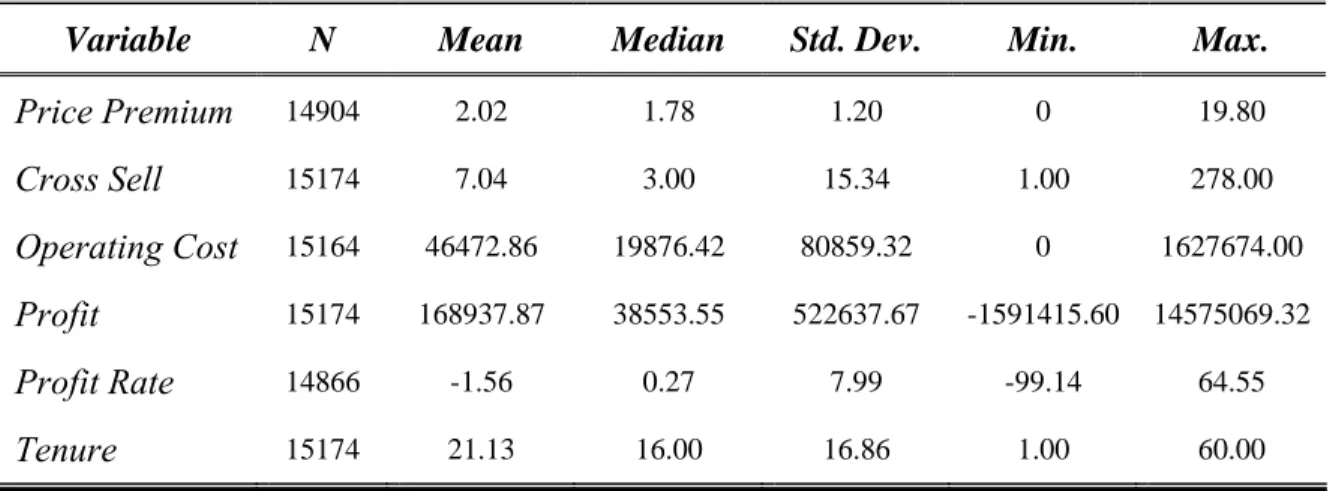
Table 1 presents descriptive statistics for the data. For these variables, there is considerable variance in the dataset as assessed by the variables’ standard deviation. The average customer tenure in our sample is 21.13 and the average number of cross sell is
7.04. The average profit per customer per month is 168937.87 NTD (roughly 5000 USD), but the average profit rate is -1.56. This implies that the 80/20 rule in the distribution of customer profitability: although the bank is making money, most of its customers are unprofitable.
--- Insert Table 1 here
---
Table 2 provides Pearson correlations among our independent and dependent variables. The result shows customer tenure is significantly correlated to all dependent variables in our models.
--- Insert Table 2 here
--- 4.2 Empirical Results
4.2.1 Cross Sectional Analysis
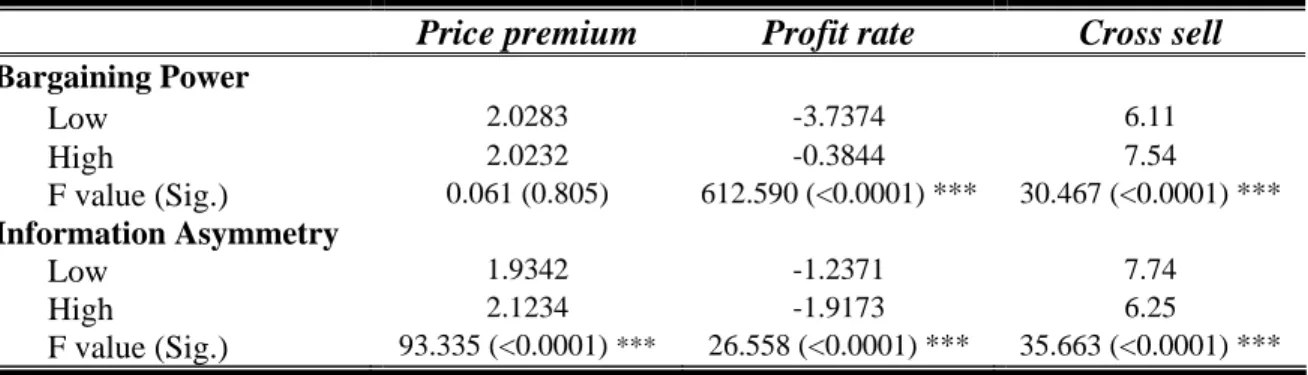
We used One-way ANOVA to examine how the level of borrowers’ information asymmetry and relative bargaining power influence the loan interest rate, the number of cross-sell to the customer and customer’s profitability to the bank. In Table 3 Panel A, the results reveal that both information asymmetry and bargaining power are important determinants on profit rate and the amount of cross sell, but the price premium is only related to the degree of information asymmetry. The result supports our hypothesis H1.
--- Insert Table 3 Panel A here
This interpretation, however, might not be accurate if bargaining power and information asymmetry are not independent. Therefore, we further controlled one variable and see whether the result will be different. The first column in Table 3 Panel B shows the price premium is indeed positively associated with the level of information asymmetry. However, the second column in Panel B indicates that bargaining power is more relevant to customers’ profitability than information asymmetry is.
--- Insert Table 3 Panel B here --- 4.2.2 Time Series Analysis
In time series analyses, we examine whether long-term customers are more valuable to banks and how customers’ information asymmetry and bargaining power influence the bank-borrower relationship.
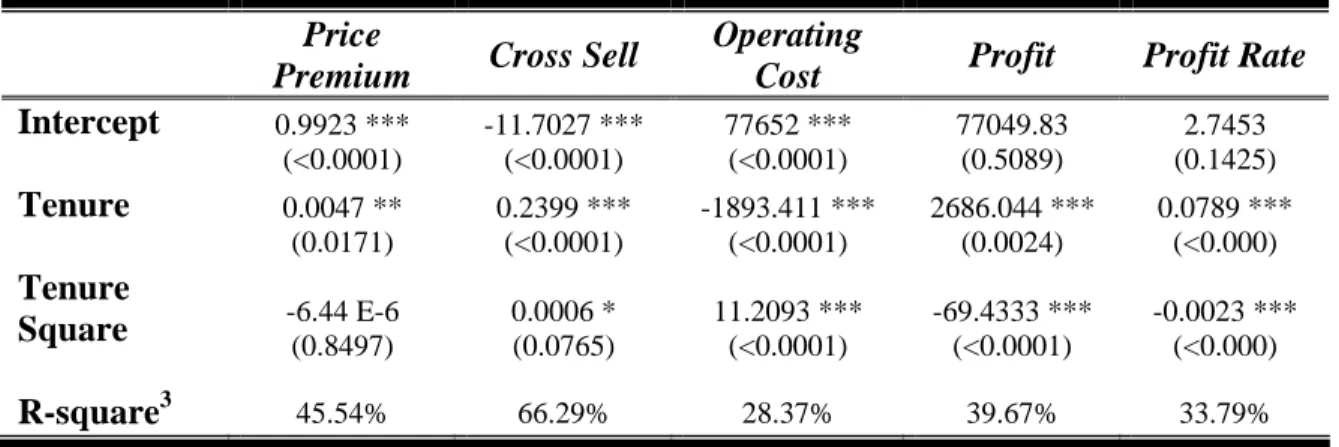
Table 4 shows the results how customer-related variables change over customer’s tenure. Panel A, which includes all sample in the regression, shows price premium, cross sell and profit rate increase significantly over time, while operating cost decreases over customer tenure. These results support our hypotheses H2 and H3.
--- Insert Table 4 Panel A here ---
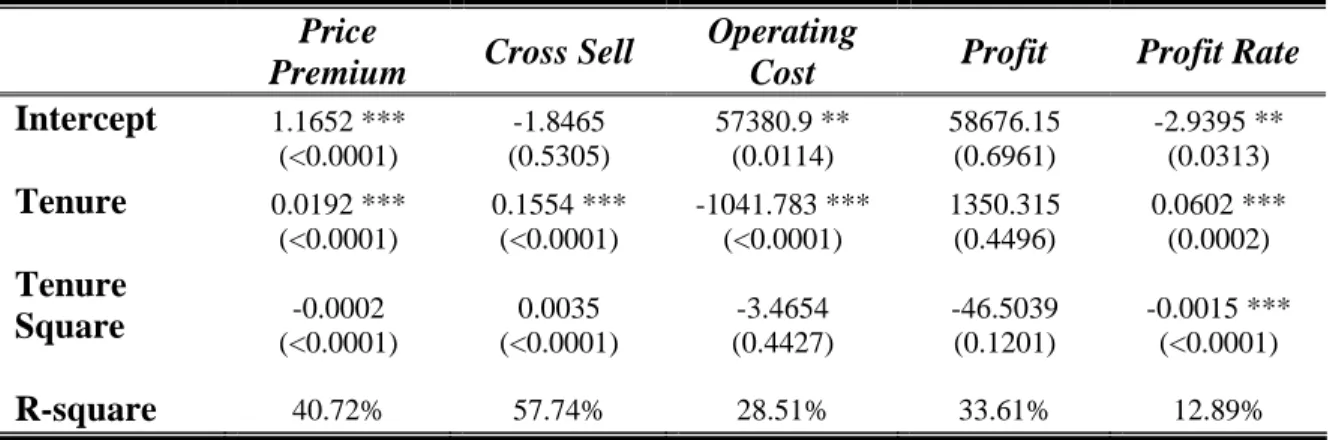
We further divided our samples into four groups by bargaining power and information asymmetry, as we did in previous analysis, to investigate how these two factors influence the pattern of changes. Table 4 Panel B shows the regression results of the four subgroups. The results from the four subgroups are roughly consistent with those from all-sample analysis.
However, interestingly, we found that the level of customers’ bargaining power does have significant effect on the patterns how price premium changes over time. Taken results from the four subgroup together, customer tenure is significantly (p<0.001), positively associated with price premium in high bargaining power group but is significantly (p<0.001) negatively associated with price premium in low bargaining power groups. This result gives support to our hypothesis H4.
The last column in Table 4 Panel B shows customer’s profit rate is positively associated with customer’s tenure for customers with large bargaining power, but the association is less significant for those with low bargaining power. Hypothesis H5 is supported.
--- Insert Table 4 Panel B here ---
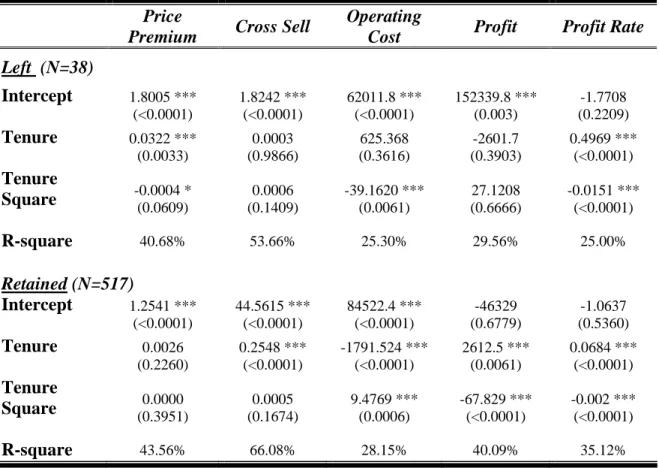
4.2.3 Additional Analysis- Pricing strategy and customer retention
In previous section we found that the pattern how loan interest rate changes over customer tenure depends on customer’s bargaining power. This result implies that the bank set up a lower-than-average initial interest rate to attract customers who have huge
demand on capital. However, in a competitive market, this pricing strategy causes the bank a risk that the longer a borrower stays with the bank, the greater probability the customer will seek another lender with a lower initial loan rate. (Greenbaum et al., 1989).
In Table 5, we found that the price premium for customers who left significantly increases (p<0.001) over customers tenure, while that for retained customers does not change significantly. On the other hand, the second column shows that the bank could not cross sell more services or products to those customers who eventually left. Also, the longer stay of retained customers creates more profitability of the bank. These results imply that the increasing loan rate and weak business connection are key factors contributing to customer loss.
--- Insert Table 5 here
---
5. Conclusion
We collected customer-level data from an industrial bank and empirically examined how price premium, cross-selling, operating costs and customer profitability changes over the duration of a bank-firm relationship. The empirical results show that although the price premium is positively associated with the degree of information asymmetry between borrowers’ and potential lenders, the pattern how price premium changes over a bank-client relationship differs for customers with different levels of bargaining power. This finding implies that a bank may choose different pricing strategies according to the level of its customers or potential customers’ bargaining power.
More specifically, a bank may take a decreasing pricing pattern to retain its existing customers. This strategy is fueled by the private information collected by the incumbent bank, so that it can enjoy lower risk cost and monitoring cost than its competitors. The bank may also take an increasing pricing strategy but with a much lower initial price to acquire customers with large bargaining power and future revenue. Moreover, the bank’s choices on pricing strategies also effects how the customer profitability changes over time.
Interestingly, we observed that the increasing pricing strategies, although helps acquire important customers, brings in a greater risk of loosing customers. This finding suggests that customers are not price takers in the corporate loan market. On the other hand, the bank should strengthen its relationship with clients by cross-selling more products and services to “lock-in” its customers. Greenbaum et al.’s (1989) model shows that wile interest rate increases over customers’ tenure, it also raises the probability that customers switch to new lenders who offer lower prices. We found that the price increases more rapidly for customers who eventually left the bank. We also found that those customers who left had weaker connection with the bank. These findings support Greenbaum et al.’s prediction.
This study has several limitations that warrant acknowledgement. First of all, a major limitation is the omitted risk cost in the calculation of customer profitability. Risk cost is one of the crucial factors in banks’ operations, but we can hardly evaluate or acquire a trustworthy risk cost for each individual customer. Second, the measures used to proxy information asymmetry and bargaining power may contain noises which potentially bias our results and reduce the construct validity. Future research can improve
by employing better estimations for these constructs. Another limitation comes from the field research method, which may reduce the generalizability of our findings to other settings.
Although we are motivated by discrepancies in prior marketing and finance literatures, we are not trying to give a sweeping conclusion on the customer lifetime-profitability that fits into every industry and company. Instead, our findings suggest a more complex nature of customer profitability, which is influenced by information asymmetry between a bank and its clients and bargaining power of clients. Ignoring any of them would result in an oversimplified conclusion. Our study provides a good example that the customer lifetime-profitability relationship may varies hugely even in the same bank, because it chooses its strategies according to the competition in different market segments. It is a promising avenue for future research to explore the effect of market competition and strategic choices on customer profitability in different settings.
References
Berger, A., and G. Udell. 1995. Relationship lending and lines of credit in small firm finance. Journal of Business 68 (3): 351-381.
Dell’Arriccia, G., and R. Marquez. 2004. Information and bank credit allocation. Journal
of Financial Economics 72: 185-214.
Dowling, G., and M. Uncles. 1997. Do customer loyalty programs really work? Sloan
Management Review 38: 71-82.
Fama, E. 1985. What’s different abut banks? Journal of Monetary Economics, 15: 29-39. Gorton, G. and J. Kahn. 2000. The design of bank loan contracts. The Review of
Financial Studies 13 (2): 331-364.
Goran, B. 1995. The profitability of bancassurance for European banks. The International
Journal of Bank Marketing 13 (1): 17-28.
Greenbaum, S., G. Kanatas, and I. Vnezia. 1989. Equilibrium loan pricing under the bank-client relationship. Journal of Banking and Finance 13: 221-235.
Hughes, J., J. Liu, and J. Liu. 2007. Information Asymmetry, Diversification, and Cost of Capital. The Accounting Review 82 (3): 705-729.
Kwak, T., Kim, J., and Moon, C. 2006. Supplier-buyer models for the bargaining process over a long-term replenishment contract. Computer and Industrial Engineering 51: 219-228.
Petersen, M., and R. Rajan. 1994. The benefits of lending relationships: evidence from small business data. The Journal of Finance 49 (1): 3-37.
Porter, M. 1991. Towards a dynamic theory of strategy. Strategic Management Journal 12: 95-117.
Rajan, R. 1992. Insiders and outsiders: the choice between informed and arm’s-length debt. The Journal of Finance 47 (4): 1367-1399.
Reichheld, F. and T. Teal. 1996. The Loyalty Effect. Boston: Harvard Business School Press.
Reinartz, W. and V. Kumar. 2000. On the Profitability of Long-Life Customers in a Noncontractual Setting: An Empirical Investigation and Implications for Marketing. Journal of Marketing 64(4): 17-35.
Reinartz, W. and V. Kumar. 2002. The mismanagement of customer loyalty. Harvard
Business Review 80(7): 86-94.
Roth, S. 2006. Negotiating prices for customized service. Journal of Service Research 8(4): 316-329.
Sharpe, S., 1990. Asymmetric Information, Bank Lending, and Implicit Contracts: A Stylized Model of Customer Relationships. Journal of Finance, 45(4): 1069-1087.
Slovin, M., S. Johnson, and J. Glascock. 1992. Firm size and the information content of bank loan announcements. Journal of Banking and Finance 16: 1057-1071. Smith, R. and W. Wright. 2004. Determinants of customer loyalty and financial
performance. Journal of Management Accounting Research 6: 183-205.
Snyder, C. 1998. Why do larger buyers pay lower prices? Intense supplier competition.
Economics Letters 58: 205-209.
Table 1: Descriptive Statistics
Variable N Mean Median Std. Dev. Min. Max.
Price Premium 14904 2.02 1.78 1.20 0 19.80 Cross Sell 15174 7.04 3.00 15.34 1.00 278.00 Operating Cost 15164 46472.86 19876.42 80859.32 0 1627674.00 Profit 15174 168937.87 38553.55 522637.67 -1591415.60 14575069.32 Profit Rate 14866 -1.56 0.27 7.99 -99.14 64.55 Tenure 15174 21.13 16.00 16.86 1.00 60.00 Note: Variable Measurements:
Price Premium= interest revenue divided by cost of capital; Cross Sell= the number of contracts a customer has with the bank;
Operating Cost= costs related to a customer, including monitoring and servicing costs; Profit= all the revenues from a customer minus corresponding costs;
Profit Rate= profit divided by revenue;
Tenure= months a firm has been a customer of the case bank.
Table 2: Pearson Correlations
Price
Premium Cross Sell
Operating Cost Profit Profit Rate Tenure Price Premium 1.000 Cross Sell 0.012 1.000 Operating Cost 0.011 0.091 *** 1.000 Profit 0.102 *** -0.017 ** 0.235 *** 1.000 Profit Rate 0.067 *** 0.059 *** -0.076 *** 0.129 *** 1.000 Tenure -0.067 *** 0.141 *** -0.054 *** 0.090 *** -0.024 *** 1.000 Note:
Significance levels: * p<0.10, ** p<0.05, and *** p<0.01 (two-tail test). See Table 1 for how variables are measured.
Table 3: Results for One-Way ANOVA analyses
Panel A: One Way ANOVA analysis for all samples
Price premium Profit rate Cross sell
Bargaining Power Low 2.0283 -3.7374 6.11 High 2.0232 -0.3844 7.54 F value (Sig.) 0.061 (0.805) 612.590 (<0.0001) *** 30.467 (<0.0001) *** Information Asymmetry Low 1.9342 -1.2371 7.74 High 2.1234 -1.9173 6.25 F value (Sig.) 93.335 (<0.0001) *** 26.558 (<0.0001) *** 35.663 (<0.0001) *** Note:
Significance levels: * means p<0.1, ** means p<0.05, *** means p<0.01; See Table 1 for variable definitions.
Panel B: One Way ANOVA analysis, grouped by information asymmetry and bargaining power
Price premium Profit rate Cross sell
Low Bargaining Power
Low Info. Asymmetry 1.9379 -3.2880 6.57 High Info. Asymmetry 2.0987 -4.1079 5.73
F value (Sig.) 20.091 (<0.0001) *** 6.963 (0.008) *** 6.402 (0.011) **
High Bargaining Power
Low Info. Asymmetry 1.9326 -0.3588 8.26 High Info. Asymmetry 2.1405 -0.4182 6.62
F value (Sig.) 78.659 (<0.0001) *** 0.295 (0.587) 22.885 (<0.0001) ***
Low Info. Asymmetry
Low Bargaining Power 1.9379 -3.2880 6.57 High Bargaining Power 1.9326 -0.3588 8.26
F value (Sig.) 0.034 (0.853) 268.75 (<0.0001) *** 20.835 (<0.0001) ***
High Info. Asymmetry
Low Bargaining Power 2.0987 -4.1079 5.73 High Bargaining Power 2.1405 -0.4182 6.62
F value (Sig.) 1.937 (0.164) 317.69 (<0.0001) *** 5.75 (0.017) ** Note:
Significance levels: * means p<0.1, ** means p<0.05, *** means p<0.01; See Table 1 for variable definitions.
Table 4: Fix effects panel data analysis
Price Premium1i,t = β0 + β1 Tenure i,t + β2 Tenure Square i,t + γ2 D2i+…+ γn Dni+ ε i,t
i=1,2,…n; t=1,2,3,…,60
D2i=1 if i=2 and D2i=0 other wise, and so forth.
Panel A: Fixed effects panel data analysis for all samples Price
Premium Cross Sell
Operating
Cost Profit Profit Rate Intercept 0.9923 *** (<0.0001) -11.7027 *** (<0.0001) 77652 *** (<0.0001) 77049.83 (0.5089) 2.7453 (0.1425) Tenure 0.0047 ** (0.0171) 0.2399 *** (<0.0001) -1893.411 *** (<0.0001) 2686.044 *** (0.0024) 0.0789 *** (<0.000) Tenure Square -6.44 E-6 (0.8497) 0.0006 * (0.0765) 11.2093 *** (<0.0001) -69.4333 *** (<0.0001) -0.0023 *** (<0.000) R-square3 45.54% 66.29% 28.37% 39.67% 33.79%
Number of cross sections: 766 Time series length: 60
Note:
1. The dependent variable should be replaced by cross sell, operating cost or profitability in other models. 2. Significance levels: * means p<0.1, ** means p<0.05, *** means p<0.01
3. The explanation power (R-square) comes not only from the major independent variables but also from dummy variables representing cross sectional groups (e.g. 765 dummy variables for 766 customers in this case).
Table 4: Fix effects panel data analysis (continued)
Panel B: Fix effects panel data analysis- by bargaining power and information asymmetry 1. Low bargaining power, low information asymmetry
Price
Premium Cross Sell
Operating
Cost Profit Profit Rate Intercept 2.7971 *** (<0.0001) 5.7429 *** (0.0014) 49276.5 *** (0.0009) -3876.31 (0.8112) -2.1545 (0.3225) Tenure -0.0399 *** (<0.0001) 0.3515 *** (<0.0001) -3557.07 *** (<0.0001) 2977.344 *** (<0.0001) 0.3081 *** (<0.0001) Tenure Square 0.0003 *** (0.0011) -0.0028 *** (0.0009) 35.4921 *** (<0.0001) -43.6553 *** (<0.0001) -0.0093 *** (<0.0001) R-square 45.15% 68.53% 18.64% 15.53% 29.84%
Number of cross sections: 144 Time series length: 59
Note:
Significance levels: * means p<0.1, ** means p<0.05, *** means p<0.01; See Table 1 for variable definitions.
2. Low bargaining power, high information asymmetry Price
Premium Cross Sell
Operating
Cost Profit Profit Rate Intercept 1.7675 ** (0.0126) -1.3365 (0.6758) 50875.4 (0.1877) -38283.5 (0.4797) 3.0707 (0.6383) Tenure -0.0368 *** (<0.0001) 0.2672 *** (<0.0001) -3449.618 *** (<0.0001) 1994.988 *** (<0.0001) -0.03429 (0.4874) Tenure Square 0.0004 *** (<0.0001) -0.0035 *** (<0.0001) 45.324 *** (<0.0001) -24.2064 *** (0.0026) -0.0004 (0.7279) R-square 53.15% 85.1% 23.1% 14.07% 43.14%
Number of cross sections: 219 Time series length: 60
Note:
Significance levels: * means p<0.1, ** means p<0.05, *** means p<0.01; See Table 1 for variable definitions.
Table 4: Fix effects panel data analysis (continued)
Panel B: Fix effects panel data analysis- by bargaining power and information asymmetry (continued)
3. High bargaining power, low information asymmetry Price
Premium Cross Sell
Operating
Cost Profit Profit Rate Intercept 1.1652 *** (<0.0001) -1.8465 (0.5305) 57380.9 ** (0.0114) 58676.15 (0.6961) -2.9395 ** (0.0313) Tenure 0.0192 *** (<0.0001) 0.1554 *** (<0.0001) -1041.783 *** (<0.0001) 1350.315 (0.4496) 0.0602 *** (0.0002) Tenure Square -0.0002 (<0.0001) 0.0035 (<0.0001) -3.4654 (0.4427) -46.5039 (0.1201) -0.0015 *** (<0.0001) R-square 40.72% 57.74% 28.51% 33.61% 12.89%
Number of cross sections: 191 Time series length: 60
Note:
Significance levels: * means p<0.1, ** means p<0.05, *** means p<0.01; See Table 1 for variable definitions.
4. High bargaining power, high information asymmetry Price
Premium Cross Sell
Operating
Cost Profit Profit Rate Intercept 0.4667 * (0.0532) -6.4393 ** (0.0222) 67854 *** (0.0005) 131745.7 (0.3324) 3.1267 ** (0.0339) Tenure 0.0380 *** (<0.0001) 0.3939 *** (<0.0001) -1438.916 *** (<0.0001) 4125.989 ** (0.0313) 0.1136 *** (<0.0001) Tenure Square -0.0004 *** (<0.0001) -0.0039 *** (<0.0001) (0.1899) 6.2079 -113.491 *** (0.0007) -0.00305 *** (<0.0001) R-square 49.83% 71.29% 24.31% 40.24% 23.56%
Number of cross sections: 212 Time series length: 60
Note:
Significance levels: * means p<0.1, ** means p<0.05, *** means p<0.01; See Table 1 for variable definitions.
Table 5: Customer variables analysis: “Left” versus “Retained”
Price
Premium Cross Sell
Operating
Cost Profit Profit Rate Left (N=38) Intercept 1.8005 *** (<0.0001) 1.8242 *** (<0.0001) 62011.8 *** (<0.0001) 152339.8 *** (0.003) -1.7708 (0.2209) Tenure 0.0322 *** (0.0033) 0.0003 (0.9866) 625.368 (0.3616) -2601.7 (0.3903) 0.4969 *** (<0.0001) Tenure Square -0.0004 * (0.0609) (0.1409) 0.0006 -39.1620 *** (0.0061) (0.6666) 27.1208 -0.0151 *** (<0.0001) R-square 40.68% 53.66% 25.30% 29.56% 25.00% Retained (N=517) Intercept 1.2541 *** (<0.0001) 44.5615 *** (<0.0001) 84522.4 *** (<0.0001) -46329 (0.6779) -1.0637 (0.5360) Tenure 0.0026 (0.2260) 0.2548 *** (<0.0001) -1791.524 *** (<0.0001) 2612.5 *** (0.0061) 0.0684 *** (<0.0001) Tenure Square (0.3951) 0.0000 (0.1674) 0.0005 9.4769 *** (0.0006) -67.829 *** (<0.0001) -0.002 *** (<0.0001) R-square 43.56% 66.08% 28.15% 40.09% 35.12% Note:
Significance levels: * means p<0.1, ** means p<0.05, *** means p<0.01; See Table 1 for variable definitions;
We omitted customers who have relationship with the bank less than 12 months, because customer retention is meaningless for new customers (Tenure<12).