current BCI systems are usually large and have to transmit an EEG signal to a back-end personal computer to process the EEG signal. In this study, a novel BCI system was developed to monitor the human cognitive state and provide biofeedback to the driver when drowsy state occurs. The proposed system consists of a wireless physiological signal-acquisition module and an embedded signal-processing module. Here, the physiological signal-acqui-sition module and embedded signal-processing module were designed for long-term EEG monitoring and real-time drowsiness detection, respectively. The advantages of low ower consumption and small volume of the proposed system are suitable for car appli-cations. Moreover, a real-time drowsiness detection algorithm was also developed and implemented in this system. The experiment results demonstrated the feasibility of our proposed BCI system in a practical driving application.
Index Terms—Drowsiness detection, electroencephalogram (EEG), brain–computer interface (BCI).
I. INTRODUCTION
D
RIVERS’ drowsiness has been implicated as a causal factor in many accidents because of the marked decline in drivers’ perception of risk and recognition of danger, and diminished vehicle-handling abilities [1]–[5]. In 2002, the National Highway Traffic Safety Administration (NHTSA) reported that about 0.7% of drivers had been involved in a crash that they attribute to drowsy driving, amounting to an estimated 800 000 to 1.88 million drivers in the past five years [6]. The National Sleep Foundation (NSF) also reported that 51% of adult drivers had driven a vehicle while feeling drowsy and 17% had actually fallen asleep [7]. Therefore, real-time drowsiness monitoring is important to avoid traffic accidents.Manuscript received December 16, 2009; revised March 04, 2010. First pub-lished April 29, 2010; current version pubpub-lished July 28, 2010. This work was supported by the National Science Council and the Ministry of Economic Af-fairs under Grants 98-2220-E-009-039 and 98-EC-17-A-19-S2-0052, respec-tively. This paper was recommended by Associate Editor D. Cumming.
C.-T. Lin and B.-S. Lin are with the Brain Research Center and the Institute of Imaging and Biomedical Photonics, National Chiao Tung University, Taiwan 71150 (e-mail: [email protected]).
C.-J. Chang, S.-H. Hung, and C.-F. Chao are with the Department of Elec-trical Engineering, National Chiao Tung University, Taiwan 30010.
I.-J. Wang is with the Department of Computer Science, National Chiao Tung University, Taiwan 30010.
Color versions of one or more of the figures in this paper are available online at http://ieeexplore.ieee.org.
Digital Object Identifier 10.1109/TBCAS.2010.2046415
The movement of the driver’s body is detected by direct sensor contacts or video cameras. Since these techniques allow non-contact detection of drowsiness, they do not give the driver any discomfort. This will increase the driver’s acceptance of using these techniques to monitor drowsiness. However, these param-eters easily vary in different vehicle types and driving condi-tions. The second approach focuses on measuring physiolog-ical changes of drivers, such as eye activity measures, heart beat rate, skin electric potential, and electroencephalographic (EEG) activities [13]–[28]. Stern et al. [13] reported that the eye blink duration and blink rate typically are sensitive to fa-tigue effects. Van Orden et al. [14] further compared the eye-ac-tivity-based methods to EEG-based methods for alertness esti-mates in a compensatory visual tracking task. It also indicated that the EEG-based method can use a shorter moving-averaged window to track second-to-second fluctuations in the subject performance in a visual compensatory task.
In this study, we proposed a real-time wireless EEG-based brain–computer interface (BCI) system for drowsiness detec-tion. There are some studies regarding the portable BCI devices [29]–[32]. However, these systems are usually large and have to transmit an EEG signal to a back-end personal computer to process the EEG signal. Therefore, we developed a novel BCI system which contains the advantages of small volume and low-power consumption, and is suitable for practical driving appli-cations. The proposed BCI system consists of a wireless physio-logical signal-acquisition module and an embedded signal-pro-cessing module. Here, the wireless physiological signal-acqui-sition module is used to collect EEG signals and transmit them to the embedded signal-processing module wirelessly. It can be embedded into a headband as a wearable EEG device for long-term EEG monitoring in daily life. The embedded signal-processing module, which provides powerful computations and supports various peripheral interfaces, is used to real-time de-tect drowsiness and trigger a warning tone to prevent traffic ac-cidents when drowsy state occurs.
In this study, a real-time drowsiness detection algorithm was also developed. Most of the previous studies for EEG-based drowsiness detection are supervised in nature and build up the same detection model for all subjects [15]–[17]. However, it is well known that the individual variability in EEG dynamics re-lating to drowsiness from alertness is large. The same detec-tion model may not be effective to accurately predict subjec-1932-4545/$26.00 © 2010 IEEE
Fig. 1. Basic scheme of our proposed EEG-based BCI system.
tive changes in the cognitive state. Therefore, subject-dependent models have also been developed to account for individual vari-ability [18]–[21]. Although subject-dependent models can alle-viate the influence of individual variability in EEG spectra, they still cannot account for the cross-session variability in EEG dy-namics due to various factors, such as electrode displacements, environmental noises, skin-electrode impedance, and baseline EEG differences. In our previous study [23], we proposed an un-supervised subject- and session- independent approach for de-tection departure from alertness. Under the assumption that the EEG power spectrum in an alert state can be reasonably mod-eled using a multivariate normal distribution, a statistical model of subject’s alert state would be generated in every session by using very limited data obtained at the beginning of the session. The model was validated statistically and then used to assess the cognitive state for different subjects effectively. Based on this unsupervised approach, the real-time drowsiness detection algorithm was developed and implemented in our BCI system.
This paper was organized as follows. The system architec-ture of our proposed BCI system was illustrated in Section II. The real-time drowsiness detection algorithm was introduced in Section III. The comparison between our BCI system and other BCI system, and the reliability of our system for drowsiness de-tection were investigated in Section IV. In Section V, the con-clusion was drawn.
II. SYSTEMARCHITECTURE
The basic scheme of our proposed EEG-based BCI system was shown in Fig. 1. The system hardware consists of a wire-less physiological signal-acquisition module and an embedded signal-processing module. First, the EEG signal will be obtained by the EEG electrode, and then amplified and filtered by the EEG amplifier and acquisition unit in the physiological acquisi-tion module. Next, the EEG signal will be preprocessed by the microprocessor unit and transmitted to the embedded signal-processing module via a wireless transmission unit. After re-ceiving the EEG signal, it will be monitored and analyzed by our drowsiness detection algorithm implemented in an embedded signal-processing unit. If the drowsy state of the driver is de-tected, a warning tone device unit will be triggered to alarm the driver.
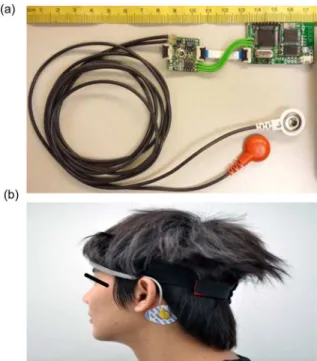
Fig. 2. Photographs of (a) our wireless physiological signal-acquisition module and (b) EEG headband embedded with this module.
A. Wireless Physiological Signal-Acquisition Module
The wireless physiological signal-acquisition module mainly consists of the EEG amplifier and acquisition unit, micropro-cessor unit, and wireless transmission unit. Here, the EEG am-plifier and acquisition unit, which includes a preamam-plifier, a band-pass filter, and an analog-to-digital converter (ADC), was designed to amplify and filter the EEG signal. The gain of the EEG amplifier and acquisition unit was set to about 5040 times with the frequency band of 0.1–100 Hz. Next, the amplified and filtered EEG signal will be digitized by a 12-b analog-to-dig-ital converter (ADC) with a sampling rate of 512 Hz. The mi-croprocessor unit (TI MSP430), which contains the advantages of ultra-low power consumption, 16-b reduced instruction set computing (RISC) architecture, 125-ns instruction cycle time, five power-saving modes, and the diversification of a periph-eral communication interface, is used to control the ADC to ob-tain, preprocess, and send EEG data to the wireless transmis-sion unit. In the microprocessor unit, EEG data caught from the ADC via a serial peripheral interface will be stored into the memory of the microprocessor unit, and then will pass through a moving average filter to remove power-line interference be-fore wireless transmission. Here, the Bluetooth module is used as the wireless transmission unit. The firmware of the Bluetooth module is fully compliant with the Bluetooth v2.0 EDR speci-fication. Since the Bluetooth module operates at high-frequency band to transmit data wirelessly, it can work perfectly by using a printed-circuit board (PCB) antenna. The size of the wire-less physiological signal-acquisition module is about 4 cm 2.5 cm 0.6 cm, and can be embedded into a headband as a wear-able device, as shown in Fig. 2. This module operates at 31 mA with 3.7-V DC power supply, and can continuously operate over 33 h with a commercial 1100-mAh Li-Ion battery.
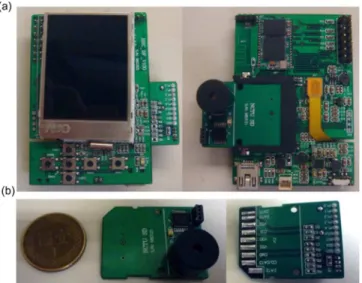
The embedded signal-processing module was designed as a platform which performs a real-time EEG-based drowsiness detection algorithm. It contains powerful computations and can support various peripheral interfaces. The embedded module mainly consists of an embedded signal-processing unit, a wireless transmission unit, and a warning tone device unit. The received EEG data will be real time processed, analyzed, and displayed by the embedded signal-processing unit. When the drowsy state is detected, the warning tone device unit will be triggered to alarm the driver. The block diagram of the embedded signal-processing unit was shown in Fig. 3. The Blackfin embedded processor (ADSP-BF533) is used in the embedded signal processing unit. The central-processing-unit (CPU) speed of the embedded processor can be up to 600 MHz. The embedded processor contains two 16-b multiply and accu-mulates (MACs) to execute 1200 lines of addition and multipli-cation functions, and contains four independent direct memory accesses (DMAs) to effectively reduce the processing time of the core. A memory-mapped thin-film transistor liquid-crystal display (TFT-LCD) is used in this module, and shared the same memory bus with synchronous dynamic random-access memory (SDRAM). In order to reduce the module size, the parallel NOR flash is replaced by the serial peripheral interface (SPI) flash. Furthermore, this module also contains power management and charging circuits. The embedded processor uses a universal asynchronous receiver/transmitter (UART) interface to communicate with the wireless transmission unit. The warning tone device unit was designed in an expanded secure digital (SD) memory card, and can be combined with the embedded signal-processing unit via secure digital/multimedia card (SD/MMC) socket. Therefore, the SD/MMC socket in this module also provides good interface scalability. The size of the embedded signal-processing module is about 6.4 cm 4.4 cm 1 cm, as shown in Fig. 4. This module also operates with a 3.7-V DC power supply. In this embedded signal-processing module, the modified Universal Boot Loader (U-Boot) is used to perform the initial system configuration and boot the Micro Control Linux (uClinux) kernel. And the drowsiness detection algorithm was implemented as a multithreaded application on uClinux.
III. REAL-TIMEDROWSINESSDETECTIONALGORITHM Previous studies mentioned that the EEG spectra in theta rhythm (4–7 Hz) and alpha rhythm (8–11 Hz) usually reflects
Fig. 4. Photographs of (a) our embedded signal-processing module and (b) warning tone device.
Fig. 5. Flowchart of our real-time drowsiness detection algorithm.
the changes the cognitive state and memory performance [26]–[28]. These findings motivated us to derive the drivers’ alert models and detect their cognitive state from EEG spectra in theta and alpha rhythms. In our previous study [24], we proposed an EEG-based unsupervised approach to detect drowsiness. This approach does not need a labeled training dataset with information on whether the driver is in an alert state or drowsy state at every time instant, and can account for baseline shifts and the variations in EEG spectra due to changes in recording conditions in different driving sessions.
Under the assumption that the driver should be in an alert state during the first few minutes of driving, the mode of the driver’s alert state can be derived by the first few minutes of EEG recording. In order to build the alert mode, the specific window was selected by the Mardia test [33]. If the driver is under an alert state, his or her EEG spectra in theta and alpha rhythm will follow a multivariate normal distribution, which can be charac-terized the alert models. Next, the deviation of the driver’s cur-rent state will be assessed continuously from the alert model by using Mahalanobis distance (MD). If the driver remains alert, his or her EEG spectra in theta and alpha rhythm should match the alert model. Otherwise, if the driver becomes drowsy, then his or her EEG spectra will deviate from the respective model, and hence, MD will increase. The flowchart of the real-time drowsiness detection algorithm is shown in Fig. 5.
A. Preprocessing of the EEG Signal
In our previous study [23], we found that EEG spectra in the alpha and theta rhythm, obtained from the occipital mid-line (the location of Oz in the international 10–20 EEG system), can provide discriminating power and have high correlation with the drowsiness state. Therefore, three EEG electrodes are used to monitor the EEG signal in the occipital midline. The input and reference electrodes are placed in the occipital midline and behind the right ear, respectively, and the ground electrode is placed in the center of the forehead. The procedure of EEG pre-processing was shown in Fig. 6. First, a low-pass filter (moving average filter) with a cutoff frequency of 32 Hz is used to remove 60-Hz power-line noise and other high-frequency noise. Next, EEG data will be downsampled to a sampling rate of 64 Hz to re-duce the computation load. Next, a 512-point fast Fourier trans-form (FFT) with a 448-point overlap will be used to obtain the EEG spectra. Finally, EEG spectra in alpha rhythm and theta rhythm are extracted.
B. Construction of the Alertness Model
In our proposed unsupervised approach, a new alert model for every subject in every driving session will be constructed. A multivariate distribution is used to model the distribution of the power spectrum in the alert state. Here, 3-min EEG spectral data are used to derive the alert model. The alert model can be rep-resented and characterized by a multivariate normal distribution , where is the mean vector and is the variance-co-variance matrix. The maximum-likelihood estimate is used to obtain and in this study. After finding the alert model, we check whether the EEG spectra in alpha and theta rhythm, re-spectively, indeed follow a multivariate normal using Mardia’s test. If the alert model passes Mardia’s test, the alert model will be accepted; otherwise, the next 3 min of EEG data will be used to derive and validate the alert model using Mardia’s test again.
C. Computation of Deviation of EEG Spectra From the Alert Model
After the alert model is built, the preprocessed EEG spectra in alpha and theta rhythms will be directly calculated to ob-tain the Mahalanobis distance for alpha rhythm (MDA) and for theta rhythm (MDT), respectively. The alert models of alpha and theta rhythms are represented by and , respectively. Let and be EEG spectra in alpha and theta rhythms, respectively, at some time instant, then the deviation from the alert model can be calculated by
(1)
D. Implementation of the Real-Time Drowsiness Detection Algorithm
The flowchart of the real-time drowsiness detection algo-rithm implemented in the embedded signal-processing module was shown in Fig. 7. Thread1 is designed to receive EEG data from Bluetooth. Thread2 and thread3 are used to preprocess 512-point raw EEG data, and calculate EEG spectra, respec-tively. The mean vector and covariance matrix of EEG spectra in alpha and theta rhythms during the first three minutes are obtained to build the alert mode in thread4. Thread5 calcu-lates MDA, MDT, and MDC from EEG spectra obtained in thread 3 continuously. If MDC is higher than the threshold of drowsiness, Thread6 will be executed to trigger a warning tone. Here, the multithread is used in this program to provide better flexibility and performance, and each thread is independent. In the main loop of the real-time drowsiness detection algorithm program, we just create the threads that we want and join them. The uClinux system kernel will automatically schedule those threads to reduce the system waiting cost. When the boot loader is setup, the real-time drowsiness detection algorithm program will be automatically started. Since the multiple threads share program resources, such as global variables and address spaces within one process, when we use more than one thread changing the common resources, it is essential to ensure the data integrity of the shared resources among threads. Therefore, the share memory is allocated to store the data of raw EEG data, FFT, mean vectors, and covariance matrices of theta and alpha rhythms. First, raw EEG data received from Bluetooth will be stored, and Thread2 and Thread3 will access the share memory to check enough EEG data and then obtain the FFT of raw EEG data. Thread5 will continuously access the FFT data in the shared memory to calculate the mean vectors and covariance matrices of theta and alpha rhythms. Finally, Thread6 will access the mean vectors and covariance matrices to determine the cognitive state instantaneously. Fig. 8 is the time series diagram of the multithreaded program on uClinux.
IV. RESULTS ANDDISCUSSIONS A. Experiment Design
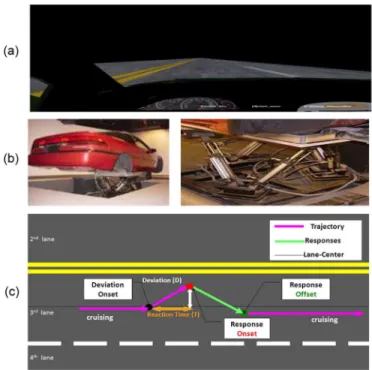
In order to verify the feasibility of our proposed EEG-based BCI system, a lane-keeping driving experiment was designed for online testing [21], [23]. Here, a virtual reality (VR)-based cruising environment was developed to simulate a car driving at 100 km/hr on a straight four-lane highway at night, as shown in Fig. 9(a). The VR-based cruising environment also contains a six degree-of-freedom (DOF) motion platform which can pro-vide dynamic stimuli and allows drivers to interact directly with
Fig. 7. Flowchart of the real-time drowsiness detection algorithm implemented in the embedded signal-processing module.
Fig. 8. Time-series diagram of the multithreaded program on uClinux.
a virtual environment rather than passively responding to mono-tonic auditory and visual stimuli, as shown in Fig. 9(b). But some differences still exist between our VR-based cruising en-vironment and real driving enen-vironment, such as rapidly varying illumination. The car randomly and automatically deviated from the center of the cruising lane to mimic a car drifting on an im-perfect road surface. The subjects were instructed to compen-sate for this deviation by steering the car to keep it in the center of the third cruising lane. In this experiment, the time points of three important events, as shown in Fig. 9(c), were recorded to obtain the driving trajectory: deviation onset (the car starts to drift away from the cruising lane), response onset (participants respond to the car-drifting event), and response offset (the car returns to the center of the third lane). The response time of sub-jects was defined as the time duration from “deviation onset” to “response onset.” If the subject is alert, the response time of the subject to the random drift will be short; otherwise, the response time will be large when the subject is drowsy. The car deviation from the central line is in direct proportion to response time. Therefore, in this study, the car deviation was defined as driving performance which can reflect the driver’s cognitive state di-rectly. In our VR-based four-lane scene, the whole road width contains 256 points and the car will drift 1/4 of the road width per second after the occurrence of car drift events. This means
Fig. 9. (a) Snapshot of the virtual reality-based driving scene. (b) Six de-gree-of-freedom (DOF) motion platform. (c) Illustration of the driving task.
that the car will enter the second lane or fourth lane after 1 s. If the driver’s cognitive state is alert, he/she should correct the de-viation within 0.2–1 s (12–64 points of the dede-viation) to prevent the car from drifting into other lanes.
In our previous study [23], we found that the highest corre-lation occurs at the location of the occipital midline with MDT and MDA. The relationship between the driving performance and the concurrent changes in the EEG spectra has also been investigated. It showed that when the driving performance in-creases from 0 to 20, the mean of alpha power rises sharply and monotonically, and after that, it slowly goes down a little bit. For the theta power, the mean power of theta power increases mono-tonically and steadily when the driving performance increases (alertness to deep drowsiness). Moreover, we also found that Mahalanobis distances of EEG spectra provide better correla-tion with driving performance than the use of EEG spectra in alpha and theta rhythms. Fig. 10 showed an example for the re-lationship between EEG spectra, MD of EEG spectra from the alert model, and actual driving performance. Obviously, EEG spectra in alpha rhythm increases when the driving performance increases. Moreover, the MDA and MDT of the subject signifi-cantly correlate with his driving performance.
B. Drowsiness Detection
In order to classify alert and drowsy states effectively, F-mea-sure was used to find out the threshold of MD for drowsiness. The F-measure is the harmonic mean of precision and recall, and its value can be calculated as follows:
precision recall
precision recall (3)
In information retrieval, precision and recall mean positive pre-dictive value (PPV) and sensitivity, respectively. In order to cal-culate PPV and sensitivity, we first defined some parameters of
Fig. 10. (a) EEG spectra. (b) Driving performance. (c) MDT. (d) MDA in the lane-keeping driving experiment.
the binary classification test for drowsiness detection: True itive (drowsy people correctly diagnosed as drowsy), False Pos-itive (alert people incorrectly identified as drowsy), True ative (alert people correctly identified as alert), and False Neg-ative (drowsy people incorrectly identified as alert). The PPV and sensitivity can be calculated as follows:
TruePositive
TruePositive FalsePositive (4) Sensitivity TruePositive
TurePositive FalseNegative (5) Therefore, PPV denotes the precision of drowsiness prediction, and sensitivity means the percentage of drowsy people who are identified as having the drowsy condition.
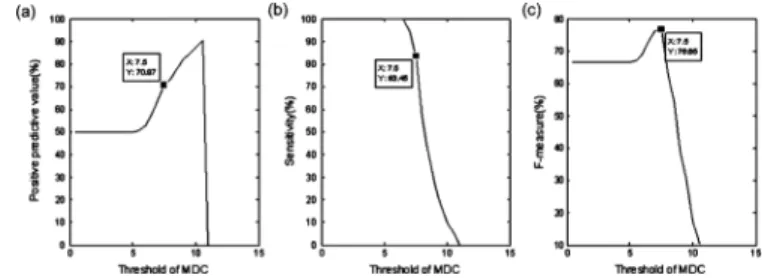
Here, a total of 15 subjects’ driving performance and MD were analyzed to find the maximum F-measure value under different conditions. The parameter in (2) was set from 0.1 to 0.9, and the threshold of drowsiness was set from 1 to 15 in this test. Fig. 11 showed the result of average F-measure, PPV, and sensitivity of 15 subjects corresponding to different thresholds at 0.7. It showed that if the threshold is less than 10, the PPV increases when the threshold increases. However, if the threshold is larger than 7, the sensitivity decreases rapidly when the threshold increases. This indicated that the smaller threshold can detect most of drowsiness events effectively, but also increases the recognition error rate of drowsiness events. The optimal threshold, which can provide better PPV and sensitivity, obviously is between 6 and 8. In this case, the
corresponding to different thresholds at = 0.7.
TABLE I
RESULTS OF THEOPTIMALF-MEASUREUNDERDIFFERENTCONDITIONS
optimal value of the F-measure is 76.7% ( 70.9% and sensitivity 83.5%) when the threshold is equal to 7.5. The result of the optimal F-measure under different conditions was listed in Table I. The maximum F-measure 77.6%, (
69.2% and sensitivity 88.3%) is under the condition of 0.9 and the threshold 7.5.
Next, ten subjects’ driving performance and MD for testing sessions were used to test the reliability of this system ( 0.9 and the threshold 7.5). The result of the testing session for drowsiness detection was listed in Table II. It showed that most of the precision of drowsiness prediction (PPV) is between 75% and 80%. Except for subjects 2 and 9, the sensitivities of other subjects are more than 80%. The average of F-measure of ten subjects is 82% ( 76.9% and sensitivity 88.7%). Here, higher sensitivity of our system can help drivers avoid traffic accidents more effectively, although 76.9% of PPV may confuse drivers sometime. The precision of drowsiness predic-tion can still be improved by combining with other physiological signals in the future.
C. Comparison With Other BCI Systems
The specifications of the proposed BCI system and the other existing systems are summarized in Table III. Farshchi et al. [29] developed a low-power, six-channel wireless neural recording system by creating custom integrated circuits (IC) to assemble commercial-off-the-shelf (COTS) PC-based components. This system transmits neural signals to a client personal computer (PC) by Zigbee wireless communication. Yan et al. [30] imple-mented a BCI-neurofeedback system to overcome the limita-tion of monotonous feedback methods. The system consists of
three-channel EEG acquisitions within a 12-b, 1000-Hz sam-pling rate. Here, the universal serial bus (USB) is used to com-municate with back-end PC to create appropriate feedback in-formation in certain scenarios. Fei et al. [31] designed a system which integrates ECG, EEG, and other sensors with radio-fre-quency identification (RFID) into a radio-freradio-fre-quency (RF) board through a programmable interface chip (PSoc). However, this system does not provide any biofeedback device. Kim et al. [32] built up a helmet-based system that could monitor ECG, EOG, and EEG. The fetched signals are transmitted to a laptop computer via Bluetooth. Regarding our proposed system, it pro-vides a wireless physiological signal-acquisition module and an embedded signal-processing module. The size of the wire-less physiological signal-acquisition module is small, and can be embedded into a headband as a wearable device. Moreover, it can continuously operate for more than 33 h with a com-mercial 1100-mA Li-Ion battery. Therefore, it can be used for long-term EEG monitoring. Different from other BCI systems, we designed a portable wireless embedded signal-processing module as the back–end signal-processing unit. The advantages of low power consumption and small volume of the embedded signal-processing module are suitable for car applications. The SD/MMC socket in this module also provides good interface scalability for other applications. The warning tone device unit in this module can also provide a biofeedback mechanism.
For the performance of drowsiness detection, Kim et al. used a helmet-based system to detect drowsiness by detecting blinking and heart-rate variability [32]. The sensitivity and specificity of drowsiness detection are 79.3 and 76.4%, respec-tively. For our real-time wireless EEG-based BCI system, the PPV and sensitivity are 76.9% and 88.7%, respectively. The performance of our system is similar to that of the helmet-based system, but our system was set to provide better sensitivity.
V. CONCLUSION
In this study, a real-time wireless EEG-based BCI system was proposed for drowsiness detection in car applications. It consists of a wireless physiological signal-acquisition module and an embedded signal-processing module. EEG signals can be measured by the wireless physiological signal-acquisition module and transmitted wirelessly to the embedded signal-pro-cessing module via Bluetooth. This module is small enough to
be embedded into a headband as a wearable EEG device. It provides the advantages of mobility and long-term EEG moni-toring (more than 33 h by using a 1100-mA Li-Ion battery). The embedded signal-processing module provides powerful com-putations, and provides good interface scalability by using the SD/MMC socket. The advantages of low power consumption and small volume of the proposed system are suitable for car ap-plications. Moreover, the modular approach applied in hardware and software design enables this system to be configurable for different application scenarios in the future. This system is fea-sible for further extension. Based on the unsupervised approach proposed in our previous study, a real-time drowsiness detection algorithm was also developed and implemented in this module to detect drowsiness continuously and trigger a warning tone when the drowsy state occurs. In our previous study, we have found that the occipital midline is an effective channel to dis-criminate the power of drowsiness from that of alertness. Based on this property, our BCI system only uses three EEG electrodes to detect drowsiness. Therefore, compared to other BCI tech-niques, the setup of our BCI system is relatively easier. More-over, in order to verify the reliability of our proposed EEG-based BCI system, a lane-keeping driving experiment was designed for online testing. For ten subjects, the average of PPV and sensitivity are 76.9% and 88.7%, respectively. Therefore, our real-time wireless embedded EEG-based BCI system is feasible for drowsiness detection. It can be considered as an alterna-tive to the drowsiness monitoring system in practical driving applications.
ACKNOWLEDGMENT
The authors would like to thank CIC for providing the 0.35- m mixed-signal CMOS process.
REFERENCES
[1] J. A. Horne and L. A. Reyner, “Sleep related vehicle accidents,” Brit.
Med. J., vol. 310, pp. 565–567, 1995.
[2] G. Maycock, “Sleepiness and driving: The experience of UK car drivers,” J. Sleep Res., vol. 5, pp. 229–237, 1996.
tistics and Analysis. Washington, D.C. [Online]. Available: http://www.nhtsa.dot.gov/
[7] “Sleep facts and stats,” National Sleep Foundation. Washington, D.C. [Online]. Available: http://www.sleepfoundation.org/
[8] T. Pilutti and G. Ulsoy, “Identification of driver state for lane-keeping tasks,” IEEE Trans. Syst., Man, Cybern., A: Syst. Humans, vol. 29, no. 5, pp. 486–502, Sep. 1999.
[9] J. Qiang, Z. Zhiwei, and P. Lan, “Real-time nonintrusive monitoring and prediction of driver fatigue,” IEEE Trans. Vehic. Technol., vol. 53, no. 4, pp. 1052–1068, Jul. 2004.
[10] A. Eskandarian and A. Mortazavi, “Evaluation of a smart algorithm for commercial vehicle driver drowsiness detection,” in Proc. IEEE
Intel-ligent Vehicles Symp., 2007, pp. 553–559.
[11] T. Hong and H. Qin, “Drivers drowsiness detection in embedded system,” in Proc. IEEE Int. Conf. Vehicular Electronics and Safety, 2007, pp. 1–5.
[12] M. J. Flores, J. M. Armingol, and A. Escalera, “Real-time drowsiness detection system for an intelligent vehicle,” in Proc. IEEE Intelligent
Vehicles Symp., 2008, pp. 637–642.
[13] J. A. Stern, D. Boyer, and D. Schroeder, “Blink rate: A possible mea-sure of fatigue,” Human Factors, vol. 36, no. 2, pp. 285–297, 1994. [14] K. Van Orden, W. Limbert, S. Makeig, and T.-P. Jung, “Eye activity
correlates of workload during a visual spatial memory task,” Human
Factors, vol. 43, no. 1, pp. 111–121, 2001.
[15] M. Matousek and I. Petersen, “A method for assessing alertness fluctuations from EEG spectra,” Electroencephalography Clin.
Neu-rophysiol., vol. 55, no. 1, pp. 108–113, 1983.
[16] S. Roberts, I. Rezek, R. Everson, H. Stone, S. Wilson, and C. Alford, “Automated assessment of vigilance using committees of radial basis function analysers,” Proc. Inst. Elect. Eng., Sci., Meas. Technol., vol. 147, no. 6, pp. 333–338, 2000.
[17] H. J. Eoh, M. K. Chung, and S. H. Kim, “Electroencephalographic study of drowsiness in simulated driving with sleep deprivation,” Int.
J. Ind. Ergonom., vol. 35, pp. 307–320, 2005.
[18] S. Makeig and M. Inlow, “Lapses in alertness: Coherence of fluctu-ations in performance and EEG spectrum,” Electroencephalography
Clinical Neurophysiol., vol. 86, no. 1, pp. 23–35, 1993.
[19] S. Makeig and T.-P. Jung, “Changes in alertness are a principal com-ponent of variance in the EEG spectrum,” Neuroreport, vol. 7, no. 1, pp. 213–216, 1995.
[20] T.-P. Jung, S. Makeig, M. Stensmo, and T. J. Sejnowski, “Estimating alertness from the EEG power spectrum,” IEEE Trans. Biomed. Eng., vol. 44, no. 1, pp. 60–69, Jan. 1997.
[21] C. T. Lin, R. C. Wu, S. F. Liang, W. H. Chao, Y. J. Chen, and T. P. Jung, “EEG-based drowsiness estimation for safety driving using independent component analysis,” IEEE Trans. Circuits Syst. I: Reg.
Papers, vol. 52, no. 12, pp. 2726–2738, Dec 2005.
[22] H. Su and G. Zheng, “A partial least squares regression-based fusion model for predicting the trend in drowsiness,” IEEE Trans. Syst., Man
Cybern., Part A: Syst. Humans, vol. 38, no. 5, pp. 1085–1092, Sep.
2008.
[23] N. R. Pal, C. Y. Chuang, L. W. Ko, C. F. Chao, T. P. Jung, S. F. Liang, and C. T. Lin, “EEG-based subject- and session-independent drowsiness detection: An unsupervised approach,” EURASIP J.
Advances Signal Process., vol. 2008, 2008, Article ID 519480,
11 pages.
[24] X. Gao, D. Xu, M. Cheng, and S. Gao, “A BCI-based environmental controller for the motion-disabled,” IEEE Trans. Neural Syst. Rehab.
Eng., vol. 11, no. 2, pp. 137–140, Jun. 2003.
[25] I. Obeid, M. A. L. Nicolelis, and P. D. Wolf, “A multichannel telemetry system for signal unit neural recording,” J. Neurosci. Methods, vol. 133, pp. 33–38, 2003.
[26] W. Klimesch, “EEG alpha and theta oscillations reflect cognitive and memory performance: A review and analysis,” Brain Res. Rev., vol. 29, pp. 169–195, 1999.
28, pp. 167–172, 2008.
[31] H. Fei, X. Yang, and H. Qi, “Congestion-aware, loss-resilient bio-mon-itoring sensor networking for mobile health applications,” IEEE J. Sel.
Areas Commun., vol. 27, no. 4, pp. 450–465, May 2009.
[32] Y. S. Kim, H. J. Baek, J. S. Kim, H. B. Lee, J. M. Choi, and K. S. Park, “Helmet-based physiological signal monitoring system,” Eur. J. Appl.
Physiol., vol. 105, pp. 365–372, Feb. 2009.
[33] K. V. Mardia, “Mardia’s test of multinormality,” in Encyclopedia of
Statistical Sciences, S. Kotz and N. L. Johnson, Eds. New York: Wiley, 1985, vol. 5, pp. 217–221.
Chin-Teng Lin (F’05) received the B.S. degree from National Chiao-Tung University (NCTU), Taiwan, in 1986, and the M.Sc. and Ph.D. degrees in electrical engineering from Purdue University, West Lafayette, IN, in 1989 and 1992, respectively.
Currently, he is the Provost, Chair Professor of Electrical and Computer Engineering, Professor of the Institute of Imaging and Biomedical Photonics, and Director of Brain Research Center at NCTU. He is the coauthor of Neural Fuzzy Systems (Pren-tice-Hall) and the author of Neural Fuzzy Control
Systems with Structure and Parameter Learning (World Scientific).
Dr. Lin was elevated to be IEEE Fellow for his contributions to biologically inspired information systems in 2005. He served on the Board of Governors with the IEEE Circuits and Systems (CAS) Society in 2005–2008; IEEE Systems, Man, Cybernetics (SMC) Society in 2003–2005; IEEE Computa-tional Intelligence Society in 2008–2010; and Chair of IEEE Taipei Section in 2009–2010. He was the Distinguished Lecturer of the IEEE CAS Society from 2003 to 2005. He served as the Deputy Editor-in-Chief of IEEE TRANSACTIONS ONCIRCUITS ANDSYSTEMSI and IEEE TRANSACTIONS ONCIRCUITS AND
SYSTEMS II in 2006–2008. Currently, he is an Associate Editor of the IEEE TRANSACTIONS ONCIRCUITS AND SYSTEMS I; IEEE TRANSACTIONS ONCIRCUITS AND SYSTEMSII; IEEE TRANSACTIONS ON SYSTEMS, MAN,
AND CYBERNETICS; IEEE TRANSACTIONS ON FUZZY SYSTEMS; and the INTERNATIONALJOURNAL OFSPEECHTECHNOLOGY.
Che-Jui Chang received the B.S. degree in electrical engineering from Chang-Gung University, Taiwan, in 2007, and the M.S. degree in electrical and control engineering from the National Chiao-Tung Univer-sity, Taiwan, in 2009.
His current research interests include brain–com-puter interface design, biomedical amplifier circuit design, and embedded system processing.
Bor-Shyh Lin (M’04) received the B.S. degree from National Chiao Tung University (NCTU) in 1997, the M.S. degree in electrical engineering from National Taiwan University, Taiwan, in 1999, and the Ph.D. degree in electrical engineering from NTU in 2006.
Currently, he is Assistant Professor at the Institute of Imaging and Biomedical Photonics, NCTU, Taiwan. His research interests are in the areas of biomedical circuits and systems, biomedical signal processing, and biosensors.
mechatronics engineering from National Taiwan University, Taiwan, in 2006.
His research interests are in the areas of biomed-ical engineering, biomedbiomed-ical signal processing, and pattern recognition.