Abstract—There are current limitations in the recording technologies for measuring EEG activity in clinical and experimental applications. Acquisition systems involving wet electrodes are time-consuming and uncomfortable for the user. Furthermore, dehydration of the gel affects the quality of the acquired data and reliability of long-term monitoring. As a result, dry electrodes may be used to facilitate the transition from neuroscience research or clinical practice to real-life applications. EEG signals can be easily obtained using dry electrodes on the forehead, which provides extensive information concerning various cognitive dysfunctions and disorders. This work presents the usefulness of the forehead EEG with advanced sensing technology and signal processing algorithms to support people with healthcare needs such as monitoring sleep, predicting headaches, and treating depression. The proposed system for evaluating sleep quality is capable of identifying five sleep stages to track nightly sleep patterns. Additionally, people with episodic migraines can be notified of an imminent migraine headache hours in advance through monitoring forehead EEG dynamics. The depression treatment screening system can predict the
This work was supported in part by the UST-UCSD International Center of Excellence in Advanced Bio-engineering sponsored by the Taiwan Ministry of Science and Technology I-RiCE Program under Grant Number: MOST 103-2911-I-009-101, in part by MOST 104-2627-E-009-001 and 105-2221-E-009-069, in part by the Aiming for the Top University Plan of National Chiao Tung University, the Ministry of Education, Taiwan, under Contract 104W963. Research was also sponsored in part by the Army Research Laboratory and was accomplished under Cooperative Agreement Number W911NF-10-2-0022. The views and the conclusions contained in this document are those of the authors and should not be interpreted as representing the official policies, either expressed or implied, of the Army Research Laboratory or the U.S Government. The U.S Government is authorized to reproduce and distribute reprints for Government purposes notwithstanding any copyright notation herein.
C.-T. Lin and C.-H. Chuang are with the Faculty of Engineering and Information Technology, University of Technology Sydney, Ultimo, Australia (e-mail: chintenglin@gmail.com; chchuang@ieee.org)
Z. H. Cao, A. K. Singh, and Y.-T. Liu are with the Faculty of Engineering and Information Technology, University of Technology Sydney, Ultimo, Australia, and also with the Brain Research Center, National Chiao Tung University, Hsinchu, Taiwan.
C.-S. Hung, Y.-H. Yu, M. Nascimben and J.-T. King are with the Brain Research Center, National Chiao Tung University, Hsinchu, Taiwan
T.-P. Su is with the Department of Psychiatry, Taipei Veterans General Hospital, Taipei, Taiwan.
S.-J. Wang is with the Neurological Institute, Taipei Veterans General Hospital, Taipei, Taiwan.
efficacy of rapid antidepressant agents. It is evident that frontal EEG activity is critically involved in sleep management, headache prevention, and depression treatment. The use of dry electrodes on the forehead allows for easy and rapid monitoring on an everyday basis. The advances in EEG recording and analysis ensure a promising future in support of personal healthcare solutions.
Index Terms— Depression, Forehead EEG, Healthcare, Migraine, Sleep
I. INTRODUCTION
HE electroencephalogram (EEG) is a commonly used medical testing device that detects abnormal electrical activity in the brain. Significant advances in neuroscience, sensor technologies [1, 2], and efficient signal processing algorithms have facilitated the transition from clinical-oriented diagnoses and research to personal healthcare applications. It is evident through the literature that there is promising future for the everyday use of EEG for monitoring and tracking health.
Conventional wet adhesive Ag/AgCl electrodes that are placed on a cap and connected to a signal amplifier are the most common devices for recording EEG signals from the scalp in a clinical context. To ensure that a high-quality EEG signal is obtained, a time-consuming process requiring proper skin preparation and electrolyte application must be performed. Recent advances in material technology have led to progress in the development of dry EEG sensors avoiding a conductive gel. Furthermore, miniature circuits—integrated with signal amplifiers, a wireless transmission component, and long-life battery—transform a restrictive acquisition system into a portable device. However, it is challenging to maintain good contact between the electrodes and a hairy scalp. Despite a signal quality assessment model [3], invalid EEG data collection is inevitable—limiting the practicability of EEG in healthcare.
The forehead is an ideal location on the scalp for attaching EEG electrodes as it is not covered in hair. Preparing the forehead for EEG placement takes only a few minutes, which is a significant time reduction[4]. Non-hairy regions of the forehead can be used to extract rich information that originates
Forehead EEG in Support of Future Feasible
Personal Healthcare Solutions:
Sleep Management, Headache Prevention, and
Depression Treatment
Chin-Teng Lin, Fellow, IEEE, Chun-Hsiang Chuang, Member, IEEE, Zehong Cao,
Avinash Kumar Singh, Chih-Sheng Hung, Yi-Hsin Yu, Mauro Nascimben, Yu-Ting Liu,
Jung-Tai King, Tung-Ping Su, Shuu-Jiun Wang
cognitive abilities and dysfunctions. Given this unique feature, most existing consumer brain-computer interfaces (BCI) and clinical applications rely on forehead electrodes [5, 6].
One of the most successful consumer products is the sleep tracking device, which is widely advertised to provide positive effects on overall health [7]. Sleep is suggested to play an important role in restitution [8]. Numerous pathologies are related to sleep; therefore, a method for evaluating sleep quality is desirable. Many wristbands evaluate the quantity and quality of sleep using an actigraph with a built-in 3D accelerometer [7, 9]. However, wristband devices do not differentiate the distinct phases of sleep (light sleep, deep sleep, and rapid eye movement sleep), which is important for physicians to evaluate sleep patterns. Polysomnography (PSG) [10]is the standard process to record and comprehend the biophysiological changes that occur during sleep; PSG is performed during clinical sleep tests. Among PSG methods, the EEG yields the most important information about sleep oscillations, such as K-complex, spindle, and delta waves that are generated in various sleep stages [11]. Regarding the brain region, sleep is characterized by a fronto-occipital EEG power gradient, of which frontal areas are specifically involved in sleep homeostasis [12, 13]. A lack of adequate sleep has deleterious effects—particularly on alertness, attention, decision-making, and cognitive processes, which are associated with the frontal lobe function [14]. The theta power during prolonged wakefulness has a particular frontal concentration, suggesting that frontal regions may provide a marker for sleep propensity during wakefulness. Additionally, previous EEG findings concerning insomnia—a sleep disorder of inadequate nighttime sleep with difficulty in initiating and maintaining sleep [15]
—have revealed increased signals with high frequencies in patients with primary insomnia.
Prevention is key to reducing healthcare costs; a successful case is migraine prevention. A migraine is characterized by recurrent headaches and is particularly prevalent in developed countries [16]. When a headache occurs, it if difficult for patients to maintain concentration and perform daily activities; this impairment results in considerable economic losses. Lack of sleep and excessive sleep are both deemed triggers for migraines [17]. The EEG patterns that are observed in migraine patients support a physiological connection between sleep and migraines [18]. Most EEG studies of migraines describe functional changes between, before and during attacks, including abnormal effective connectivity, hyperresponsivity to repeated sensory stimuli with abnormal temporal processing, the malfunctioning sequential recruitment of neuronal networks, and impaired habituation [19, 20]. EEG patterns reflect the dynamic complexity of patients’ brains [21], which may facilitate the prediction of imminent migraine headaches hours in advance and monitor the effects of therapeutic interventions. Predicting the onset of a migraine is important, as the use of preventive medications before an attack can significantly reduce the severity and duration of a headache. Therefore, it is important to investigate the fundamental patterns from EEG
Personalized medicine is developing rapidly [22]. Recently, the biomarker used to optimize the initial treatment selection in depression has been extensively explored [22-24]. Depression is a disorder of the affective system, with a lifetime prevalence of approximately 13% in men and 21% in women [25]. The major symptoms of depression include low or depressed mood, anhedonia, and low energy or fatigue. Overall, one-third of patients with a major depressive disorder do not respond to existing antidepressants; researchers are eager to explore a biomarker that can predict the efficacy of a treatment before antidepressants are given and an appropriate treatment is prescribed. Previous studies have demonstrated the broad use of EEG in clinics to study antidepressant treatment responses [26, 27]. Furthermore, studies have shown that discriminative EEG patterns may help patients predict the effects of antidepressants as treatment [27]. Theta (4-7.5 Hz) and alpha (8-12 Hz) activity-derived measures indicated that the response effects of antidepressants correlated to dynamic changes of EEG power in the forehead area [27-30]. Thus, the forehead EEG may have important implications for the diagnosis and treatment of depression. EEG signals can be used to guide the development of personalized medicine, including the selection of an appropriate dose, and optimal therapies.
This paper presents practical methods for monitoring sleep quality, warning for oncoming of migraine attacks, and screening depression treatments. The proposed solutions are based on EEG patterns extracted from the forehead area using a wireless and dry EEG system [1, 2, 31]. The basic principles of each method are introduced, and the feasibility of their use in real-life applications is demonstrated.
II. WEARABLE HEADBAND WITH DRY ELECTRODES FOR
FOREHEAD EEGSENSING
Wet electrodes are commonly used to measure EEG signals; proper skin preparation and the application of a conductive gel yields strong EEG signals. However, these processes are typically troublesome for users. The development of wireless and wearable EEG systems, such as Cognionics [32], Enobio [33], NeuroSky [34], DSI 10/20 [35], and imec [36], have been developed to mitigate the application process. Researchers have also developed distinct novel dry-contact EEG sensors, including spring-loaded [37] and foam-based sensors [38], which can efficiently reduce the required preparatory work without the use of a conductive gel. The spring-loaded sensor [37] was proposed for use on hairy sites without skin preparation or the use of a conductive gel. Each sensor was designed with a probe head, plunger, spring, and barrel. The probes were inserted into a flexible substrate using a one-time forming process based on an established injection molding procedure. With spring contact probes, the flexible substrate allows for high geometrical conformity between the sensor and the irregular scalp surface and generates a low skin-sensor interface impedance. Additionally, the flexible substrate has a sensor buffer effect, which eliminates pain when a force is applied.
The dry foam electrode [38] is fabricated by covering an electrically conductive polymer foam with conductive fabric and can be used to measure bio-potentials at non-hairy sites, such as the forehead, without skin preparation or the use of a conducting gel. The foam substrate of a dry electrode provides high geometric conformity to an irregular scalp surface to maintain low skin-electrode impedance—even under motion. The presence of a new sensor made of a silicon-based conductive material further satisfies the requirements of being conductive, flexible and non-irritating to the skin [31].
In laboratory- and clinical-based EEG devices, the measured brain activity is transmitted via a cable connected from the EEG cap to a computer. This cable limits the usefulness of BCI. To solve this problem, the developed EEG headband (Fig. 1) features a wireless transmission module and a chargeable battery that support recordings without connection to a computer and enable users to move freely. With this freedom, wireless and wearable EEG devices have been used in experiments involving complex activities such as driving [39]. This convenient EEG acquisition system can be used to improve our understanding of complex coordinated- and multi-joint naturalistic behaviors in operating environments.
A. Novel Flexible Silicon-based Dry Sensors
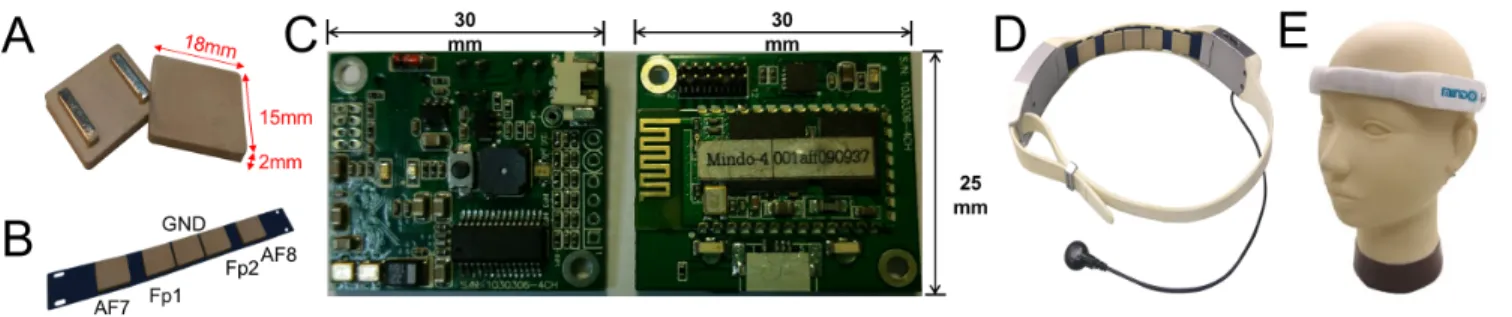
The major components of the proposed silicon-based dry sensor (Figs. 1A and 1B) include silicon, silver, AgSiO2, gel
and thick-film pastes. A compound containing the correct ratio of components provides low impedance and high flexibility. The proposed sensor has a lightweight design and uses limited material to optimize its sensitivity. Several molds were used to produce different sensor shapes for use in different areas. The fabrication procedure included high-temperature and high-pressure treatments. The manufacturing conditions (i.e., temperature, flow and pressure) were controlled in all bind molding processes. If the electrode was to be combined with metal contact bars, a special conductive gel was used in the bind molding process. Temperature control is important as the materials (i.e., metal, conductive gel, silicon and silver-based material) have different expansion coefficients. Additionally,
forming different electrodes shapes requires a highly precise process. The flexible silicon-based dry sensor design can improve the signal quality and extend the life-cycle of electrodes.
B. Lightweight Headband that Incorporates Miniature Data Acquisition Circuitry and Wireless Telemetry
As presented in Fig. 1C, two circuit boards are embedded in the acquisition system; the major components include amplifiers, analog-to-digital converter (ADC) units, a microcontroller unit, and a wireless module (Bluetooth unit). The size of the proposed circuit boards is 30×25×5 mm3. The
circuit boards and battery are small enough to be housed in the EEG device (Fig. 1D). In the EEG measurement process, analog EEG signals were measured using dry sensors and preamplified using instrumentation amplifiers. The preamplifier provides a high input impedance and high common-mode rejection ratio (CMRR) and amplifies the microvolt-level EEG signals into the detectable range. Then, the analog EEG signal was transformed to a digital signal using an ADC [40]. A microcontroller was used to pack the digital data from each channel into Bluetooth packets. The packets were switched to a Bluetooth module using a universal asynchronous receiver/transmitter.
The gain of the preamplifier unit was set to 1361 (default), and the cut-off frequency was regulated at 0.23 Hz using a high-pass filter. The ADC setting was configured to provide a 24-bit resolution of EEG signals at a sampling rate of 250/500 Hz. The power-line interference was removed by a microcontroller using a moving average filter (i.e., notch filter) with a frequency of 60 Hz. The digitalized and processed signals were transmitted to the receiving application via a Bluetooth module with a baud-rate of 921600 bits/s. Power was supplied by a high-capacity (750 mAh, 3.0 V) Li-ion battery capable of continuous operation for 8 to 10 hours.
C. Signal Pre-processing
Fig. 1. Wearable headband with dry electrodes for forehead EEG sensing. (A) Silicon-based EEG sensor. Length, width, and height of the electrode are 18, 15, and 2 mm, respectively, in each dimension. (B) Channel placement. Five electrodes are embedded. (C) EEG acquisition circuit. Major components include amplifiers, analog-to-digital converter units, a microcontroller unit, and a wireless module. The size of the proposed circuit boards is 30×25×5 mm3. (D) Wearable headband.
Users can easily adjust to fit as tight or loose as desired. One reference electrode is used in contact with a user’s earlobe. (E) Forehead EEG sensing. The developed EEG system is designed to easily wear and provide access to the forehead locations without gels or other preparation.
processing and analysis [41]. To avoid artifact interference in the models, EEG data were bandpass-filtered from 1 to 30 Hz using a zero-phase FIR filter before being inspected by experienced EEG specialists. Then, the EEG signals were inspected again using the Automatic Channel Rejection (ACR) function in EEGLAB to remove noisy channels. The processed EEG signals were used for further analysis. Several methods of artifact removal have been proposed for single-channel collection of EEG data from everyday tasks [42]. Single-channel data acquisition is appropriate for use in portable environments with the constraints of a wearable sensor. Algorithms based on single-channel independent component analysis, empirical mode decomposition, or wavelet decomposition have a low computing cost and address the risk of artifacts.
III. SYSTEM FOR EVALUATING QUALITY OF SLEEP
Sleep monitoring is essential when evaluating individual health. Sleep quality is evaluated by sleep duration and continuity [43]. According to Rechtschaffen and Kales [44], sleep can be divided into wakefulness (W), movement, rapid eye movement (REM) and sleep stages S1, S2, S3, and S4. In the guidelines of the American Academy of Sleep Medicine (AASM) [45], sleep stages S1 to S4 are referred to as non-REM stage 1 (N1), stage 2 (N2), and stage 3 (N3). N3 involves slow wave sleep (SWS), which combines sleep stages S3 and S4 based on the sleep stage criteria of Rechtschaffen and Kales. The PSG [10], consisting of at least 11 channels of EEG, electromyography (EMG), electrooculography (EOG), oxygen saturation (SpO2), and electrocardiography (ECG) is the most common test in sleep diagnoses.
Generally, a well-trained sleep technician scores each 30 s EEG data point through visual inspection based on the AASM. An epoch is scored as W when more than 50% of the 1 s subepochs are dominated by the alpha (8-12 Hz) rhythm. An epoch is scored as N1 when the alpha rhythm is attenuated and replaced by the theta (5-7 Hz) rhythm. An epoch is scored as N2 when the K-complex or sleep spindle (12-14 Hz) occurs with a theta background rhythm. An epoch is scored as N3 when more than 20% of the subepochs exhibit high-amplitude slow wave activity. However, this visual inspection process is time-consuming and laborious. To address this issue, this work proposes an automatic sleep stage classification system [46].
A. Participants and Data Acquisition
Ten healthy adults (males, age 24±6 years) were recruited for this sleep study. All subjects were required to sleep for one night in the sleep laboratory at National Chiao Tung University, Taiwan. All experimental procedures were approved by the local ethics committee (Institutional Review Board of Taipei Veterans General Hospital, Taiwan). The forehead EEG signals (Fp 1 and Fp2) and the PSG signals were recorded
simultaneously at a sampling rate of 256 Hz (Sandman Elite, Nellcor Puritan Bennett [Melville] Ltd., Kanata, Ontario, Canada). Each dataset contained five to eight hours of forehead EEG signals and a complete PSG signal. Each 30 s epoch was scored as W, REM, N1, N2, and N3 by a sleep specialist who has over thirty years of experience in clinical sleep diagnoses. In total, there were 1518, 1084, 3119, 1283, and 1247 epochs scored as W, N1, N2, N3, and REM, respectively.
B. Automatic Classification of Sleep Stages
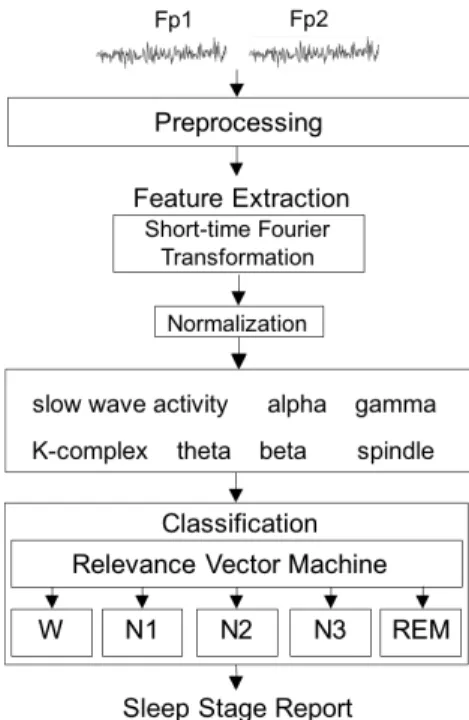
As presented in Fig. 2, the main components of the proposed sleep stage classification system include preprocessing, feature extraction, and classification. In the preprocessing step, the recorded signals were down-sampled to 128 Hz to reduce the volume of data and then filtered through a 0.5-50 Hz band-pass filter to eliminate the artifacts. Next, the short-time Fourier transformation (STFT) was used to capture the spectral patterns in the EEG. Two EEG features were extracted from the low delta band used to measure slow wave activity; two features were extracted from the delta activity to describe the K-complex; two features were extracted from the theta activity to measure the theta background rhythm; two features were extracted from the alpha activity to measure the alpha background rhythm, and two features were extracted from the sigma activity to represent the features of the spindle. Two and one feature(s) are extracted from the beta and gamma activities, respectively, to detect movement. Therefore, a total of 13 features were extracted and used to construct the sleep stage classification system.
Fig. 2. Sleep quality evaluation system. The input data are EEG signals of Fp1 and Fp2, and then preprocessed by a down-sampled procedure and a band-pass filter. Each of the processed data is transformed to a 13-dimensional feature vector used to construct the relevance vector machine for the sleep stage classification (W, N1, N2, N3, and REM).
The following were used to perform the classification: the relevance vector machine (RVM), based on a Bayesian framework, and a support vector machine (SVM) [47] that learns the maximal probability of margins between binary classes. Unlike the support vector machine, the RVM can solve the overfitting problem, which typically occurs if SVM requires too many support vectors, and the parameter setting problem (i.e., penalty parameter/slack variable). Therefore, in this sleep stage classification system, the RVM was used to classify the five sleep stages. Regarding the system performance, the consistency between the clinical electrophysiologist and the proposed system was calculated. Additionally, the Cohen’s kappa coefficient (κ) was estimated to measure the agreement between the specialist and the system. When the specialist and the system were in complete agreement, then κ=1. When there was no agreement (other than what would be expected by chance), then κ ≤ 0. The performance of the proposed system was evaluated by the leave-one-subject-out cross validation method.
C. Classification Results
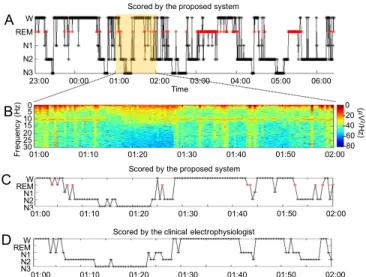
Fig. 3 presents a one-night sleep analysis based on the developed classification system. In this case, the consistency between the clinical electrophysiologist and the proposed system was 79.9% and κ=0.73. As displayed in Table I, the classification accuracies of the W, N1, N2 N3, and REM stages were 84.1%, 22.4%, 85.0%, 87.1%, and 83.2%, respectively. Most of the sleep stages, except for the N1 stage, were effectively classified (>80%) using the proposed system. Many epochs of N1 were misclassified as W, N2, or REM. Identifying
N1 was difficult [48] because N1 is a transition phase between wakefulness and other sleep stages. The sleep EEG characteristics of N1 closely resemble those of N2, REM, and resting wakefulness. Efforts are under way to solve this problem. The overall consistency between the clinical electrophysiologist and the proposed system was 76.7%,and the overall Cohen’s kappa coefficient was κ=0.689. The performance of the sleep stage classification system with a forehead-only EEG is near that of a sleep expert.
IV. FOREHEAD EEGCOMPLEXITY DYNAMICS BEFORE
MIGRAINE ATTACKS
Approximately 70-90% of migraine patients have migraines without aura (MoA), meaning that there is no early warning of imminent pain [49]. In the migraine cycle shown in Fig. 4, the 72-hour period before a headache attack is defined as the pre-ictal phase; the 72-hour period after a headache attack is defined as the post-ictal phase; the period between the pre- and post-ictal phases is the inter-ictal phase. It is important to identify a biomarker that can differentiate between the pre-ictal phase from the inter-ictal phase. Many studies [50, 51] have reported forehead cortex dysexcitability in migraine patients. To model this abnormality, a multiscale fuzzy entropy analysis (MFE) [52, 53] was performed on the forehead EEG to compare the entropy values in the different phases of a migraine.
A. Patients and Experiment
TABLEI
CONSISTENCY BETWEEN THE SLEEP STAGES SCORED BY THE EXPERT AND THE PROPOSED SYSTEM
Sleep Stage Classification System
W N1 N2 N3 REM Ex pe rt W 84.1% 6.8% 5.5% 0.4% 3.3% N1 17.3% 22.4% 36.2% 0.6% 23.6% N2 1.6% 3.8% 85.0% 6.3% 3.4% N3 0.3% 0.0% 12.0% 87.1% 0.6% REM 2.2% 8.0% 6.2% 0.3% 83.2% Time 00:00 01:00 04:00 05:00 06:00 23:00 W REM N1 N2 N3
Scored by the proposed system W REM N1 N2 N3 01:00 01:10 01:20 01:30 01:40 01:50 02:00
Scored by the clinical electrophysiologist W REM N1 N2 N3 01:00 01:10 01:20 01:30 01:40 01:50 02:00 02:00 03:00
Scored by the proposed system A C D 01:00 01:10 01:20 01:30 01:40 01:50 02:00 0 30 25 20 15 105 F re qu en cy (H z) 0 -20 -40 -60 -80 (! V 2 /H z) B
Fig. 3. Sleep analysis. (A) Sleep report of a night sleep estimated by the proposed system. (B) Zoom-in view of spectral responses of Fp1 between 1:00-2:00 am. (C) Zoom-in view of the sleep report scored by the proposed system. (D) Zoom-in view of the sleep report scored by the clinical electrophysiologist.
Fig. 4. Migraine cycle. Four potential phases of migraines are pre-ictal (the period of 72 hours before a headache attack), ictal (headache attack), post-ictal (the period of 72 hours after a headache attack), and inter-ictal (the period between the post-ictal phase and the pre-ictal phase). To avoid the headache attack, predicting the EEG-based dynamic complexity from the inter-ictal phase to the pre-ictal phase is desirable.
the diagnostic criteria of the International Classification of Headache Disorders (2nd edition) (ICHD-II) and suffered from one to six attacks per month; the patients were required to keep a headache diary. The Institutional Review Board of the Taipei Veterans General Hospital approved this study. Informed consent was obtained from all subjects before testing. The EEG recording from each migraine patient was classified into one of the migraine phases (inter-ictal, pre-ictal, ictal and post-ictal) based on the headache diaries.
This experiment was carried out in a lightless room in the Taipei Veteran General Hospital. The fluorescent lamps were turned off for the duration of the test to avoid interference from a light source. Five EEG recordings were collected for each patient every 3–15 days ; for each patient, at least one test was conducted in the inter-ictal and pre-ictal phase, separately. Eyes-closed resting EEG data were collected for 3 min from the Fpz site for each recording. Highly nonlinear and non-stationary artifacts increase the standard deviation of the data, which results in a poor estimation of brain complexity; the empirical mode decomposition (EMD) method was utilized as an adaptive filter to address this problem [54, 55], and the detrended EEG data were then analyzed by MFE.
B. Results
Fig. 5B compares the MFE areas in the inter-ictal and pre-ictal phases. There was a significant difference between the inter-ictal and pre-ictal phases (FDR-adjusted p-value<0.01) when comparing the areas under the EMD-MFE curve from scale 1 to 20 (MFE Area1-20). The complexity values of the
pre-ictal phase significantly exceeded those of the inter-ictal phase in 29 patients of 40 patients (72.5% of participants). The patients who endured at least twice as many pre-ictal trials were used to establish and quantify reproducibility. In our study, eight migraine patients were selected and analyzed by the test-retest reliability measurement. The result showed that the intra-class correlation coefficient (ICC) was r=0.72 (p=0.02), supporting the reliability of elevated EEG complexity occurring in the majority of migraine patients.
The hypo- or hyper normal brain activities may be driven by impaired cognitive or pathological functions, leading to dynamic changes of brain complexity and abnormal behavioral
patterns [56]. The dynamic changes of forehead EEG complexity in migraines may be induced by the
trigeminovascular pathway and sensitization of
trigeminocervical neurons [57]. Moreover, the forehead cortical areas were found to modulate pain processing when a headache occurs [58]. The unique EEG migraine pattern confirms that monitoring the forehead EEG complexity in a resting state is a promising means of warning a patient of an imminent migraine hours in advance.
V. SCREENING DEPRESSION TREATMENT TO PREDICT
EFFICACY OF ANTIDEPRESSANT AGENTS
A. Patients and Experiment
A total of 20 participants (four men and 16 women, with a mean age of 44.3±13.0 years) were recruited among the outpatients of the Psychiatric Department of Taipei Veterans General Hospital. All subjects met the criteria for treatment resistant depression, and their initial scores were greater than or equal to 15 on the 17-item Hamilton Rating Scale for Depression (Ham-D-17) [59]. This study was approved by the Institutional Review Board at the Taipei VGH hospital. Informed consent was obtained from all subjects before they participated in the study.
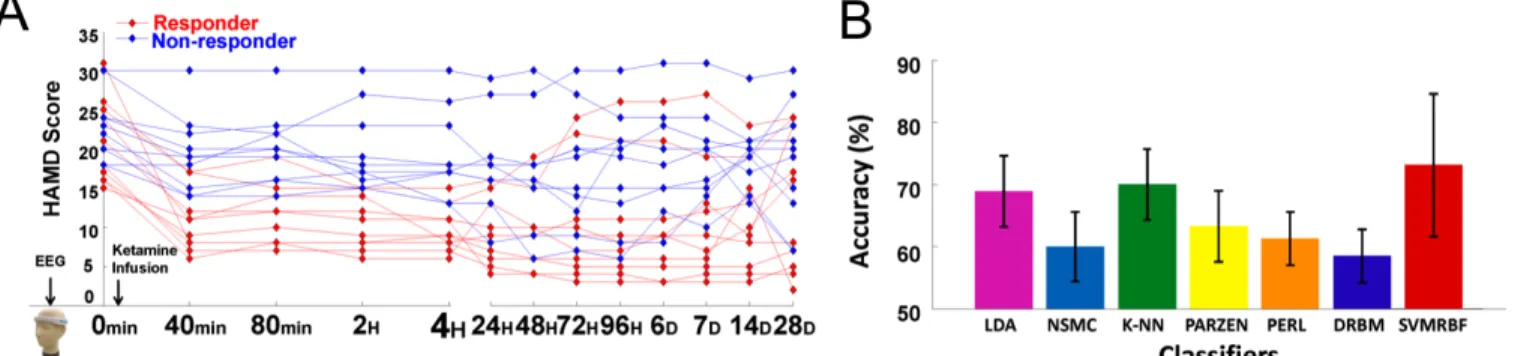
All participants received a ketamine (0.2~0.5 mg/kg) infusion. Each participant was requested to evaluate their depression a total of 13 times using Ham-D-17 scores. As shown in Fig. 6, Ham-D-17 scores were recorded at 0 min (baseline), 40 min (finished ketamine infusion), 80 min, 2 hours, 4 hours, 24 hours (2 days), 48 hours (3 days), 72 hours (4 days), 96 hours (5 days), 6 days, 7 days, 14 days, and 28 days
Fig. 6. (A) Ham-D-17 scores of 20 subjects from 0 min to 28 days. Patients with a Ham-D-17 reduction between 0 min and 4 hours of at least 50% are defined as a responder (red traces); other patients are non-responders (blue traces). (B) Classification accuracies of distinct classifiers (LDA, NSMC, k-NN, PARZEN, PERL, DRBM, and SVMRBF) in differentiating responders and non-responders.
Fig. 5. Comparison of EMD-MFE area between inter-ictal and pre-ictal phases across different scales (1-20). The green and pink lines represent the mean complexity of the inter-ictal and pre-ictal phases, respectively. The dark line represents the significant difference of the mean complexity between two phases (FDR-adjusted p-value<0.01).
after the treatment. All participants underwent neurophysiological evaluations using a four-channel (AF7, Fp1, Fp2, AF8) dry-contact EEG device with a 10 min closed-eyes recording at baseline (0 min).
B. Prediction of Ketamine Response
The ultimate goal of this research is to predict the efficacy of the ketamine treatment using baseline EEG activity recorded before taking antidepressants. Based on the effects of ketamine in depressed patients [60], depressive symptoms may be significantly improve within four hours of a ketamine infusion. Hence, a patient with a Ham-D-17 reduction of at least 50% between 0 min and 4 hours was defined as a responder; other patients were non-responders. In this study, ten subjects (7 female and 3 male, age 39.5±12.1 years) responded to treatment, and ten subjects (9 female and 1 male, age 49.0±12.6 years) did not respond to treatment.
The EEG theta activity has been suggested as a useful biomarker in major depressive disorder for prediction of treatment responses [26, 27]. To extract the treatment response of theta activity, the 10 min EEG data—with a sampling rate of 512 Hz—were transformed into the spectral power using fast Fourier transformation (FFT). The FFT window was set to 0.5 s, comprised 256 data points, and overlapped 50% with the next window. Each window of data was transformed into the frequency domain and averaged based on the number of segments, then the averaged FFT power was output. To eliminate the individual differences among power, the ratio of absolute theta power (4–7 Hz) to total power (1–12 Hz) was calculated. All relative theta powers of the four channels and the corresponding labels of responder and non-responder were used as the major features to build the prediction system.
Seven well-known classifiers were implemented, including linear discriminant analysis (LDA), k-nearest neighbors (kNN, k=3), nearest mean classifier (NMSC), discriminative restricted Boltzmann machine (DRBMC), Parzen density estimation (PARZEN), perceptron classifier (PERLC), and support vector machine with a radial basis function (SVMRBF). A three-fold cross validation was performed up to 100 times to evaluate the classification performance. Finally, the accuracies of seven classifiers in predicting the efficacy of the ketamine treatment were compared.
C. Results
Fig. 6A presents the Ham-D-17 scores of 20 subjects from 0 min to 28 days. The red and blue lines represent the Ham-D-17 scores of responders and non-responders, respectively. The Ham-D-17 at the baseline was 20.9±5.4 for responders and 22.9±4.3 for non-responders. After 4 hours, the Ham-D-17 scores of responders and non-responders were 9.7±2.8 and 19.2±5.5, respectively. Regarding the frontal EEG activity, the theta EEG powers of four frontal channels (AF8, Fp2, Fp1, AF7) of the responders was significantly lower than that of non-responders (FDR-adjusted p<0.05). The EEG results suggest that frontal theta EEG power (4–8 Hz power/1–12 Hz power) at pretreatment may be used as a biomarker to differentiate responders from non-responders.
The theta EEG powers of all channels were then used as the featured input to train a two-class classifier (responder vs. non-responder). Fig. 6B compares the classification accuracies of all trained classifiers. The RBF-based SVM classifier reached the highest accuracy of 73.5±11.2% in classifying EEG patterns of responders and non-responders, indicating that the frontal theta EEG power at baseline may be useful for predicting pretreatment responses.
VI. SUMMARY
The healthcare solutions presented in this paper are based on the usefulness of the forehead EEG measured through a novel wearable EEG device. The use of silicon-based electrodes recording EEG from the forehead allows for easy and rapid monitoring on an everyday basis. The cases presented in this work are examples of the critical contribution of forehead EEG activity in various mental processes or pathologies. In addition, we have demonstrated the feasibility of the forehead EEG in support of healthcare needs such as sleep monitoring, headache detection, and depression treatment. Forehead EEG in neuroimaging can be used in other everyday applications such as detecting the drowsiness during driving, designing brain-computer interfaces for disabled people, controlling devices and environments, and incorporating a real-time neurofeedback for enhancing cognitive functions. However, decoding frontal activity may be problematic since multiple mental processes activate the same area, which may result in unwanted and unintended actions. Hence, spatial resolution is a limitation of EEG-based systems, particularly when the EEG-based healthcare system relies on an area that is rich in subfunctions. The spatiotemporal distributions of brain activity and network behavior provide significant psychophysiological information. Therefore, it is important to image brain functional connectivity to understand brain function. There are ongoing advances in practical approaches of brain signal recording and sophisticated designs of extracting knowledge from neuro-information in the brain; home healthcare solutions are envisioned to guide to a wide range of real-life applications in the near future.
REFERENCES
[1] C.-T. Lin et al., "Noninvasive neural prostheses using mobile and wireless EEG," Proceedings of the IEEE, vol. 96, no. 7, pp. 1167-1183, 2008. [2] L.-D. Liao et al., "Biosensor technologies for augmented brain-computer
interfaces in the next decades," Proceedings of the IEEE, vol. 100, no. Special Centennial Issue, pp. 1553-1566, 2012.
[3] B. Hu et al., "Signal quality assessment model for wearable EEG sensor on prediction of mental stress," IEEE Trans Nanobioscience, vol. 14, no. 5, pp. 553-561, Jul 2015.
[4] A. Muraja-Murro et al., "Forehead EEG electrode set versus full-head scalp EEG in 100 patients with altered mental state," Epilepsy & Behavior, vol. 49, pp. 245-249, Aug 2015.
[5] B. Graimann, B. Z. Allison, and G. Pfurtscheller, Brain-Computer Interfaces: Revolutionizing Human-Computer Interaction. Springer Berlin Heidelberg, 2010.
[6] S. Myllymaa et al., "New disposable forehead electrode set with excellent signal quality and imaging compatibility," J Neurosci Methods, vol. 215, no. 1, pp. 103-109, Apr 2013.
[8] T. Akerstedt, G. Kecklund, and M. Gillberg, "Sleep and sleepiness in relation to stress and displaced work hours," Physiol Behav, vol. 92, no. 1-2, pp. 250-255, Sep 2007.
[9] J. L. Martin and A. D. Hakim, "Wrist actigraphy," Chest, vol. 139, no. 6, pp. 1514-1527, Jun 2011.
[10] J. V. Holland, W. C. Dement, and D. M. Raynal, "Polysomnography: a response to a need for improved communication," in 14th Annual Meeting of the Association for the Psychophysiological Study of Sleep, Jackson Hole, WY, 1974, pp. 121-122, 1974.
[11] I. G. Campbell, "EEG recording and analysis for sleep research," Curr Protoc Neurosci, vol. Chapter 10: unit10.2, pp. 1-21, Oct 2009.
[12] E. Werth, P. Achermann, and A. A. Borbely, "Brain topography of the human sleep EEG: antero-posterior shifts of spectral power," Neuroreport, vol. 8, no. 1, pp. 123-127, Dec 1996.
[13] E. Werth, P. Achermann, and A. A. Borbely, "Fronto-occipital EEG power gradients in human sleep," J Sleep Res, vol. 6, no. 2, pp. 102-112, Jun 1997. [14] J. C. Wu et al., "Frontal lobe metabolic decreases with sleep deprivation not totally reversed by recovery sleep," Neuropsychopharmacology, vol. 31, no. 12, pp. 2783-2792, Dec 2006.
[15] J. Perrier et al., "Specific EEG sleep pattern in the prefrontal cortex in primary insomnia," PLoS One, vol. 10, no. 1, p. e0116864, Jan 2015. [16] L. Stovner et al., "The global burden of headache: a documentation of
headache prevalence and disability worldwide," Cephalalgia, vol. 27, no. 3, pp. 193-210, 2007.
[17] S. Chokroverty and P. Sahota, Acute and Emergent Events in Sleep Disorders. Oxford University Press, 2010.
[18] T. Sand, "EEG in migraine: a review of the literature," Funct Neurol, vol. 6, no. 1, pp. 7-22, Jan-Mar 1991.
[19] G. Cosentino, B. Fierro, and F. Brighina, "From different neurophysiological methods to conflicting pathophysiological views in migraine: a critical review of literature," Clinical Neurophysiology, vol. 125, no. 9, pp. 1721-1730, 2014.
[20] Z. Cao et al., "Resting-state EEG power and coherence vary between migraine phases," The Journal of Headache and Pain, vol. 17, no. 1, p. 102, 2016.
[21] A. C. Yang et al., "Cognitive and neuropsychiatric correlates of EEG dynamic complexity in patients with Alzheimer's disease," Progress in Neuro-Psychopharmacology and Biological Psychiatry, vol. 47, pp. 52-61, 2013.
[22] C. L. McGrath et al., "Toward a neuroimaging treatment selection biomarker for major depressive disorder," JAMA Psychiatry, vol. 70, no. 8, pp. 821-9, Aug 2013.
[23] E. Tomba and G. A. Fava, "Treatment selection in depression: the role of clinical judgment," Psychiatr Clin North Am, vol. 35, no. 1, pp. 87-98, Mar 2012.
[24] B. W. Dunlop and H. S. Mayberg, "Neuroimaging-based biomarkers for treatment selection in major depressive disorder," Dialogues Clin Neurosci, vol. 16, no. 4, pp. 479-90, Dec 2014.
[25] D. G. Blazer, R. C. Kessler, K. A. McGonagle, and M. S. Swartz, "The prevalence and distribution of major depression in a national community sample: the National Comorbidity Survey," Am J Psychiatry, vol. 151, no. 7, pp. 979-86, Jul 1994.
[26] A. Baskaran, R. Milev, and R. S. McIntyre, "The neurobiology of the EEG biomarker as a predictor of treatment response in depression," Neuropharmacology, vol. 63, no. 4, pp. 507-513, 2012.
[27] S. Olbrich and M. Arns, "EEG biomarkers in major depressive disorder: discriminative power and prediction of treatment response," International Review of Psychiatry, vol. 25, no. 5, pp. 604-618, Oct 2013.
[28] M. Arns, W. H. Drinkenburg, P. B. Fitzgerald, and J. L. Kenemans, "Neurophysiological predictors of non-response to rTMS in depression," Brain Stimulation, vol. 5, no. 4, pp. 569-576, 2012.
[29] I. A. Cook et al., "Early changes in prefrontal activity characterize clinical responders to antidepressants," Neuropsychopharmacology, vol. 27, no. 1, pp. 120-131, 2002.
[30] D. V. Iosifescu et al., "Frontal EEG predictors of treatment outcome in major depressive disorder," European Neuropsychopharmacology, vol. 19, no. 11, pp. 772-777, 2009.
[31] Y.-H. Yu, S.-W. Lu, L.-D. Liao, and C.-T. Lin, "Design, fabrication, and experimental validation of novel flexible silicon-based dry sensors for electroencephalography signal measurements," IEEE Journal of Translational Engineering in Health and Medicine, vol. 2, pp. 1-7, Dec 2014.
[34] NeuroSky. (2009, 12/05). Brainwave EEG Signal. Available: http://www.neurosky.com
[35] Quasar. (December 05). DSI 10/20. Available: http://www.quasarusa.com/ [36] IMEC. (2013, December 05). Wireless Low-power Active-Electrode EEG
Headset. Available: http://www2.imec.be/
[37] C.-T. Lin, L.-D. Liao, Y.-H. Liu, I.-J. Wang, B.-S. Lin, and J.-Y. Chang, "Novel dry polymer foam electrodes for long-term EEG measurement," Biomedical Engineering, IEEE Transactions on, vol. 58, no. 5, pp. 1200-1207, 2011.
[38] L. Chin-Teng, L. Lun-De, L. Yu-Hang, I. J. Wang, L. Bor-Shyh, and C. Jyh-Yeong, "Novel Dry Polymer Foam Electrodes for Long-Term EEG Measurement," IEEE Transactions on Biomedical Engineering, vol. 58, no. 5, pp. 1200-1207, 2011.
[39] C. T. Lin et al., "Wireless and wearable EEG system for evaluating driver vigilance," IEEE Trans Biomed Circuits Syst, vol. 8, no. 2, pp. 165-176, Apr 2014.
[40] D. Campillo, R. Guardarrama, R. Gonzalez, J. Rodriguez, and D. Jimenez, "A real time ECG preprocessing system based on ADS1298," in Computing in Cardiology Conference, Zaragoza, Spain, 2013, pp. 947-950: IEEE.
[41] A. Delorme and S. Makeig, "EEGLAB: an open source toolbox for analysis of single-trial EEG dynamics including independent component analysis," Journal of Neuroscience Methods, vol. 134, no. 1, pp. 9-21, 2004.
[42] J. Minguillon, M. A. Lopez-Gordo, and F. Pelayo, "Trends in EEG-BCI for daily-life: Requirements for artifact removal," Biomedical Signal Processing and Control, vol. 31, pp. 407-418, 2017.
[43] T. Akerstedt, G. Kecklund, and M. Gillberg, "Sleep and sleepiness in relation to stress and displaced work hours," Physiology & behavior, vol. 92, no. 1-2, pp. 250-255, 2007.
[44] A. Rechtschaffen and A. Kales, A Manual of Standardized Terminology, Techniques, and Scoring System for Sleep Stages of Human Subjects. Washington DC: Washington Public Health Service, 1968.
[45] C. Iber, S. Ancoli-Israel, A. Chesson, and S. Quan, "The AASM manual for the scoring of and associated events: Rules, terminology and technical specifications," American Academy of Sleep Medicine, Westchester, Illinois2007.
[46] C.-S. Huang, C.-L. Lin, L.-W. Ko, S.-Y. Liu, T.-P. Su, and C.-T. Lin, "Knowledge-based identification of sleep stages based on two forehead electroencephalogram channels," (in English), Frontiers in Neuroscience, Original Research vol. 8, pp. 1-12, Sept 2014.
[47] M. E. Tipping, "Sparse bayesian learning and the relevance vector machine," J Mach Learn Res, vol. 1, pp. 211-244, 2001.
[48] J. Virkkala, J. Hasan, A. Varri, S. L. Himanen, and K. Muller, "Automatic sleep stage classification using two-channel electro-oculography," J Neurosci Methods, vol. 166, no. 1, pp. 109-115, Oct 2007.
[49] J. Schoenen, "Migraine Without Aura," in Encyclopedia of Pain: Springer, 2013, pp. 1866-1870.
[50] R. Lev, Y. Granovsky, and D. Yarnitsky, "Enhanced pain expectation in migraine: EEG-based evidence for impaired prefrontal function," Headache, vol. 53, no. 7, pp. 1054-1070, Jul 2013.
[51] Y. S. Koo et al., "Reduced frontal P3a amplitude in migraine patients during the pain-free period," Journal of Clinical Neurology, vol. 9, no. 1, pp. 43-50, 2013.
[52] G.-l. Xiong, L. Zhang, H.-s. Liu, H.-j. Zou, and W.-z. Guo, "A comparative study on ApEn, SampEn and their fuzzy counterparts in a multiscale framework for feature extraction," Journal of Zhejiang University SCIENCE A, vol. 11, no. 4, pp. 270-279, Apr 2010.
[53] W. Chen, J. Zhuang, W. Yu, and Z. Wang, "Measuring complexity using FuzzyEn, ApEn, and SampEn," Medical Engineering & Physics, vol. 31, no. 1, pp. 61-68, Jan 2009.
[54] M. Costa et al., "Noise and poise: enhancement of postural complexity in the elderly with a stochastic-resonance–based therapy," Europhysics Letters, vol. 77, no. 6, p. 68008, Mar 2007.
[55] N. E. Huang et al., "The empirical mode decomposition and the Hilbert spectrum for nonlinear and non-stationary time series analysis," in Proceedings of the Royal Society of London A: Mathematical, Physical and Engineering Sciences, 1998, vol. 454, no. 1971, pp. 903-995: The Royal Society.
[56] D. S. Bassett and M. S. Gazzaniga, "Understanding complexity in the human brain," Trends in cognitive sciences, vol. 15, no. 5, pp. 200-209, 2011.
[57] T. Bartsch and P. J. Goadsby, "The trigeminocervical complex and migraine: current concepts and synthesis," Current pain and headache reports, vol. 7, no. 5, pp. 371-376, 2003.
[58] S. K. Afridi et al., "A positron emission tomographic study in spontaneous migraine," Archives of neurology, vol. 62, no. 8, pp. 1270-1275, 2005. [59] M. Hamilton, "Development of a rating scale for primary depressive
illness," British journal of social and clinical psychology, vol. 6, no. 4, pp. 278-296, 1967.
[60] R. M. Berman et al., "Antidepressant effects of ketamine in depressed patients," Biological psychiatry, vol. 47, no. 4, pp. 351-354, Feb 2000.