*To whom correspondence should be addressed.
A Proportionate Cancer Morbidity Ratio Study of
Workers Exposed to Chlorinated Organic Solvents in
Taiwan
Yung-Ming CHANG
1, 2, Chi-Fu TAI
2, Ruey S LIN
3, Sweo-Chung YANG
2,
Chiou-Jong CHEN
2, Tung-Sheng SHIH
2and Saou-Hsing LIOU
1, 4*
1Graduate Institute of Life Sciences, National Defense Medical Center, 161 Ming-Chun East Road, Sec. 6,
Nei-Hu, Taipei, Taiwan, 114, R.O.C.
2Institute of Occupational Safety and Health, Council of Labor Affairs, 99, Lane 407, Heng-Ke Rd., Shi-Jr,
Taipei, Taiwan, 221, R.O.C.
3College of Public Health, National Taiwan University, 1, Jen-Ai Rd., Sec. 1, Taipei, Taiwan, 100, R.O.C. 4School of Public Health, National Defense Medical Center, 161 Ming-Chun East Road, Sec. 6, Nei-Hu, Taipei,
Taiwan, 114, R.O.C.
Received May 17, 2002 and accepted January 17, 2003
Abstract: We initiated an investigation to examine the possible association between the cancer risk and the chlorinated organic solvents exposure in an electronic factory. To obtain information on the incidence of the various types of cancer among the exposed and comparison groups, the cohort populations were merged with the National Mortality Database, the National Cancer Registry Database, and the National Insurance Hospitalization Database from the Department of Health (DOH), as well as the Labor Insurance Hospitalization Database from the Bureau of Labor Insurance (BLI). The proportionate cancer morbidity ratio (PCMR) was used to estimate the cancer risk of the exposed workers in comparison with either textile workers or electronics workers. After adjustment for age, only the PCMR for breast cancer in the exposed female employees was significantly elevated when compared with the two comparison groups. The increased risk of breast cancer was mainly found in the category of 1989-1997 for year of diagnosis when stratified by calendar year. However, there was no dose-response relationship between female breast cancer risk and duration of employment. Although some PCMRs for the cancers were also increased in the exposed group, female breast cancer was consistently increased when compared with both textile and electronics comparison groups using different exclusion criteria. The results obtained in the present study suggest a possible association between exposure to chlorinated organic solvents and female breast cancer. Since this association has never been reported in the previous studies, further study is needed to clarify the association.
Key words: Chlorinated organic solvents, Proportionate cancer morbidity ratio, Breast cancer
Introduction
Trichloroethylene (TCE) and tetrachloroethylene(PCE) are the main chlorinated hydrocarbon solvents used in dry
cleaning, electronics processing, and metal degreasing1). Results of animal experiments have shown that TCE and PCE induced liver, lung carcinoma in mice, and renal cell carcinoma in rats. Although the results obtained from human studies have been largely inconclusive, epidemiological researches have found elevated risks of cancers among
workers employed in industries using these two chemicals. The types of cancer found to be at elevated levels include liver2–5), cervical2, 5, 6), bladder5–9), lung2, 6, 10), leukemia2, 7), and Hodgkin’s disease6). Based on the evidence in experimental animals and humans, TCE and PCE are considered to be probably carcinogenic to humans (Group 2A) by the International Agency for Research on Cancer11). The other health hazards related to the chlorinated organic solvents included anesthesia, respiratory tract irritation, dermatitis, neurobehavioral dysfunction, hepatocellular damages, and renal tubular dysfunction.
The improper disposal of waste materials of chlorinated organic solvents at an electronics factory was reported in June 1998. The electronics factory began operations in February 1968 and shut down in 1992. The products of this index factory included the electronics parts, main boards and all kinds of integrated circuits for black-and-white and color television sets. The dumping site, located in the northern Taiwan, was found to have organic solvents contamination of the underground water. The Taiwan Environmental Protection Administration (EPA) inspected the groundwater near the contaminated plant in August 1994 and verified that the water in some drilled wells had been polluted by TCE and PCE12). The ranges of chemical concentrations detected in the groundwater at the contaminated site were reported in our previous study13). The solvents most frequently detected in the groundwater with high concentrations were PCE, TCE and vinyl chloride (VC). The average concentrations of PCE and TCE were about 10 times higher than the groundwater quality standard.
Since the former employers refused to provide personnel and industrial hygiene information, records gathered from several sources revealed that three plants of this index electronics factory have used chlorinated organic solvents. All employees in this index factory were potentially exposed to vapors of chlorinated organic solvents. The Institute of Occupational Safety and Health (IOSH) of the Council of Labor Affairs, Taiwan, initiated an investigation to examine the possible association between the incidence of cancer in workers and the chlorinated organic solvents exposure in their working environment. Cohort database of this index electronics company employees (exposed group) and two comparison groups consisting of workers employed in either the textile or the electronics industries were established13). This paper presents the cancer risks of the index electronics company employees assessed by proportionate cancer morbidity ratio (PCMR).
Materials and Methods
Manufacturing processes and industrial hygiene information
Since the shutdown of this factory was as early as 1992, it is very hard to reconstruct the related information. We can only summarize from the inspection information done by the Labor Inspection Department (form 1975 to 1991), the import/export statistics of this company provided by the Bureau of International Trade, Department of Economics (from 1974 to 1989), as well as the interviews with former employees.
This index factory can be divided into three plants as defined by the products and manufacturing process. The main product from plant 1 was electronics remote controllers for televisions. The sources of contamination were from the soldering, wire cutting, cleaning and assembling operations. The organic solvents used included isopropyl alcohol, ethyl alcohol, propanol, methyl ethyl alcohol, acetone, toluene, trichloroethane and tetrachloroethylene. The major products produced from plant 2 were solid state and IC products. Although the detailed manufacturing process could not be obtained, the operation process required electroplating and cleaning of the parts. The sources of pollution were from cleaning, electroplating and semiconductor packaging. The organic solvents used in plant 2 included propanol, methyl ethyl alcohol, dichloromethane, dichloroethylene, etc. The major product of plant 3 was main board of color television. The sources of pollution were from soldering and cleaning operations using organic solvents such as dichloromethane, methyl ethyl alcohol, toluene, isopropanol, etc.
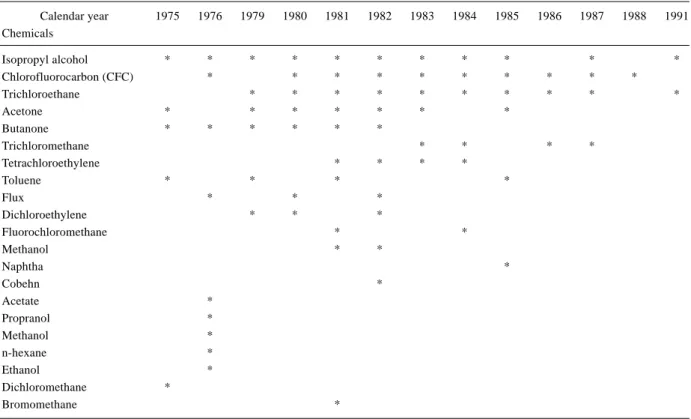
Exposure assessment
The chemicals used in these factories provided by the Department of Labor Inspection, the Bureau of International Trade, and the recall of the former industrial hygienists were listed in Table 1. The documents obtained from the Bureau of International Trade, the Labor Inspection Department and the former manager only covered the period after 1975. The available information showed that tetrachloroethylene (PCE) was not used as solvent in this index factory until 1981. Trichloroethylene (TCE) was not used between 1975 and 1991 as a solvent in this factory according to the records and recall of the hygienists (Table 1). However, whether PCE or TCE were used between 1968 and 1975 were not available. This period was considered to be the most influential period by potential usage of harmful substances and potential heavy pollution in this factory. Since the
employers refused to provide industrial hygiene information, the concentrations of chlorinated organic solvents detected in the workplace were not available.
Description of the study cohort
Cohorts of the exposed and comparison groups were retrieved from the Bureau of Labor Insurance (BLI) computerized database from January 1, 1978 through December 31, 1997. Data provided by BLI included working histories at the different factories and the changes of insurance status from 1978 to 1997. To insure the comparability in the gender distribution between exposed and comparison cohorts, the comparison cohorts were selected from the female predominant industries. Members of one comparison group were chosen from workers employed in the textile industries, while those of another comparison group were selected from the electronics industries other than the index factory. To insure uniformity of regional characteristics, the comparison groups were only chosen from factories located in the same county as the index factory. The cohort numbers of the exposed group, textile comparison group and electronics comparison group were 52,835, 25,596, and 17,960, respectively.
Ascertainment of cancer cases among the exposed and comparison cohorts
In order to insure the complete ascertainment of the cancer cases, the database for the exposed and comparison worker cohorts was both linked with the National Mortality Database (1985–1997), the National Cancer Registry Database (1979– 1997), and the National Insurance Hospitalization Database (1995–1997), all of which are maintained by DOH. The cohorts were also linked with the Labor Hospitalization Database (1985–1994) furnished by the BLI. This linkage was used to determine the fatal and incident cancer cases in the both exposed and comparison groups. The Cancer Registry Database, Labor Insurance Hospitalization Databases, and National Health Insurance Hospitalization Databases contained detailed information including the diagnosis of cancers, the date on which a worker first visited a doctor for a specific cancer, and the date of the first hospitalization for a specific cancer.
Calculation for duration of employment
Only the members of the exposed group still employed after 1978 were included in this PCMR analysis. The duration of employment was defined as the period between the inception of labor insurance coverage and the termination of such coverage. If a worker changed employment at a Table 1. Exposed chemicals traced in this factory
Calendar year 1975 1976 1979 1980 1981 1982 1983 1984 1985 1986 1987 1988 1991 Chemicals Isopropyl alcohol * * * * * * * * * * * Chlorofluorocarbon (CFC) * * * * * * * * * * Trichloroethane * * * * * * * * * * Acetone * * * * * * * Butanone * * * * * * Trichloromethane * * * * Tetrachloroethylene * * * * Toluene * * * * Flux * * * Dichloroethylene * * * Fluorochloromethane * * Methanol * * Naphtha * Cobehn * Acetate * Propranol * Methanol * n-hexane * Ethanol * Dichloromethane * Bromomethane *
specified factory, his or her total duration of employment was estimated as the sum of all periods during which labor insurance coverage was in effect. According to the statement of senior workers, this index factory began to lay off employees in early 1992 and most of them were dismissed by July 31, 1992. If date of joining the insurance were missing but the date of withdrawal from insurance was complete (n=6,509 for the exposed group and n=1,233 and 344 for the comparison groups, respectively), we assumed that the date of joining the insurance was January 31, 1973, as the median between the first day of operation for the electronics factory (1968) and January 1, 1978. If the date of joining the insurance was complete but the date of withdrawal from insurance was missing (n=5,246 for the exposed group and n=178 and 3,322 for the comparison groups, respectively), the duration of employment was assumed to be one half of the period from the date of joining the insurance to July 31, 1992. The same assumptions were applied in calculating the duration of employment for the comparison cohorts. Statistical analysis
The Statistical Analysis System (SAS) version 6.12 was used for data processing. The PCMR was used to estimate the association between occupational chlorinated organic solvents exposure and cancer risk. The PCMRs were calculated using the procedures by Mantel and Haenszel as well as Bailar14, 15). The PCMRs were stratified by gender. PCMRs for male and female subjects were reported separately. All PCMRs analyses were adjusted for age distribution. In addition, the PCMRs were stratified by calendar years and by duration of employment for a dose-response trend analysis. The Chi-squared extension test was used to evaluate the significance of PCMR trends.
In the data analysis, we analyzed the whole data set without any exclusion at first. Then the exclusion criteria of duration of employment for less than 3 months were added to the PCMR analysis to exclude the short-term student observers in this index factory. Furthermore, a latency (from the time when starting to work to either the end of follow-up or time of contracting a cancer or death) assumption of 5 years and 10 years were added in the PCMR analysis.
Results
Data linking and characteristics of cancer cases
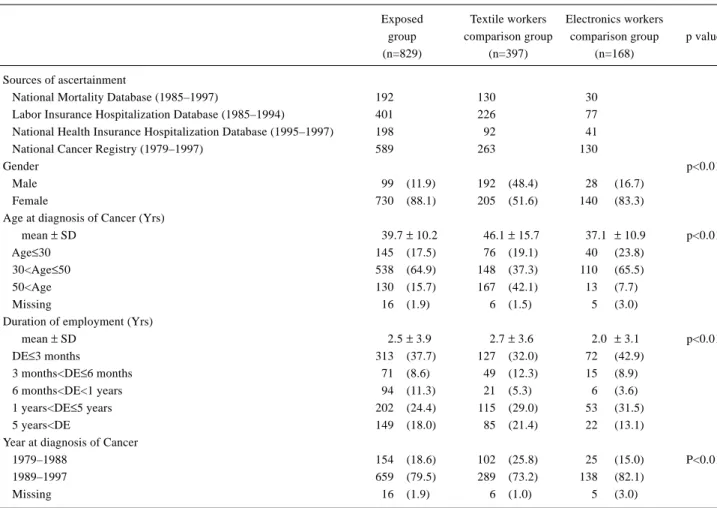
After linking the databases, a total of 829 cases of cancer were counted in the exposed group. In the textile, and electronics comparison groups, the numbers of cancer cases were 397 and 168, respectively. The distribution of
characteristics among cancer cases is shown in Table 2. Most of the cancer cases were ascertained from National Cancer Registry, followed by Labor Insurance Hospitalization Database. Female cases were dominant in the sex distribution. Most of the cancers were diagnosed in workers aged between 30 to 50 years. Most of the workers who developed cancer were employed for less than 3 months, followed by between 1 and 5 years of employment, respectively. Most of these cancer cases were diagnosed after 1989.
There were some records lacking of the date for the commencement of medical care (n=16, 4, and 2 for the exposed group, textile, and electronics comparison groups, respectively). In addition, there were workers with cancer who had inception dates of labor insurance coverage later than the dates on which medical care began (n=3, 11, and 11 for the exposed group, textile, and electronics comparison groups, respectively). These ineligible cancer cases were excluded in the data analysis of applying exclusion criteria or dose-response analysis on duration of employment and calendar year. After exclusion of cases with ineligible or inadequate data due to lacking of the date of starting medical care or due to the inception date of insurance coverage being later than the date of the first visit to a doctor, the numbers of cancer cases turned out to be 810, 380, and 152, respectively.
The PCMR analysis was based on entire cancer cases without any exclusion at first. Further analysis was applied with exclusion criteria of minimal duration of employment (3 months) and latency period (5 and 10 years).
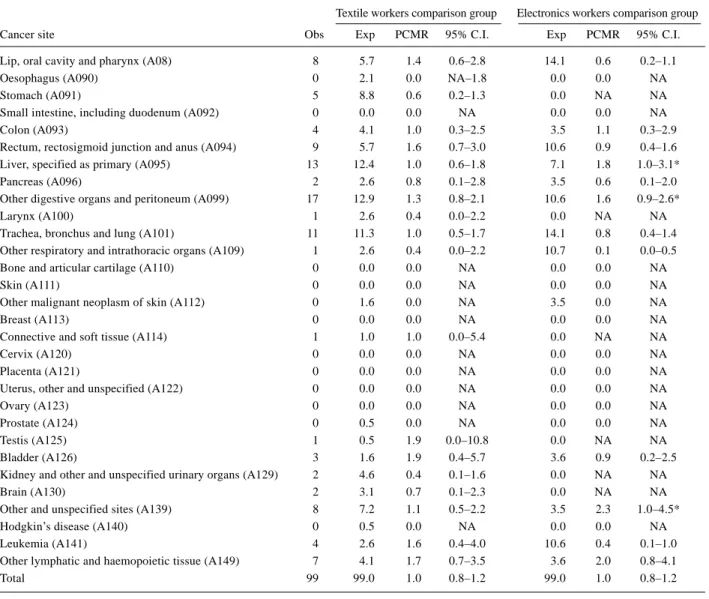
PCMR analysis on total cancer cases without any exclusion (Table 3, 4)
The results for male and female PCMRs are shown separately in Table 3 and Table 4. For the male workers, no PCMR was significantly increased when compared with the textile comparison group. Liver cancer (1.8, 95% C.I. 1.0– 3.1), other digestive organ cancer (1.6, 95% C.I. 0.9–2.6), and unspecified cancer (2.3, 95% C.I. 1.0–4.5) in the exposed group were borderline significantly increased when compared with the electronics comparison group.
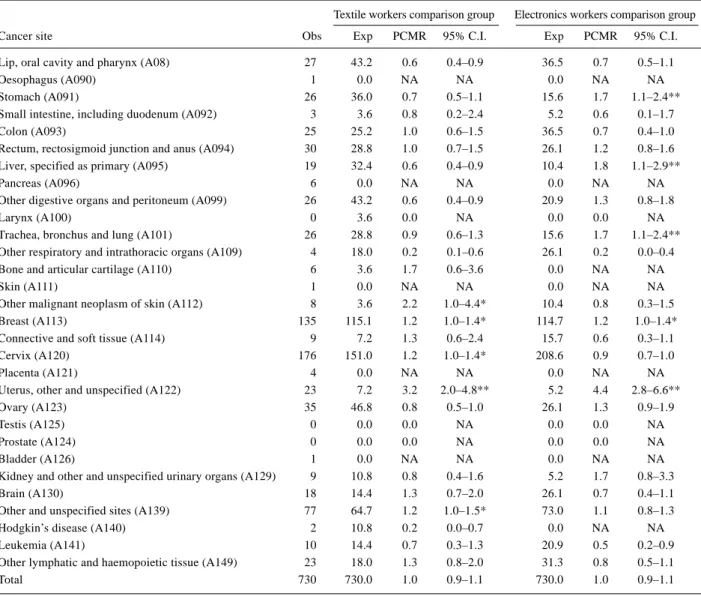
For the female workers, uterine cancer (3.2, 95% C.I. 2.0– 4.8) in the exposed group was significantly increased when compared with the textile comparison group. The PCMRs of breast cancer (1.2, 95% C.I. 1.0–1.4), cervix cancer (1.2, 95% C.I. 1.0–1.4), other malignant neoplasms of the skin (2.2, 95% C.I. 1.0–4.4), and unspecified cancer (1.2, 95% C.I. 1.0–1.5) were borderline significant when compared with the textile comparison group. When compared with
the electronics comparison group, uterine cancer (4.4, 95% C.I. 2.8–6.6), liver cancer (1.8, 95% C.I. 1.1–2.9), and lung cancer (1.7, 95% C.I. 1.1–2.4) were significantly increased in the exposed group. The incidence of breast cancer (1.2, 95% C.I. 1.0–1.4) was borderline significant.
PCMR analysis on cancer cases with exclusion of employment less than 3 months
Since the exposed and comparison factories provide Technological School students for three-month’s practice, the proportion of student observers and employees employed for less than 3 months was as high as 44 per cent in these cohorts (Data not shown). Exclusion of these short-term employees was applied to reduce the bias. After adjustment for age and the cancer cases who had been employed no longer than 3 months were excluded, the significantly increased PCMRs for female cancers are given in Table 5. None of the PCMRs among male employees was significantly increased. The PCMRs for female other and unspecified cancers were significantly increased in the exposed group
when compared with the textile comparison group. The PCMRs for colon cancer (2.80, 95% C.I. 1.66–4.43), other digestive organs and peritoneum cancer (2.33, 95% C.I. 1.31– 3.85), and breast cancer (2.27, 95% C.I. 1.80–2.82) among female employees were significantly increased in the exposed group when compared with the electronics comparison group. PCMR analysis on cancer cases with exclusion of employment less than 3 months and the latent period less than 5 years
After adjustment for age and the cancer cases who had been employed no longer than 3 months as well as the latency no longer than 5 years were excluded, the increased PCMRs for female cancers were listed in Table 5. With comparison to the textile comparison group, only rectal cancer (2.87, 95% C.I. 1.05–6.24) was significantly increased in males. For females, the PCMRs of breast cancer (1.50, 95% C.I. 1.18–1.88) and other unspecified cancer (1.45, 95% C.I. 1.06– 1.94) were significantly increased. With comparison to the electronics comparison group, the PCMRs for male liver Table 2. Distribution of characteristics among cancer cases
Exposed Textile workers Electronics workers
group comparison group comparison group p value
(n=829) (n=397) (n=168)
Sources of ascertainment
National Mortality Database (1985–1997) 192 130 30
Labor Insurance Hospitalization Database (1985–1994) 401 226 77 National Health Insurance Hospitalization Database (1995–1997) 198 92 41
National Cancer Registry (1979–1997) 589 263 130
Gender p<0.01
Male 99 (11.9) 192 (48.4) 28 (16.7)
Female 730 (88.1) 205 (51.6) 140 (83.3)
Age at diagnosis of Cancer (Yrs)
mean ± SD 39.7± 10.2 46.1± 15.7 37.1 ± 10.9 p<0.01
Age≤30 145 (17.5) 76 (19.1) 40 (23.8)
30<Age≤50 538 (64.9) 148 (37.3) 110 (65.5)
50<Age 130 (15.7) 167 (42.1) 13 (7.7)
Missing 16 (1.9) 6 (1.5) 5 (3.0)
Duration of employment (Yrs)
mean ± SD 2.5± 3.9 2.7± 3.6 2.0 ± 3.1 p<0.01 DE≤3 months 313 (37.7) 127 (32.0) 72 (42.9) 3 months<DE≤6 months 71 (8.6) 49 (12.3) 15 (8.9) 6 months<DE<1 years 94 (11.3) 21 (5.3) 6 (3.6) 1 years<DE≤5 years 202 (24.4) 115 (29.0) 53 (31.5) 5 years<DE 149 (18.0) 85 (21.4) 22 (13.1)
Year at diagnosis of Cancer
1979–1988 154 (18.6) 102 (25.8) 25 (15.0) P<0.01
1989–1997 659 (79.5) 289 (73.2) 138 (82.1)
Missing 16 (1.9) 6 (1.0) 5 (3.0)
cancer (2.40, 95% C.I. 1.03–4.73), female colon cancer (2.16, 95% C.I. 1.26–3.46), female other digestive organs and peritoneum cancer (1.91, 95% C.I. 1.07–3.15), as well as female breast cancer (1.88, 95% C.I. 1.48–2.36) were significantly increased in the exposed group.
PCMR analysis on cancer cases with exclusion of employment less than 3 months and the latent period less than 10 years
With comparison to the textile comparison group, the PCMRs for lip, oral cavity and pharynx cancer (3.52, 95% C.I. 1.13–8.22) and other lymphatic and haemopoietic tissue cancer (9.52, 95% C.I. 2.56–24.37) in males were significantly increased The PCMRs for lung cancer (3.00, 95% C.I. 1.64–5.03), breast cancer (1.57, 95% C.I. 1.21–
1.99), and other unspecified cancers (2.08, 95% C.I. 1.45– 2.89) in females were significantly increased with comparison to the textile comparison group. With comparison to the electronics comparison group, only female breast cancer (1.33, 95% C.I. 1.03–1.70) was significantly increased. Dose-response analysis of PCMR on duration of employment and calendar year
None of the above-mentioned cancers showed a dose-response relationship with duration of employment (Table 6) with exclusion of employment no longer than 3 months. The PCMRs of female breast cancer were 2.9, 3.9, and 1.3, respectively, for the duration of employment of less than 1 year, between 1 and 5 years, and more than 5 years.
When the cancer cases who had been employed no longer Table 3. PCMR for male cancers without any exclusion criteria
Textile workers comparison group Electronics workers comparison group
Cancer site Obs Exp PCMR 95% C.I. Exp PCMR 95% C.I.
Lip, oral cavity and pharynx (A08) 8 5.7 1.4 0.6–2.8 14.1 0.6 0.2–1.1
Oesophagus (A090) 0 2.1 0.0 NA–1.8 0.0 0.0 NA
Stomach (A091) 5 8.8 0.6 0.2–1.3 0.0 NA NA
Small intestine, including duodenum (A092) 0 0.0 0.0 NA 0.0 0.0 NA
Colon (A093) 4 4.1 1.0 0.3–2.5 3.5 1.1 0.3–2.9
Rectum, rectosigmoid junction and anus (A094) 9 5.7 1.6 0.7–3.0 10.6 0.9 0.4–1.6 Liver, specified as primary (A095) 13 12.4 1.0 0.6–1.8 7.1 1.8 1.0–3.1*
Pancreas (A096) 2 2.6 0.8 0.1–2.8 3.5 0.6 0.1–2.0
Other digestive organs and peritoneum (A099) 17 12.9 1.3 0.8–2.1 10.6 1.6 0.9–2.6*
Larynx (A100) 1 2.6 0.4 0.0–2.2 0.0 NA NA
Trachea, bronchus and lung (A101) 11 11.3 1.0 0.5–1.7 14.1 0.8 0.4–1.4 Other respiratory and intrathoracic organs (A109) 1 2.6 0.4 0.0–2.2 10.7 0.1 0.0–0.5
Bone and articular cartilage (A110) 0 0.0 0.0 NA 0.0 0.0 NA
Skin (A111) 0 0.0 0.0 NA 0.0 0.0 NA
Other malignant neoplasm of skin (A112) 0 1.6 0.0 NA 3.5 0.0 NA
Breast (A113) 0 0.0 0.0 NA 0.0 0.0 NA
Connective and soft tissue (A114) 1 1.0 1.0 0.0–5.4 0.0 NA NA
Cervix (A120) 0 0.0 0.0 NA 0.0 0.0 NA
Placenta (A121) 0 0.0 0.0 NA 0.0 0.0 NA
Uterus, other and unspecified (A122) 0 0.0 0.0 NA 0.0 0.0 NA
Ovary (A123) 0 0.0 0.0 NA 0.0 0.0 NA
Prostate (A124) 0 0.5 0.0 NA 0.0 0.0 NA
Testis (A125) 1 0.5 1.9 0.0–10.8 0.0 NA NA
Bladder (A126) 3 1.6 1.9 0.4–5.7 3.6 0.9 0.2–2.5
Kidney and other and unspecified urinary organs (A129) 2 4.6 0.4 0.1–1.6 0.0 NA NA
Brain (A130) 2 3.1 0.7 0.1–2.3 0.0 NA NA
Other and unspecified sites (A139) 8 7.2 1.1 0.5–2.2 3.5 2.3 1.0–4.5*
Hodgkin’s disease (A140) 0 0.5 0.0 NA 0.0 0.0 NA
Leukemia (A141) 4 2.6 1.6 0.4–4.0 10.6 0.4 0.1–1.0
Other lymphatic and haemopoietic tissue (A149) 7 4.1 1.7 0.7–3.5 3.6 2.0 0.8–4.1
Total 99 99.0 1.0 0.8–1.2 99.0 1.0 0.8–1.2
than 3 months were excluded, the PCMR for colon and breast cancers among female employees showed an increased trends with calendar year (Table 6). The increased risk of breast cancer was mainly found in the calendar year from 1989 to 1997.
Discussion
This study found that only the PCMR for breast cancer among female workers were consistently higher in the exposed workers when compared with the two comparison group workers. No consistent finding could be drawn for the male workers. In addition, no apparent dose-response relationship on the duration of employment was shown, even for female breast cancer, in this study. This study suggests Table 4. PCMR for female cancers without any exclusion criteria
Textile workers comparison group Electronics workers comparison group
Cancer site Obs Exp PCMR 95% C.I. Exp PCMR 95% C.I.
Lip, oral cavity and pharynx (A08) 27 43.2 0.6 0.4–0.9 36.5 0.7 0.5–1.1
Oesophagus (A090) 1 0.0 NA NA 0.0 NA NA
Stomach (A091) 26 36.0 0.7 0.5–1.1 15.6 1.7 1.1–2.4**
Small intestine, including duodenum (A092) 3 3.6 0.8 0.2–2.4 5.2 0.6 0.1–1.7
Colon (A093) 25 25.2 1.0 0.6–1.5 36.5 0.7 0.4–1.0
Rectum, rectosigmoid junction and anus (A094) 30 28.8 1.0 0.7–1.5 26.1 1.2 0.8–1.6 Liver, specified as primary (A095) 19 32.4 0.6 0.4–0.9 10.4 1.8 1.1–2.9**
Pancreas (A096) 6 0.0 NA NA 0.0 NA NA
Other digestive organs and peritoneum (A099) 26 43.2 0.6 0.4–0.9 20.9 1.3 0.8–1.8
Larynx (A100) 0 3.6 0.0 NA 0.0 0.0 NA
Trachea, bronchus and lung (A101) 26 28.8 0.9 0.6–1.3 15.6 1.7 1.1–2.4** Other respiratory and intrathoracic organs (A109) 4 18.0 0.2 0.1–0.6 26.1 0.2 0.0–0.4
Bone and articular cartilage (A110) 6 3.6 1.7 0.6–3.6 0.0 NA NA
Skin (A111) 1 0.0 NA NA 0.0 NA NA
Other malignant neoplasm of skin (A112) 8 3.6 2.2 1.0–4.4* 10.4 0.8 0.3–1.5
Breast (A113) 135 115.1 1.2 1.0–1.4* 114.7 1.2 1.0–1.4*
Connective and soft tissue (A114) 9 7.2 1.3 0.6–2.4 15.7 0.6 0.3–1.1
Cervix (A120) 176 151.0 1.2 1.0–1.4* 208.6 0.9 0.7–1.0
Placenta (A121) 4 0.0 NA NA 0.0 NA NA
Uterus, other and unspecified (A122) 23 7.2 3.2 2.0–4.8** 5.2 4.4 2.8–6.6**
Ovary (A123) 35 46.8 0.8 0.5–1.0 26.1 1.3 0.9–1.9
Testis (A125) 0 0.0 0.0 NA 0.0 0.0 NA
Prostate (A124) 0 0.0 0.0 NA 0.0 0.0 NA
Bladder (A126) 1 0.0 NA NA 0.0 NA NA
Kidney and other and unspecified urinary organs (A129) 9 10.8 0.8 0.4–1.6 5.2 1.7 0.8–3.3
Brain (A130) 18 14.4 1.3 0.7–2.0 26.1 0.7 0.4–1.1
Other and unspecified sites (A139) 77 64.7 1.2 1.0–1.5* 73.0 1.1 0.8–1.3
Hodgkin’s disease (A140) 2 10.8 0.2 0.0–0.7 0.0 NA NA
Leukemia (A141) 10 14.4 0.7 0.3–1.3 20.9 0.5 0.2–0.9
Other lymphatic and haemopoietic tissue (A149) 23 18.0 1.3 0.8–2.0 31.3 0.8 0.5–1.1
Total 730 730.0 1.0 0.9–1.1 730.0 1.0 0.9–1.1
Obs: observed; Exp: expected; NA: not applicable; ** p<0.05; * p<0.1.
a possible association might exist between exposure to chlorinated organic solvents and female breast cancer, but the results should be interpreted cautiously because of the heterogeneity of exposure among workers in this large factory. This association has never been reported in the previous studies, further studies are needed to clarify the association.
Breast cancer is the most common tumor among Chinese women, and the incidence rate is rapidly increasing16). Some studies have suggested that the high socioeconomic status, i.e. occupational status, was related to high risks of breast cancer17–21). One of the most consistent results of previous studies was that increased risk of breast cancer was found among women with professional and managerial occupations21–28). Increased risk of breast cancer has also
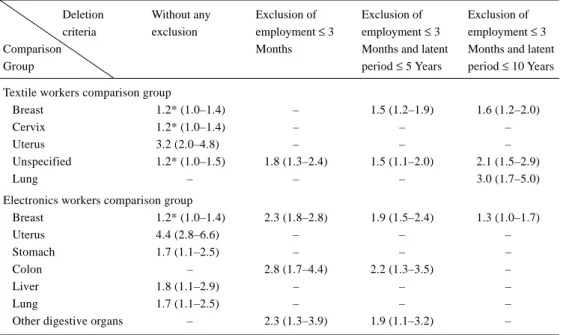
Table 5. Significantly increased PCMRs among female workers using various exclusion criteria of minimal duration of employment and latent period
Deletion Without any Exclusion of Exclusion of Exclusion of criteria exclusion employment ≤ 3 employment ≤ 3 employment ≤ 3
Comparison Months Months and latent Months and latent
Group period ≤ 5 Years period ≤ 10 Years
Textile workers comparison group
Breast 1.2* (1.0–1.4) – 1.5 (1.2–1.9) 1.6 (1.2–2.0)
Cervix 1.2* (1.0–1.4) – – –
Uterus 3.2 (2.0–4.8) – – –
Unspecified 1.2* (1.0–1.5) 1.8 (1.3–2.4) 1.5 (1.1–2.0) 2.1 (1.5–2.9)
Lung – – – 3.0 (1.7–5.0)
Electronics workers comparison group
Breast 1.2* (1.0–1.4) 2.3 (1.8–2.8) 1.9 (1.5–2.4) 1.3 (1.0–1.7) Uterus 4.4 (2.8–6.6) – – – Stomach 1.7 (1.1–2.5) – – – Colon – 2.8 (1.7–4.4) 2.2 (1.3–3.5) – Liver 1.8 (1.1–2.9) – – – Lung 1.7 (1.1–2.5) – – –
Other digestive organs – 2.3 (1.3–3.9) 1.9 (1.1–3.2) –
*borderline significance; ( ): represents 95% confidence interval.
Table 6. Dose-response relations of PCMRs on female cancers by duration of employment and calendar year using electronic workers as comparison group with exclusion of employees for less than 3 months
DE ≤ 1 year 1 year < DE ≤ 5 years 5 years < DE
Cancer site Obs Exp PCMR Obs Exp PCMR Obs Exp PCMR sig
Colon (A093) 7 7.8 0.9 3 0.0 0.0 8 0.0 NA
Liver, specified as primary (A095) 4 0.0 NA 5 5.3 0.9 2 0.0 NA
Breast (A113) 23 7.8 2.9 36 9.2 3.9 21 16.7 1.3
Cervix (A120) 43 22.8 1.9 36 69.3 0.5 26 7.3 3.6
Uterus, other and unspecified (A122) 4 0.0 NA 7 0.0 NA 1 0.0 NA
Ovary (A123) 7 0.0 NA 8 0.0 NA 4 16.7 0.2
Other and unspecified sites (A139) 18 15.6 1.2 20 41.0 0.5 12 7.3 1.6
Calendar time 1979–1988 1989–1997
Cancer site Obs Exp PCMR Obs Exp PCMR sig
Colon (A093) 3 0.0 NA 15 5.7 2.7 *
Liver, specified as primary (A095) 2 0.0 NA 9 5.7 1.6
Breast (A113) 6 9.5 0.6 74 22.6 3.3 *
Cervix (A120) 24 35.3 0.7 81 84.0 1.0
Uterus, other and unspecified (A122) 5 0.0 NA 7 0.0 NA
Ovary (A123) 4 4.8 0.8 15 11.3 1.3
Other and unspecified sites (A139) 6 0.0 NA 44 105.0 0.4
DE: duration of employment; Obs: observed; Exp: expected; NA: not applicable; *: p value of test for PCMR trend < 0.05.
been found for specific job titles in this category, particularly nurses and teachers21–27).
To the best of our knowledge, none of the results in animal experiments showed an increased incidence of mammary
tumor induced by trichloroethylene or tetrachloroethylene. Studies to evaluate the relationship between occupational exposure to chlorinated organic compounds and breast cancer were mainly focused on aromatic hydrocarbons, less involved
in aliphatic hydrocarbons. Several studies have found an increased risk among women exposed to polycyclic aromatic hydrocarbons, including benzene, benz(a)pyrene, dibenz(ah)anthracene, 1-nitropyrene, DDT and PCB, due to their estrogenic activities29, 30).
Epidemiological studies of the association between trichloroethylene and tetrachloroethylene exposure and breast cancer were inconclusive. A proportional mortality rate study of 671 female dry cleaning and laundry workers in Wisconsin found a reduced proportion of deaths due to breast cancer5). Another proportional mortality rate study of laundry and dry cleaning workers in Oklahoma also found a deficit of breast cancer; however, the number of breast cancer in this cohort of 440 women was not given10). The mortality study of dry cleaner’s union members (n=4,046 women) by US National Cancer Institute found no increased risk of death due to breast cancer2). A NIOSH mortality rate study of 1,109 women employed in dry cleaning shops using PCE as the primary solvent found a slight but not significant increase (8%) in the breast cancer death rate (95% C.I. 0.65– 1.69) and the increment mainly from exposures occurring 20 or more years prior to the study9). A cancer mortality and incidence study of aircraft maintenance workers by US National Cancer Institute also revealed no significant excess for breast cancer incidence (Rate Ratio=1.8)31). Another population-based case-control study conducted by Aschengrau32) showed that women who had used water contaminated with PCE were more likely to develop breast cancer than those who had not used.
Labreche et al. hypothesized that a significant relationship may exist between exposure to organic solvents and the development of breast cancer in women33). He believed that most organic solvents possessed highly hydrophobic properties and that the organic solvents accumulated in the fat tissue easily, especially in the breast tissue, from which organic solvents invaded breast parenchyma and penetrated to the mammary lobules and ductules. He also pointed out that organic solvents such as trichloroethylene and tetrachloroethylene have been found in human milk33). Ferroni et al.34) measured prolactin levels in 60 women occupationally exposed to tetrachloroethylene at a median concentration of 15 ppm and in 30 control subjects. They noted a significant increase in prolactin levels of the exposed women relative to the controls during the proliferative phase of the menstrual cycle. These findings suggested that chlorinated organic solvents may be associated with breast cancer development, though no evidence of animal experiments or epidemiological studies supports this hypothesis.
During different periods in a woman’s life, exposures to environmental agents can have different effects on disease risk. The window of time between age at menarche and age at first full-term pregnancy has been identified as a time when breast tissue may be more susceptible to damage from chemical carcinogens. Critical periods of time in ductal morphogenesis are usually considered to be puberty and pregnancy, when rapid cell proliferation and differentiation are occurring35). The proportion of female workers who started working in the index factory before 30 years old was 87% in this study. Females exposed to carcinogenic agents, e.g. TCE and PCE, during puberty may be at high risk due to the susceptibility growing breast tissue mediated by hormonal changes during this time.
The strength of this study is a large cohort retrieved from BLI. Thus, selection bias was not possible. Using the same dataset to link to both exposed and comparison cohorts ensured complete ascertainment of cancer cases and comparability in methods for gathering information. However, the present study may suffer from some limitations based on the PCMR study. First, the follow-up time may be too short to induce occupation-related cancers. Second, there is no information on the chlorinated organic solvent exposure levels which may lead to misclassification of exposure status. Third, this study did not control for potential confounders, such as smoking, drinking, reproductive history, and dietary habits. Fourth, PCMR study suffered from well-known methodological problems. Finally, a challenge in interpreting the results is exposure to chlorinated organic solvents rarely occurs singularly. Most workers are exposed to trichloroethylene, tetrachloroethylene, and other solvents simultaneously. Although we suggest that solvent exposure causes cancer in humans and that trichloroethylene or tetrachloroethylene is likely to be one of the active agents36), further retrospective cohort mortality study based on standardized mortality ratios and standardized incidence ratios are needed to support the association.
Acknowledgement
This study was supported by a grant from the Council of Labor Affairs, the Executive Yuan, Republic of China (ISOH88-M302, ISOH89-M302).
References
1) AT S D R ( 1 9 9 5 ) To x i c o l o g i c a l p r o f i l e f o r tetrachloroethylene. Atlanta, GA: Agency for Toxic Substances Disease Registry.
2) Blair A, Decoufle P, Grauman DJ (1979) Causes of death among laundry and dry cleaning workers. Am J Public Health 69, 508–11.
3) Stemhagen A, Slade J, Altman R, Bill J (1983) Occupational risk factors and liver cancer. Am J Epidemiol 117, 443–54.
4) Hernberg S, Korkala M, Asikaine U, Riala R (1984) Primary liver cancer and exposure to solvents. Int Arch Occup Environ Health 54, 147–53.
5) Katz RM, Jowett D (1981) Female laundry and dry cleaning workers in Wisconsin: mortality analysis. Am J Public Health 71, 305–07.
6) Blair A, Stevens PA, Tolbert PE, Grauman D, Moran FX,Vaught J, Rayner J (1990) Cancer and other causes of death among a cohort of dry cleaners. Br J Ind Med
47, 162–68.
7) Norman JE, Robinette CD, Fraumeni JF Jr (1981) The mortality experience of army world war II chemical processing companies. J Occup Med 23, 818–22. 8) Brown DP, Kaplan SD (1987) Retrospective cohort
mortality study of dry cleaning worker using perchloroethylene. J Occup Med 29, 535–41. 9) Ruder AM, Ward EM, Brown DP (1994) Cancer
mortality in female and male dry-cleaning workers. J Occup Med 36, 867–74.
10) Duh R, Asal NR (1984) Mortality among laundry and dry cleaning workers in Oklahoma. Am J Public Heath
74, 1278–80.
11) IARC (1995) IARC monographs on the evaluation of carcinogenic risks to human. Vol. 63: dry cleaning, some chlorinated solvents and other industrial chemicals. Lyon: International Agency for Research in Cancer. 12) Revised Health Assessment (1995) Taoyuan and Chupei
sites, Taiwan, Republic of China. Geomatrix Consultants Inc, San Francisco, CA, USA.
13) Chang YM, Tai CF, Lin RS, Yang SC, Chen CJ, Shih TS, Du CL, Huang JW, Liou SH (2002) Establishment of an occupational cohort exposed to chlorinated organic solvents for epidemiological study of cancer risk of Taiwanese workers. Chinese J Occup Medicine 9, 65– 77.
14) Mantel N, Haenszel W (1959) Statistical aspects of the analysis of data from retrospective studies of disease. J Natl Cancer Inst 22, 719–48.
15) Bailar JC III, Ederer F (1964) Significance factors for the ratio of Poisson variable to its expectation. The Biometric Society 20, 639–43.
16) Department of Health (2000) 1997 Cancer registry annual report, Republic of China. Department of Health,
the Executive Yuan, R.O.C.
17) Kelsey JL, Gammon MD (1990) Epidemiology of breast cancer. Epidemiol Rev 12, 228–40.
18) Carter CL, Jones DY, Schatzkin A, Brinton LA (1989) A prospective study of familial, reproductive, and socioeconomic risk factors for breast cancer using NHANESI data. Public Health Reports 104, 45–50. 19) Poletto L, Morini JC (1990) Cancer mortality and some
socioeconomic correlates in Rosario, Argenitna. Cancer Lett 49, 201–05.
20) Ewertz M (1988) Risk of breast cancer in relation to social factors in Denmark. Acta Oncol 27, 787–92. 21) Petralis SA, Chow WH, McLaughlin J, Jin F, Gao YT
(1998) Occupational risk factors for breast cancer among women in Shanghai. Am J Ind Med 34, 477–83. 22) Rubin CH, Burnett CA, Halperin WE, Seligman PJ
(1993) Occupation as a risk identifier for breast cancer. Am J Public Health 83, 1311–15.
23) Bulbulyan M, Zahm SH, Zaridze DG (1992) Occupational cancer mortality among urban women in the former USSR. Cancer Causes Control 3, 299– 307.
24) Morton WE (1995) Major differences in breast cancer risks among occupations. J Occup Environ Med 37, 328–35.
25) Gunnersdottir H, Rafnsson V (1995) Cancer incidence among Icelandic nurses. J Occup Environ Med 37, 307– 12.
26) King AS, Threfall WJ, Band PR, Gallagher RP (1994) Mortality among female registered nurses and school teachers in British Columbia. Am J Ind Med 26, 125– 32.
27) Roman E, Beral V, Inskip H (1985) Occupational mortality among women in England and Wales. BMJ
291, 194–96.
28) Lynge E, Thygesen L (1990) Occupational cancer in Denmark. Cancer incidence in the 1970 census population. Scand J Work Environ Health 16 (suppl 2), 3–35.
29) Morris JJ, Seifter E (1992) The role of aromatic hydrocarbons in the genesis of breast cancer. Med Hypotheses 38, 177–84.
30) Wolff MS, Toniolo PG (1995) Environmental orgganochlorine exposure as a potential etiologic factor in breast cancer. Environ Health Perspect 103 (suppl 7), 141–45.
31) Blair A, Hartge P, Stewart PA, Mcadams M, Lubin J (1998) Mortality and cancer incidence of aircraft maintenance workers exposed to trichloroethylene and
other organic solvents and chemicals: extended follow up. Occup Environ Med 55, 161–71.
32) A s c h e n g r a u A , P a u l u C , O z o n o ff D ( 1 9 9 8 ) Tetrachloroethylene-contaminated drinking water and the risk of breast cancer. Environ Health Perspect. 106 (suppl 4), 946–53.
33) Labreche FP, Goldberg MS (1997) Exposure to organic solvents and breast cancer in women: a hypothesis. Am J Ind Med 32, 1–14.
34) Ferroni C, Selis L, Mutti A, Folli D (1992)
Neurobehavioral and neuroendocrine effects of occupational exposure to perchloroethylene. Neurotoxicology 13, 243–47.
35) Wolff MS, Collman GW, Barrett JC, Huff J (1996) Breast cancer and environment risk factors: epidemiological and experimental findings. Annu Rev. Pharmacol Toxicol 36, 573–96.
36) Wa r t e n v e rg D , R e y n e r D , S c o t t C S ( 2 0 0 0 ) Trichloroethylene and cancer:epidemiologic evidence. Environ Health Perspect 108 (suppl 2), 161–76.