Abstract—This paper assesses the behavior of electrical
output for a Ballard Mark V 35-cell 5 kW PEMFC (proton exchange membrane fuel cell) stack based dc-dc power conversion for applications in autonomous underwater vehicles under load changes. Since the fuel cell produces dc output voltage that is unregulated, PWM (pulse width modulated) dc-dc converters are connected to the output of the studies fuel cell for converting the unregulated voltage into a desired voltage level. The fuel cell model includes the double-layer charging effect, gases diffusion in the electrodes and the thermodynamic characteristic. Moreover, PWM dc– dc converters are assumed to operate in continuous-conduction mode and the compensator is designed with voltage-mode control. The models of the studies fuel cell and PWM dc-dc converters have been implemented in MATLAB/SIMULINK environment. The results show the output voltages of the studied PEMFC connected with PWM dc-dc converters during a load change are stable.
Index Terms – Fuel cells, autonomous underwater vehicles,
voltage-model control, PWM dc-dc converters
Nomenclature
Ci Concentrations of species i [mol/cm3].
Di,j Effective binary diffusivity coefficient for the i-j gas pair [cm2/s]. Enernst Thermodynamic equilibrium potential [V].
I Current [A].
J Current density [A/cm2 ].
a
A Width between anode channel to catalyst [cm].
c
A Width between cathode channel to catalyst [cm]. Ni Superficial gas flux of species i [mole/(cm
2⋅ s)]. P Pressure [atm].
Pi Pressure of compartment i [atm].
i
ρ Effective partial pressure of species i [atm].
C.-H. Lee and J.-T. Yang are with the Department of Systems and Naval Mechatronic Engineering, National Cheng Kung University, Tainan 701, Taiwan, R.O.C. (e-mail: chienlee@mail.ncku.edu.tw and p1696123@mail.ncku.edu.tw).
J.-A. Jiang is with the Department of Bio-Industrial Mechatronics Engineering, National Taiwan University, Taipei 106, Taiwan (email: jajiang@ntu.edu.tw).
sat O H2
ρ Saturated vapor pressure [atm]. rmem Membrane resistivity [Ω ⋅ cm]. Ract Activation resistance [Ω ]. Rint Internal electrical resistance [Ω ]. Top Operational temperature [K].
Vc Absolute value of activation overvoltage [V]. Vcell Cell output voltage [V].
Vi Voltage drop of type i [V].
Vstack Output voltage of the fuel-cell stack [V]. Xi Mole fractions of species i.
4 1...ξ
ξ Parameters defining the activation overvoltage.
Superscripts and subscripts
a Anode. act Activation. c Cathode.
channel Conditions at the anode or cathode channel.
H2 Hydrogen.
H2O Water.
O2 Oxygen.
ohm Ohmic.
sat Saturation conditions.
I. INTRODUCTION
HE design of an autonomous underwater vehicle (AUV) is a complex trade-off among various design variables and mission requirements. Particularly, the selection of a suitable energy source and the sensitivity of vehicle dimensional characteristics to mission requirements are important issues. The traditional energy source of underwater vehicles is based on the heat engine process of the Carnot cycle. It causes not only low conversion efficiency but also pollutions. Recently, an unmanned untethered submersible AUV-HM1 testbed [1] developed by National Taiwan University has been powered by lead-acid batteries. However, the limited operating range detracts the usages of lead-acid batteries. In order to design a long-range underwater vehicle, the larger capacity of the lead-acid battery is needed. Nevertheless, the long-range
Assessment of PEM Fuel Cells Based DC/DC Power
Conversion for Applications in AUVs
Chien-Hsing Lee, Senior Member, IEEE, Jian-Ting Yang and Joe-Air Jiang, Member, IEEE
2
underwater vehicle with the larger capacity of the lead-acid battery will increase its weight and occupy most of its volume. Fuel cells coupled with an alternative reactant storage system may overcome limitations of the traditional lead-acid batteries while maintaining other benefits of an electrochemical power source [2]. An AUV-URASHIMA which has been successfully developed by JAMSTEC (Japan Agency for Marine-Earth Science and Technology) and MHI (Mitsubishi Heavy Industries, Ltd.) uses the fuel cells with a metal hydride storage system as its main power source since 2002 [3].
Generally, the proton exchange membrane fuel cell (PEMFC) has multiple advantages. They offer a quiet low temperature operating condition with the only byproduct of clean pure water and are stackable to provide a range of space options. Their disadvantage is that pure hydrogen and oxygen reactants must be carried. Cell impurities also reduce efficiency and output. Thus, a key component to apply the PEMFC to the AUV system is fuel storage. For the PEMFC, pure hydrogen must be stored. Hydrogen can be stored as a gas, liquid or in a hydride. Out of the three options researched, the hydride method is chosen for its proven safety and reliability advantages [3].
The purpose of this paper is to assess the performance of the combined PEMFC and PWM dc-dc converters subject to a load change in AUVs. Although reference [4] had already described the PEMFC performance in the presence of transient effects, it did not use power converters to regulate the output voltage of the fuel-cell stack. Furthermore, reference [5] had built a nonlinear model of buck converters and references [6-8] had mentioned to use boost converters to regulate the output voltage of the fuel-cell stack. However, they have not yet showed the phenomenon that the load variations may affect the output voltage of the power converter.
II. DESCRIPTION OF THE AUVSYSTEM
An AUV is unmanned and un-cabled. It has smaller size than the submarine with tasks including exploring and investigating the oil, seabed survey and resources development, constructing and inspecting something underwater, maintaining and monitoring pipeline at seabed, and rescuing and salving things sinking at sea. An AUV is
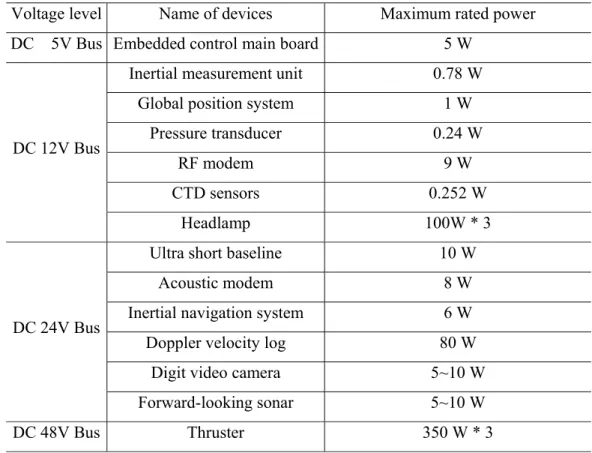
different from ROVs (Remotely Operated Vehicles). The ROV is dragged and powered by an umbilical cable. Thus, its work range is limited and is not suitable for working at larger ranges. However, the AUV is not limited by the umbilical cable and its working range. An AUV includes power, thrust, navigation and communication, and control subsystems as shown in Fig. 1 [9]. The onboard electrical loads of the AUV designed at National Cheng Kung University are listed in Table 1. The loads are supplied by different voltage levels including 5-, 12-, 24- and 48-V dc [10]. The basic power-supply configuration of the designed AUV based on Ballard Mark V PEMFC and PWM dc-dc converters is shown in Fig. 2.
III. MATHEMATICAL MODEL OF THE PEMFC
The PEMFC technologies have come to be mature due to its low operating temperature (50~1000C), high power density (3.8~6.5kW/m2), fast start at room temperature, drain flooded fields easily, and long life. It is suitable for a small-scale electric power system [11-12]. Specially, they are suitable to be as a movable power source for an air-independent propulsion submarine [3].
To simply the mathematical model of the PEMFC, the following assumptions are made in this paper [11-16]:
1) One-dimensional treatment.
2) Ideal and uniformly distributed gases.
3) Constant pressures in the fuel-cell gas flow channels. 4) The fuel is humidified H2 and the oxidant is
humidified O2. Assume the effective anode water vapor pressure is 50% of the saturated vapor pressure while the effective cathode water pressure is 100%.
5) The reaction gases are pure hydrogen and oxygen. 6) Parameters for individual cells can be lumped
together to represent a fuel-cell stack.
A schematic diagram of the PEMFC is shown in Fig. 3. For details of the workings of the PEMFC, the reader is referred to [12, 13, 16, 18].
A. Reactant Gases Diffusion in the Electrodes
As mentioned in references [13] and [14], the saturated vapor pressure ρsatH2O is function of the operating temperature of the PEMFC and is written to be
3 2.18 -273.15) -(T 10 1.44 273.15) -(T 10 9.18 273.15) -(T 10 2.95 ) log( 3 op 7 -2 op 5 -op -2 sat O H2 ⋅ × + ⋅ × ⋅ × = ρ (1)
In order to calculate the PEMFC output voltage, the effective partial pressures of H2 and O2 need to be determined. In a gas mixture consisting of N species, the diffusion of component i through the porous electrodes can be described by using Stefan-Maxwell equations as written to be [14] ∑ − = ∇ = n 1 j i,j i j j i op i (XN XN ) PD RT X , i =1, 2, …, n (2)
In the one-dimensional (1-D) transport process along the X-axis as shown in Fig. 3, the effective mole fraction of water at the anode catalyst interface is given as
⎟ ⎟ ⎠ ⎞ ⎜ ⎜ ⎝ ⎛ = 2 2 2 2 H , O H a a op channel O H O H D FP 2 J RT exp X X A (3) Since XH XHO 1 2
2+ = , the effective partial pressure of H2
at the interface is ) X 1 ( XHO HO sat O H H 2 2 2 2 − ρ = ρ (4)
According to the assumption 4) mentioned above, the effective anode water vapor pressure is 50% of the saturated vapor pressure. Thus, the effective partial pressure of H2 by combining eqs. (3) and (4) yields
⎥ ⎥ ⎥ ⎥ ⎥ ⎦ ⎤ ⎢ ⎢ ⎢ ⎢ ⎢ ⎣ ⎡ − ⎟ ⎟ ⎠ ⎞ ⎜ ⎜ ⎝ ⎛ ρ = ρ 1 D FP 2 J RT exp X 1 5 . 0 2 2 2 2 2 H , O H a a op channel O H sat O H H A (5)
Similar to the analysis for anode, the effective mole fraction of water at the cathode catalyst interface can be found as ⎟ ⎟ ⎠ ⎞ ⎜ ⎜ ⎝ ⎛ = 2 2 2 2 O , O H c c op channel O H O H D FP 4 J RT exp X X A (6)
As the partial pressure of water vapor in the cathode is fixed at the saturation level, the partial pressure of O2 at the interface is ) X 1 ( XHO HO sat O H O 2 2 2 2 − ρ = ρ (7)
Also, the effective cathode water vapor pressure equals the saturated vapor pressure based on the assumption 4). Thus,
the effective partial pressure of O2 by combining eqs. (6) and (7) yields ⎥ ⎥ ⎥ ⎥ ⎥ ⎦ ⎤ ⎢ ⎢ ⎢ ⎢ ⎢ ⎣ ⎡ − ⎟ ⎟ ⎠ ⎞ ⎜ ⎜ ⎝ ⎛ ρ = ρ 1 D FP 4 J RT exp X 1 2 2 2 2 2 O , O H c c op channel O H sat O H O A (8)
Using the appropriate critical values and constants for a water/oxygen mixture, eqs. (5) and (8) finally become to be [16] ⎥ ⎥ ⎥ ⎥ ⎥ ⎥ ⎦ ⎤ ⎢ ⎢ ⎢ ⎢ ⎢ ⎢ ⎣ ⎡ − ⎟ ⎟ ⎠ ⎞ ⎜ ⎜ ⎝ ⎛ ρ = ρ 1 T J 653 . 1 exp X 1 5 . 0 334 . 1 op channel O H sat O H H 2 2 2 (9) ⎥ ⎥ ⎥ ⎥ ⎥ ⎥ ⎦ ⎤ ⎢ ⎢ ⎢ ⎢ ⎢ ⎢ ⎣ ⎡ − ⎟ ⎟ ⎠ ⎞ ⎜ ⎜ ⎝ ⎛ ρ = ρ 1 T J 192 . 4 exp X 1 334 . 1 op channel O H sat O H O 2 2 2 (10)
where eqs. (9) and (10) will be used in the Nernst equation to find the fuel-cell output voltage.
B. Output Voltage of the Fuel-Cell Stack
The total output voltage of a fuel-cell stack is function of stack current, cathode pressure, reactant partial pressures, fuel cell temperature, membrane humidity, etc. Since the fuel-cell stack comprises of multiple fuel cell connected in series, the stack voltage Vstack is calculated by multiplying the cell voltage Vcell by a number of cells Ncell in the stack which is written to be
cell cell stack N V
V = ⋅ (11)
The output voltage of a single fuel cell is defined by the sum of three voltage terms: the thermodynamic potential Enernst, the activation overvoltage Vact and the ohmic overvoltage Vohm as repeated below [12-18]:
ohm act nernst cell E V V V = − − (12) where ] ) ( [ n F 2 RT ) 15 . 298 T ( 10 x 85 . 0 E E 5 . 0 O H op op 3 0 nernst 2 2⋅ ρ ρ + − − = − A (13) } ) I ( n T )] C ( n [ T T -{ Vact = ξ1+ξ2 op+ξ3 op A O2 +ξ4 opA (14) 1 ξ = -0.948 ) C ( n 10 3 . 4 ) A ( n 0002 . 0 00286 . 0 H2 5 cell 2 = + A + × − A ξ (15
4 ) 3 ξ = 7.6×10⁻⁵ 4 ξ = -1.93×10⁻⁴ ⎟ ⎟ ⎠ ⎞ ⎜ ⎜ ⎝ ⎛ ⋅ ρ × = − op O 7 O T 498 exp 10 97 . 1 C 2 2 (16) ⎟ ⎟ ⎠ ⎞ ⎜ ⎜ ⎝ ⎛ − ⋅ ρ × = − op H 7 H T 77 exp 10 174 . 9 C 2 2 (17) int ohm I R V = ⋅ (18) cell mem mem int A t r R = (19)
[
]
⎥ ⎥ ⎦ ⎤ ⎢ ⎢ ⎣ ⎡ ⎟ ⎟ ⎠ ⎞ ⎜ ⎜ ⎝ ⎛ − − − λ ⎥ ⎥ ⎦ ⎤ ⎢ ⎢ ⎣ ⎡ ⎟⎟ ⎠ ⎞ ⎜⎜ ⎝ ⎛ + + = op op 5 . 2 2 op mem T 303 T 18 . 4 exp J 3 634 . 0 J 303 T 062 . 0 J 03 . 0 1 6 . 181 r (20)Note that the two overvoltage terms in eq. (12) are both negative and represent non-ideal fuel cell reaction conditions. From an electrical/power-electronics standpoint, fuel cell is almost a nonlinear current-dependent voltage source. While this functional relationship varies somewhat with different fuel cells (e.g., Solid Oxide Fuel Cell, SOFC), references [19-21] had outlined more detailed work on planar SOFC. Fig. 4 shows the performance comparison between a typical single PEMFC operating at about 70oC and a SOFC operating at about 800oC under normal air pressure. As seen from Fig. 4, the thermodynamic potential of PEMFC is less than its theoretical value. Its voltage has a rapid initial fall and then falls less rapidly and more linearly. As for the SOFC, the thermodynamic potential is equal to or only a little less than its theoretical value. The initial fall in voltage is very small and the graph is more linear. Nevertheless, the voltages for both SOFC and PEMFC begin to fall faster at higher current density.
C. Double-Layer Charging Effect
The double layer charging capacitance may affect the activation overvoltage term in eq. (12). This results in a first order model where a sudden change in cell current is associated with a slower variation in output voltage [16, 18]. An electrical circuit model as shown in Fig. 5 can be used to illustrate this capacitive effect. For a given cell current, the activation voltage drop can be considered
across an activation resistance Ract. Since the activation voltage term Vact introduced in eq. (14) is negative, the derivation of a positive term Vc is required. The first order dynamics of the activation overvoltage term in reference to Fig. 5 are described by the equations as follows:
I / V Ract = act (21) dl act c dl c C R V C I dt dV ⋅ − = (22)
If the double-layer charging effect is integrated into the modeling, by using Vc instead of Vact, to calculate V′stack, the fuel-cell output voltage now turns out to be
) V V E ( N
Vstack′ = cell⋅ nernst− c− ohm (23) Note that the dynamical model for PEMFC electrochemistry described in this section is based on a generalized empirical set of equations. Therefore, by identifying appropriate parameters (i.e., number of cells, cell area, membrane thickness, etc) fuel cells with varying sizes, structures, and materials can be modeled and the relevant dynamics can be studied [16, 18]. Table 2 lists the related parameters used to model the PEMFC in this paper. IV. DESIGN OF DC/DCPOWER CONVERTERS
A PWM dc-dc converter is used to convert unregulated dc output voltage of the studied PEMFC into a desired voltage level. For the designed AUV, there are four desired voltage levels including 5-, 12-, 24- and 48-V in response to changes in the output load and the PEMFC output voltage. For achieving this, a negative feedback control system is used where the converter output is compared with its reference value. The compensator produces the control voltage, which is used to adjust the duty cycle of the switch in the converter [22-24]. This section will discuss the design of the compensation networks.
Assume that all power switches and diodes are ideal elements and the circuit operates in continuous-conduction mode (CCM). Additionally, a capacitor used as the filter capacitor in a boost or buck converter is represented with an equivalent series resistance (ESR) rC and equivalent series inductance (ESL) rL as shown in Fig. 6 [25-27]. As seen from Fig. 6, the minimum values of the inductances and capacitances in the converter can be obtained from the input voltage, load size, switching frequency and output voltage. These values are used as a reference to design the electrical
5
elements of power converters. Since the converter itself is a part of the control loop, the design of such control processes requires a knowledge of the small-signal characteristics of the converter. Based on the gain and phase margin of open-loop control-to-output transfer function of the converter, the compensator is then utilized to mitigate steady state errors. As a result, the stable output voltage can be obtained from this process. Fig. 7 shows the simulation circuits of the open-loop buck and boost converters.
A. Procedure and Criterion of Compensator Design The procedure of compensator design is simply described as follows:
(1) Simulating the frequency response of the open-loop control-to-output transfer function of the converter, (2) Setting the gain crossover frequency for the
converters and using this frequency to feedback the gain of the compensation circuit,
(3) Selecting the compensator type as shown in Fig. 8 and designing the electrical elements of the compensation circuit, and
(4) Simulating small-signal analysis of the frequency response of the closed-loop control-to-output transfer function of the converter.
As for the criterion of compensator design, it includes (a) The large dc gain is required to decrease the steady
state error.
(b) The small gain switching frequency is required to suppress the noise produced during the switching. (c) The gain crossover frequency of the converter is
selected to be between 1/6 and 1/10 of the gain switching frequency.
(d) The phase and gain margins are suggested to be 45~60 degree and 6~20 dB, respectively.
B. Frequency Response Analysis
As for the designed buck converters, the slope of the frequency response of the open-loop control-to-output transfer function of the converter at first corner is
dec / dB 40
− because the two poles generated from the LC filter fall close to each other. Moreover, due to the equivalent series resistance associated with a capacitor, there is a zero occurred at high frequency to result the slope
of −20dB/dec. As for the designed boost converter, it not only has the characteristics of the frequency response of the designed buck converter but also has a right-half-plane zero.
Based on the Bode diagram (i.e., gain and phase plots) for the open-loop control-to-output transfer function, one can select the compensator type, corner frequency and gain curve. This paper selects type-I and type-II compensators for the designed buck and boost converters as shown in Figs. 8(a) and 8(b), respectively. The values of electrical elements used in the compensation circuit are listed in Table 3 and the close-loop simulation circuit with the compensator for the designed buck and boost converters is shown in Fig. 9. To verify the compensator design, the Bode gain and phase for the open-loop and closed-loop control-to-output transfer function of the converter are compared to study the stability and transient response of the system.
V. SIMULATION
The mathematical expressions for the fuel cell system and power converters were simulated in the Matlab-SIMULINKTM environment. A block diagram of building a dynamic model of PEMFC and power converters is given in Fig. 10. In this block diagram, the input quantities are anode and cathode pressures (Pa and Pc), and operating temperature of the fuel cell (Top). Additionally, mass diffusion equations are used to calculate the effective partial pressures of H2 and O2. Then, the Nernst equation is employed to determine the internal potential of the fuel cell. The ohmic voltage drop and activation voltage drop together with the double-layer charging effect are applied to determine the output voltage of a single fuel cell.
In SIMULINKTM a set of equations can be grouped and these are called subsystems. Detailed of these subsystems are given in Figs. 11, 12, 13 and 14. The PEMFC subsystem using the block diagram mentioned in Fig. 10 is shown in Fig. 11. The subsystem of reactant gases diffusion in the electrodes given in Fig. 12 employs eqs. (1)-(10) and calculates hydrogen/oxygen partial pressures. The subsystem of electrochemistry for Ballard Mark V PEMFC implements eqs. (11)-(23) using parameters in Table 2 as shown in Fig. 13. It takes hydrogen/oxygen partial pressures, cell current and temperatures as inputs
6
and calculates the cell voltage. A gain at the terminal of the subsystem multiplies this output by the number of cells inside one stack. Various blocks are labeled with suitable equation or parameter names in relation to the cell electrochemical modeling scheme outlined in Section III. As for the power converter subsystem, it includes the circuits of power converters and compensators with voltage feedback control. Based on the electrical loads of the AUV, four converters are designed to obtain 5-, 12-, 24- and 48-V dc output and compensators are designed to regulate these dc voltages in the presence of transients. In SIMULINKTM a model of the compensator circuit with voltage feedback control as shown in Fig. 8 is built based on the reference [28-29]. To limit the paper length, Fig. 14 only shows the SIMULINKTM model of the output voltage of 24V dc-dc converter. As seen from Fig. 14, the repeating sequence block is used to generate the sawtooth waveform and the relay in discontinuities blockset is used to simulate the comparator. If the difference between the compensating signal and the sawtooth signal is positive, the switch is open and the output value is one; if the difference between the compensating signal and the sawtooth signal is negative, the switch is close and the output value is zero.
VI. RESULTS
A. Simulation of PEMFC subsystem
Due to the limitation of underwater environment, the PEMFC uses pure hydrogen and pure oxygen as the fuel. Assuming the pressures of oxygen and hydrogen in the inlet gas are operated at 3 atm with the temperature at approximately 70 . Fig. 15 shows the total output voltage and output power for Ballard Mark V 35-cell 5 kW PEMFC based on the parameters mentioned in Table 2. As seen from Fig. 15, the sharp voltage drop at low currents is caused by an activation overvoltage and the linear drop at intermediate currents is due to an ohmic overvoltage. Moreover, the maximum output power occurring at the load current of 239 A is about 3943 W and the corresponding output voltage is about 16.5 V.
Since the loads of the designed AUV is below 2kW, the maximum output current of the studied fuel cell is calculated to be about 78A and its corresponding output is
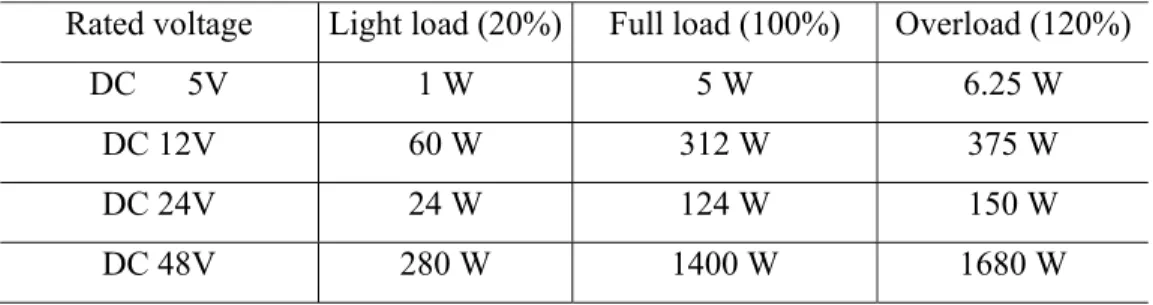
ranged from 27V to 40V. Fig. 16 shows the output voltage and output current of Ballard Mark V 35-cell 5 kW PEMFC at a power output between 0.3 kW and 2 kW. As seen from Fig. 16, the PEMFC output voltage is not stable due to the polarization losses (i.e., activation and ohmic overvoltages). Thus, PWM dc-dc converters (i.e., three buck converters and one boost converter) are connected to the PEMFC output for converting unregulated dc voltage into four desired voltage levels. Note that PWM dc-dc converters are designed to operate under overloads and light load. The light-load, full-load and overload conditions are defined to be 20%, 100% and 120% of the maximum rated power of the designed AUV as listed in Table 4, respectively.
For the purpose of simulation, no loss of energy is assumed for converting an input energy of Ballard Mark V 35-cell 5 kW PEMFC into an output power. The output power and output voltage of the studied fuel cell during a load change from full load to light load for all four buses of voltages are shown in Figs. 17 and 18. As seen from Fig. 17, the total output power of the studied fuel cell varies from 1841W to 370W as a load change occurs at 4 seconds during a simulation time of 8 seconds. As seen from Fig. 18, the output voltage and output current of the studied fuel cell are 29.3 V and 63.1 A at full load condition, respectively. However, the output voltage and output current of the studied fuel cell are 32.5 V and 11.4 A at light load condition, respectively.
B Simulation of power converter subsystem
As for the designed AUV, four PWM dc-dc converters with the compensation network using voltage-model control are connected to the output of the studied fuel cell for converting unregulated voltage into four desired voltage levels during a load change. The output voltages and output currents for 5-, 12-, 24- and 48-V dc-dc converters during a load change are shown in Figs. 19 to 22, respectively. Since the output of the studied fuel cell is ranged from 27V to 40V, only the 48-V dc-dc converter will need to use a boost-converter. The rest of converters will use buck converters. As seen from Figs. 19 to 22, the output voltages of four dc-dc converters all have a transient spike during a load change at 4 seconds. Nevertheless,
7
their output voltages are all stable right after the load change.
VII. CONCLUSION
This paper assesses the electrical behavior of Ballard Mark V 35-cell 5 kW PEMFC with its output voltage ranged from 27V to 40V based PWM dc-dc power conversion under load changes. The PWM dc-dc converters are connected to the studies fuel cell for converting the unregulated output voltage (27V~40V) into 5-, 12-, 24- and 48-V dc voltage levels for applications in autonomous underwater vehicles. The models of the studies fuel cell and dc-dc converters have been implemented in MATLAB/SIMULINK environment. The PEMFC model includes the double-layer charging effect, gases diffusion in the electrodes and the thermodynamic characteristic while the operation of PWM dc–dc converter assumes to be in continuous-conduction mode with a compensator in voltage-mode control. The results show the output voltages based dc-dc power conversion with the designed compensation network are stable as the load changes from full load to light load.
ACKNOWLEDGEMENTS
The authors are grateful to the National Science Council of the Republic of China for financially supporting this research under contracts’ no. NSC 96-2628-E-006-248-MY2.
REFERENCES
[1] Chen, Y. N., Status of underwater technology in Taiwan, IEEE
International Symposium on Underwater Technology, pp. 9-13, 2004. [2] Meyer, A. P., Development of proton exchange membrane fuel cells for underwater applications, In Proceedings of OCEANS’93, vol. 2, pp. II/146-II/151, October 18-21, 1993, Victoria, BC, Canada. [3] Yamamoto, I. et. al., Fuel cell system of AUV “Urashima”, In
Proceedings of OCEANS’94, vol. 3, pp. 1732-1737, Nov. 9-12, 2004. [4] Tsai, W. T., Nonlinear circuit analysis and control of a proton exchange membrane fuel cell stack, Master Thesis, National Chung Hsing University, 2004.
[5] Pires, V. F., Fernando, J., and Silva, A., Teaching nonlinear modeling, simulation, and control of electronic power converters using MATLAB/SIMULINK, IEEE Transactions on Education, vol. 45, no. 3, pp. 253-261, August 2002.
[6] Sadli, I., Thounthong, P., Martin, J.-P., Rael, S., and Davat, B., Behavior of a PEMFC supplying a low voltage static converter,
Journal of Power Sources, vol. 156, pp. 119-125, May 2006. [7] Wang, C., Nehrir, M. H., and Gao, H., Control of PEM fuel cell
distributed generation system, IEEE Transactions on Energy
Conversion, vol. 21, no. 2, pp. 586-595, June 2006.
[8] Mazumder, S. K., Stability analysis of parallel DC-DC converters,
IEEE Transactions on Aerospace and Electronic Systems, vol. 42, no. 1, pp. 50-69, Jan. 2006.
[9] Ray, P., et. al., Autonomous underwater vehicle, Senior Design
Project, Stevens Institute of Technology, Hoboken NJ 07030, May 2003.
[10] Karas, M., E., et. al., System design for an autonomous underwater vehicle, Senior Design Project, Stevens Institute of Technology, Hoboken NJ 07030, May 2002.
[11] Gao, L., Jiang, Z., and Dougal, R. A., Evaluation of active hybrid fuel cell/battery power sources, IEEE Transactions on Aerospace
and Electronic Systems, vol. 41, no. 1, pp. 346-355, Jan. 2005. [12] Larminie, J. and Dicks, A., Fuel Cell Systems explained, New York:
Wiley, 2nd Edition, 2003.
[13] Amphlett, J. C., Baumert, R. M., Mann, R. F., Peppley, B. A., and Roberge, P. R., Performance modeling of the Ballard Mark IV solid polymer electrolyte fuel cell I: mechanistic model development,
Journal of Electrochemical Society, vol. 142, no. 1, pp. 1-8, Jan. 1995.
[14] Rowe, A., and Li, X. Mathematical modeling of proton exchange membrane fuel cells, Journal of Power Sources, vol. 102, no. 1, pp. 82-96, Dec. 2001.
[15] Wang, C., Nehrir, M. H., Shaw, S. R., Dynamic models and model validation for PEM fuel cells using electrical circuits, IEEE
Transactions on Energy Conversion, vol. 20, no. 2, pp. 442-451, June 2005.
[16] Amphlett, J. C., Mann, R. F., Peppley, B. A., Roberge, P. R., and Rodrigues, A., A model predicting transient responses of proton exchange membrane fuel cells, J. Power Sources, vol. 61, no.1-2, pp. 183-188, Jul./Aug. 1996.
[17] Na, W. , and Gou, B., Nonlinear control of PEM fuel cells by exact linearization, IEEE Transactions on Energy Conversion, vol. 23, no. 1, pp. 179-190, March 2008.
[18] M. J. Khan, and M. T. Iqbal, Modelling and Analysis of Electrochemical Thermal and Reactant Flow Dynamics for a PEM Fuel Cell System, FUEL CELLS, no. 4, pp. 463-475, May 2005. [19] Mazumder, S. K., Pradhan, S. K., Hartvigsen, J., von Spakovsky, M.
R., and Rancruel, D. F., Effects of battery buffering on the post-load-transient performance of a PSOFC, IEEE Transactions on
Energy Conversion, vol. 22, no. 2, pp. 457-466, June 2007. [20] Pradhan, S., Mazumder, S. K., Hartvigsen, J., and Hollist, M.,
Effects of electrical feedbacks on planar solid oxide fuel cell, ASME
Journal of Fuel Cell Science and Technology, vol. 4, pp. 154-166, May 2007.
[21] Mazumder, K., et. al., Solid-oxide-fuel-cell performance and durability: resolution of the effects of power-conditioning systems and application loads? IEEE Transactions on Power Electronics, vol. 19, no. 5, pp. 1263-1278, 2004.
[22] Mohan, N., Undeland, Tore M., Robbins, W. P., Power electronics:
converters, application, and design, 3rd edition, Wiley, October 2002. ISBN: 978-0-471-22693-2
[23] Palma, L., Todorovic, M. H., and Enjeti, P., Design of a wide input range DC-DC converter with a robust power control scheme suitable for fuel cell power conversion, IEEE Transactions on Industrial
Electronics, vol. 55, no. 3, pp. 1247-1255, March 2008.
[24] Lau, B., Small-signal frequency response theory for ideal DC-to-DC converter system, Ph.D. Thesis, California Institute of Technology, September 1986.
[25] Khaligh, A., and Emadi, A., Mixed DCM/CCM pulse adjustment with constant power loads, IEEE Transactions on Aerospace and
Electronic Systems, vol. 44, no. 2, pp. 766-782, April 2008. [26] Moisseev, S., Soshin, K., and Nakaoka, M., Tapped-inductor filter
assisted soft-switching PWM DC-DC power converter, IEEE
Transactions on Aerospace and Electronic Systems, vol. 41, no. 1, pp. 174-180, Jan. 2005.
[27] Li, H., and F. Z. Peng, Modeling of a new ZVS bi-directional dc-dc converter, IEEE Transactions on Aerospace and Electronic Systems, vol. 40, no. 1, pp. 272-283, Jan. 2004.
8 [28] Su, J. H., Wang, C. M., Chen, J. J., Lee, J. D., and Chen, T. L.,
Interactive simulation and verification SIMULINK models for DC-DC switching converter circuits using PWM control ICs, IEEE
PEDS, pp. 1256-1261, 2005.
[29] Choe, S.-Y., Ahn, J.-W., Lee, J.-G., and Baek, S.-H., Dynamic simulator for a PEM fuel cell system with a PWM DC/DC converter,
IEEE Transactions on Energy Conversion, vol. 23, no. 2, pp. 669-680, June 2008.
Chien-Hsing Lee (S’93–M’98–SM’06) was born in Pingtung, Taiwan, on June 13, 1967. He graduated from National Kaohsiung Institute of Technology, Taiwan and received the B.S. degree in electrical engineering from Arizona State University in 1993. Then, he obtained the M.S.E.E. and Ph.D. degrees from the Georgia Institute of Technology in 1995 and 1998, respectively. He is currently an associate professor at National Cheng Kung University in Taiwan. His research interests are power system grounding analysis, power system transient modeling, power quality, energy conversion and applications of wavelet theory in power systems.
Jian-Ting Yang was born in Hsinchu, Taiwan, R.O.C., on February 27, 1984. He received the B.S. degree in industrial education from National Taiwan Normal University in 2006. He currently studies at the department of systems and naval mechatronic engineering at National Cheng Kung University, Tainan, Taiwan. His research interests include fuel cells modeling, power electronics and energy conversion.
Joe-Air Jiang (M’01) was born in Tainai, Taiwan, R.O.C., in 1963. He received the M.S. and Ph.D. degrees in electrical engineering from National Taiwan University, Taipei, Taiwan, in 1990 and 1999, respectively. From 1990 to 2001, he was with Kuang-Wu Institute of Technology, Taipei, Taiwan. Currently, he is an Associate Professor of bio-industrial mechatronics engineering at National Taiwan University, Taipei. His areas of interest are in computer relaying, mechatronics, neuro-engineering, wireless sensor network, and bio-effects of electromagnetic wave.