Confidential: For Review
Please review the Supplemental Files folder to review documents not compiled in the PDF.
Association between Body-Mass Index and Risk of Death in More Than 1 Million Asians
Journal: New England Journal of Medicine Manuscript ID: 10-10679.R2
Article Type: Original Article Date Submitted by the
Author: 29-Nov-2010
Complete List of Authors: Zheng, Wei; Vanderbilt University Medical Center, Medicine; Vanderbilt Epidemiology Center, Medicine
McLerran, Dale; Fred Hutchinson Cancer Research Center Rolland, Betsy; Fred Hutchinson Cancer Research Center Zhang, Xianglan; Vanderbilt Epidemiology Center
Inoue, Manami; Research Center for Cancer Prevention and Screening, National Cancer Center, Epidemiology and Prevention Division
Matsuo, Keitaro; Aichi Cancer Center Research Institute, Division of Epidemiology and Prevention
He, Jiang; Tulane University School of Public Health and Tropical Medicine, Department of Epidemiology
Gupta, Prakash; Healis - Sekhsaria Institute for Public Health Ramadas, Kunnambath; Regional Cancer Center, Medical College Campus, Division of Radiation Oncology
Tsugane, Shoichiro; Research Center for Cancer Prevention and Screening, National Cancer Center, Epidemiology and Prevention Division
Irie, Fujiko; Ibaraki Prefectural Government, Department of Health and Social Services
Tamakoshi, Akiko; Aichi Medical University School of Medicine, Department of Public Health
Gao, Yu-Tang; Shanghai Cancer Institute, Department of Epidemiology
Wang, Renwei; University of Minnesota, Masonic Cancer Center Shu, Xiao-Ou; Vanderbilt Epidemiology Center
Tsuji, Ichiro; Tohoku University Graduate School of Medicine, Division of Epidemiology, Department of Public Health and Forensic Medicine
Kuriyama, Shinichi; Tohoku University Graduate School of Medicine, Division of Epidemiology, Department of Public Health and Forensic Medicine
Tanaka, Hideo; Aichi Cancer Center Research Institute, Division of Epidemiology and Prevention
Confidential: For Review
Environmental Health Sciences
Chen, Chien-Jen; Academia Sinica, Genomics Research Center Yuan, Jian-Min; University of Minnesota
Yoo, Keun-Young; Seoul National University College of Medicine, Department of Preventive Medicine
Ahsan, Habibul; The University of Chicago, Medicine and Human Genetics and Cancer Research Center, Department of Health Studies
Pan, Wen-Harn; National Taiwan University, Department of Biochemical Science and Technology
Gu, Dongfeng; Cardiovascular Institute and Fu Wai Hospital, Department of Evidence Based Medicine
Pednekar, Mangesh; Healis - Sekhsaria Institute for Public Health Sauvaget, Catherine; International Agency for Research on Cancer, Screening Group, Prevention and Early Dectection Section
Sasazuki, Shizuka; Research Center for Cancer Prevention and Screening, National Cancer Center, Epidemiology and Prevention Division
Sairenchi, Toshimi; Dokkyo Medical University School of Medicine, Department of Public Health
Yang, Gong; Vanderbilt Epidemiology Center
Xiang, Yong-Bing; Shanghai Cancer Institute, Department of Epidemiology
Nagai, Masato; Tohoku University Graduate School of Medicine, Division of Epidemiology, Department of Public Health and Forensic Medicine
Suzuki, Takeshi; Nagoya City University Graduate School of Medical Science, Department of Medicial Oncology and Immunology
Nishino, Yoshikazu; Miyagi Cancer Center Research Institute, Division of Epidemiology
You, San-Lin; College of Medicine, and Graduate Institute of Epidemiology, College of Public Health,
Koh, Woon-Puay; Yong Loo Lin School of Medicine, National University of Singapore, Department of Epidemiology and Public Health
Park, Sue Kyung; Seoul National University College of Medicine, Preventive Medicine
Chen, Yu; New York University School of Medicine, Department of Environmental Medicine
Shen, Chen-Yang; Institute of Biomedical Sciences
Thornquist, Mark; Fred Hutchinson Cancer Research Center Feng, Ziding; Fred Hutchinson Cancer Research Center; Fred Hutchinson Cancer Research Center
Kang, Daehee; Seoul National University College of Medicine, Preventive Medicine
Boffetta, Paolo; International Prevention Research Institute Potter, John; Fred Hutchinson Cancer Research Center
Keywords: Obesity < Endocrinology, Global Health < Public Health, Policy, and Training, Statistics < Public Health, Policy, and Training
Abstract:
Background
Most studies that have evaluated the association of body mass index (BMI) with total and cause-specific mortality were conducted in populations of European origin.
Methods
Pooled analyses were conducted to evaluate the BMI-mortality association in over 1.1 million persons recruited in 19 cohorts in Asia, including approximately 120,700 deaths after a mean follow-up of 9.2 years. Cox regression models were used to adjust for
3 4 5 6 7 8 9 10 11 12 13 14 15 16 17 18 19 20 21 22 23 24 25 26 27 28 29 30 31 32 33 34 35 36 37 38 39 40 41 42 43 44 45 46 47 48 49 50 51 52 53 54 55 56
Confidential: For Review
Results
In East Asians, including Chinese, Japanese, and Koreans, the lowest risk of death was found among persons with a BMI range of 22.6-27.5 kg/m.2
The risk was elevated with either higher or lower BMI level: up to 1.5-fold among those with a BMI ≥ 35.0 kg/m2 and 2.8-fold among those with a BMI < 15 kg/m2. A similar U-shaped association was found for mortality due to cancer, cardiovascular diseases, and other causes. In Indians/Bangladeshis, elevated risks, for total and other-cause mortality, were found among individuals with a BMI of <20 kg/m2, compared to those with a BMI of 22.6-25.0 kg/m2, whereas no excess risk for total or cause-specific mortality was associated with a high BMI.
Conclusions
Underweight was associated with a substantially increased risk of death in all Asian populations. The excess risk of death associated with high BMI, however, was found in East Asians but not in Indians/Bangladeshis. These results should be considered in designing weight reduction programs in some Asian populations in which under-nutrition and other causes of underweight are major health problems. 3 4 5 6 7 8 9 10 11 12 13 14 15 16 17 18 19 20 21 22 23 24 25 26 27 28 29 30 31 32 33 34 35 36 37 38 39 40 41 42 43 44 45 46 47 48 49 50 51 52 53 54 55 56 57
Confidential: For Review
TWeek – Zheng OA (10-10679)
“Body Mass Index and Mortality in Over 1 Million Asian Persons”
This study presents pooled analyses of BMI-mortality associations in over 1.1 million people
from 19 cohorts in Asia after a mean follow-up of 9.2 years. Underweight was associated with a
substantially increased risk of death in all Asian populations. However, the excess risk of death
associated with high BMI was observed in East Asians but not in Indians and Bangladeshis.
Word Count 60 3 4 5 6 7 8 9 10 11 12 13 14 15 16 17 18 19 20 21 22 23 24 25 26 27 28 29 30 31 32 33 34 35 36 37 38 39 40 41 42 43 44 45 46 47 48 49 50 51 52 53 54 55 56
Confidential: For Review
10-10679.R2 Word Count 2675; Abstract 217; References, 21; 3 Tables; 2 Figures; SupplementBody Mass Index and Mortality in Over 1 Million Asian Persons
Wei Zheng, M.D., Ph.D., Dale F. McLerran, M.S., Betsy Rolland, M.L.I.S., Xianglan Zhang, M.D., M.P.H., Manami Inoue, M.D., Ph.D., Keitaro Matsuo, M.D., Ph.D., Jiang He, M.D., Ph.D., Prakash Chandra Gupta, M.Sc., Sc.D., Kunnambath Ramadas, M.D., Shoichiro Tsugane, M.D., Ph.D., Fujiko Irie, M.D., Ph.D., Akiko Tamakoshi, M.D., Ph.D., Yu-Tang Gao, M.D., Renwei Wang, M.D., M.S., Xiao-Ou Shu, M.D., Ph.D., Ichiro Tsuji, M.D., Ph.D., Shinichi Kuriyama, M.D., Hideo Tanaka, M.D., Ph.D., Hiroshi Satoh, M.D., Ph.D., Chien-Jen Chen, Sc.D., Jian-Min Yuan, M.D., Ph.D., Keun-Young Yoo, M.D., Ph.D., Habibul Ahsan, M.D., Wen-Harn Pan, Ph.D., Dongfeng Gu, M.D., Ph.D., Mangesh Suryakant Pednekar, M.Sc., Ph.D., Catherine Sauvaget, M.D., Ph.D., Shizuka Sasazuki, M.D., Ph.D., Toshimi Sairenchi, Ph.D., Gong Yang, M.D., M.P.H., Yong-Bing Xiang, M.D., M.Ph., Masato Nagai, M.Sc., Takeshi Suzuki, M.D., Ph.D., Yoshikazu Nishino, M.D., Ph.D., San-Lin You, Ph.D., Woon-Puay Koh, M.B., B.S., Ph.D., Sue K. Park, M.D., Ph.D., Yu Chen, Ph.D., Chen-Yang Shen, Ph.D., Mark Thornquist, Ph.D., Ziding Feng, Ph.D., Daehee Kang, M.D., Ph.D., Paolo Boffetta, M.D., M.P.H., John D. Potter, M.D., Ph.D.
Corresponding authors’ contact information:
Wei Zheng, M.D., Ph.D.
Vanderbilt Epidemiology Center Vanderbilt University Medical Center
2525 West End Avenue, 8th Floor
Nashville, TN 37203-1738
E-mail: [email protected]
and
John D. Potter, M.D., Ph.D.
Fred Hutchinson Cancer Research Center 1100 Fairview Avenue North, M4-B402 Seattle, WA 98109-1024 USA E-mail: [email protected] 3 4 5 6 7 8 9 10 11 12 13 14 15 16 17 18 19 20 21 22 23 24 25 26 27 28 29 30 31 32 33 34 35 36 37 38 39 40 41 42 43 44 45 46 47 48 49 50 51 52 53 54 55 56 57
Confidential: For Review
Authors’ affiliations
Division of Epidemiology, Department of Medicine, Vanderbilt Epidemiology Center, Vanderbilt-Ingram Cancer Center, Vanderbilt University, Nashville, TN, USA (Wei Zheng, M.D., Ph.D., Xianglan Zhang, M.D., M.P.H., Xiao-Ou Shu, M.D., Ph.D., Gong Yang, M.D., M.P.H.) Fred Hutchinson Cancer Research Center (Dale McLerran, M.S.; Betsy Rolland, M.L.I.S.; Mark
Thornquist, Ph.D.; Ziding Feng, Ph.D.; John D. Potter, M.D., Ph.D.)
Epidemiology and Prevention Division, Research Center for Cancer Prevention and Screening, National Cancer Center, Tokyo, Japan (Manami Inoue, M.D., Ph.D.; Shoichiro Tsugane, M.D., Ph.D.; Shizuka Sasazuki, M.D., Ph.D.)
Division of Epidemiology and Prevention, Aichi Cancer Center Research Institute, Nagoya, Japan (Keitaro Matsuo, M.D., Ph.D.; Hideo Tanaka, M.D., Ph.D.)
Department of Epidemiology, Tulane University School of Public Health and Tropical Medicine, New Orleans, LA, USA (Jiang He, M.D., Ph.D.)
Healis - Sekhsaria Institute for Public Health (Prakash Chandra Gupta, M.Sc., Sc.D.; Mangesh Suryakant Pednekar, M.Sc., Ph.D.)
Division of Radiation Oncology, Regional Cancer Center, Medical College Campus, Trivandrum 695011, India (Kunnambath Ramadas, M.D.)
Department of Health and Social Services, Ibaraki Prefectural Government, Ibaraki, Japan (Fujiko Irie, M.D., Ph.D.)
Department of Public Health, Aichi Medical University School of Medicine, Aichi, Japan (Akiko Tamakoshi, M.D., Ph.D.)
Department of Epidemiology, Shanghai Cancer Institute, Shanghai, China (Yu-Tang Gao, M.D.; Yong-Bing Xiang, M.D., M.Ph.)
Masonic Cancer Center, University of Minnesota, Minneapolis, MN, USA (Renwei Wang, M.D., M.S.; Jian-Min Yuan, M.D., Ph.D.)
Division of Epidemiology, Department of Public Health and Forensic Medicine, Tohoku University Graduate School of Medicine, Sendai, Japan (Ichiro Tsuji, M.D., Ph.D.; Shinichi Kuriyama, M.D., Ph.D.; Masato Nagai, M.Sc.)
Environmental Health Sciences, Tohoku University Graduate School of Medicine, Sendai, Japan (Hiroshi Satoh, M.D., Ph.D.) 3 4 5 6 7 8 9 10 11 12 13 14 15 16 17 18 19 20 21 22 23 24 25 26 27 28 29 30 31 32 33 34 35 36 37 38 39 40 41 42 43 44 45 46 47 48 49 50 51 52 53 54 55 56
Confidential: For Review
Genomics Research Center, Academia Sinica, Taipei, Taiwan (Chien-Jen Chen, Sc.D.; San-Lin You, Ph.D.)
Graduate Institute of Epidemiology, College of Public Health, National Taiwan University, Taipei, Taiwan (Chien-Jen Chen, Sc.D.; Wen-Harn Pan, Ph.D.)
Department of Preventive Medicine, Seoul National University College of Medicine (Keun-Young Yoo, M.D., Ph.D.; Daehee Kang, M.D., Ph.D.)
Department of Health Studies, Medicine and Human Genetics and Cancer Research Center, The University of Chicago, Chicago, IL, USA (Habibul Ahsan, M.D.)
Institute of Biomedical Sciences, Academia Sinica, Taipei, 115, Taiwan (Wen-Harn Pan, Ph.D.) Department of Biochemical Science and Technology, National Taiwan University, Taipei, 106,
Taiwan (Wen-Harn Pan, Ph.D.)
Fuwai Hospital and Cardiovascular Institute, Chinese Academy of Medical Sciences and Peking Union Medical College, and China National Center for Cardiovascular Disease, Beijing, China (Dongfeng Gu, M.D., Ph.D.)
Screening Group, Prevention and Early Detection Section, International Agency for Research on Cancer, Lyon, France (Catherine Sauvaget, M.D., Ph.D.)
Department of Public Health, Dokkyo Medical University School of Medicine, Tochigi, Japan (Toshimi Sairenchi, Ph.D.)
Department of Medical Oncology and Immunology, Nagoya City University Graduate School of Medical Science, Nagoya, Japan (Takeshi Suzuki, M.D., Ph.D.)
Division of Epidemiology, Miyagi Cancer Center Research Institute, Miyagi Japan (Yoshikazu Nishino, M.D., Ph.D.)
Department of Epidemiology and Public Health, Yong Loo Lin School of Medicine, National University of Singapore (Woon-Puay Koh, M.B., B.S., Ph.D.)
Department of Preventive Medicine, Seoul National University College of Medicine and Cancer Research Institute and Institute of Health Policy and Management, Seoul National University (Sue K. Park, M.D., Ph.D.)
Department of Environmental Medicine, New York University School of Medicine, New York, NY, USA (Yu Chen, Ph.D.)
Taiwan Biobank, Institute of Biomedical Sciences, Academia Sinica, Taipei, Taiwan (Chen-Yang Shen, Ph.D.) 3 4 5 6 7 8 9 10 11 12 13 14 15 16 17 18 19 20 21 22 23 24 25 26 27 28 29 30 31 32 33 34 35 36 37 38 39 40 41 42 43 44 45 46 47 48 49 50 51 52 53 54 55 56 57
Confidential: For Review
Graduate Institute of Environmental Science, China Medical University, Taichung, Taiwan (Chen-Yang Shen, Ph.D.)
The Tisch Cancer Institute, Mount Sinai School of Medicine, New York, NY, USA (Paolo Boffetta, M.D., M.P.H.)
International Prevention Research Institute, Lyon, France (Paolo Boffetta, M.D., M.P.H.)
3 4 5 6 7 8 9 10 11 12 13 14 15 16 17 18 19 20 21 22 23 24 25 26 27 28 29 30 31 32 33 34 35 36 37 38 39 40 41 42 43 44 45 46 47 48 49 50 51 52 53 54 55 56
Confidential: For Review
ABSTRACT
Background
Most studies that have evaluated the association of body mass index (BMI) with total and cause-specific mortality were conducted in populations of European origin.
Methods
Pooled analyses were conducted to evaluate the BMI-mortality association in over 1.1 million persons recruited in 19 cohorts in Asia, including approximately 120,700 deaths after a mean follow-up of 9.2 years. Cox regression models were used to adjust for confounding factors.
Results
In East Asians, including Chinese, Japanese, and Koreans, the lowest risk of death was found among
persons with a BMI range of 22.6-27.5 kg/m.2
The risk was elevated with either higher or lower BMI level: up to 1.5-fold among those with a BMI
≥ 35.0 kg/m2 and 2.8-fold among those with a BMI < 15 kg/m2. A similar U-shaped association was
found for mortality due to cancer, cardiovascular diseases, and other causes. In Indians/Bangladeshis, elevated risks, for total and other-cause mortality, were found among individuals with a BMI of <20
kg/m2, compared to those with a BMI of 22.6-25.0 kg/m2, whereas no excess risk for total or
cause-specific mortality was associated with a high BMI.
Conclusions
Underweight was associated with a substantially increased risk of death in all Asian populations. The excess risk of death associated with high BMI, however, was found in East Asians but not in Indians/Bangladeshis. 3 4 5 6 7 8 9 10 11 12 13 14 15 16 17 18 19 20 21 22 23 24 25 26 27 28 29 30 31 32 33 34 35 36 37 38 39 40 41 42 43 44 45 46 47 48 49 50 51 52 53 54 55 56 57
Confidential: For Review
Over the past few decades, there has been a dramatic increase in the prevalence of obesity in
many countries. The World Health Organization estimates that more than one billion adults are overweight worldwide; of these, at least 300 million are obese (1). A large number of epidemiologic studies have evaluated the associations between body weight and, more often, body mass index
(BMI, kg/m2) and a wide range of health outcomes. Obesity is associated with multiple chronic
diseases, including type 2 diabetes, hypertension, coronary heart disease, stroke, and several cancers (2). Uncertainties, however, remain regarding the dose-response relationship between BMI and overall mortality, particularly for Asians who account for over 60% of the world population, as most of the studies have been conducted in populations of European origin.
The definitions of overweight (BMI>25) and obese (BMI>30) are based essentially on criteria derived from studies conducted in populations of European origin. The validity of these criteria in Asian populations has yet to be determined. It has been suggested that the associations of BMI with body composition and health outcomes may differ in Asian and European populations (3). Studies have shown that, for a given BMI, Asians generally have a higher percentage of body fat than Europeans (3). Asian populations have also been found to have an elevated risk of type 2 diabetes, hypertension, and hyperlipidemia at a relatively low level of BMI (3). Based on these observations, lower BMI cut points have been proposed to define overweight (BMI > 23.0) and obesity (BMI > 25.0) for Asian populations (3). However, a recent consensus statement from the WHO concludes that the available data are not sufficient to support Asian-specific cut points to define overweight and obesity (3). The optimal weight range associated with minimal mortality in Asian populations
remains controversial. 3 4 5 6 7 8 9 10 11 12 13 14 15 16 17 18 19 20 21 22 23 24 25 26 27 28 29 30 31 32 33 34 35 36 37 38 39 40 41 42 43 44 45 46 47 48 49 50 51 52 53 54 55 56
Confidential: For Review
To address these unresolved issues, we evaluated the relationship between BMI and mortality endpoints using data from 19 cohort studies, involving more than one million participants, as part of the Asia Cohort Consortium (ACC). This pooling project, with its large sample size, not only provides the opportunity to address carefully the methodologic challenges that cannot be handled adequately in any single study, but also enables the evaluation of the associations by major Asian ethnicities.
METHODS
Eligible cohorts for the BMI Pooling Project were identified through a systematic literature search in early 2008, followed by a survey that was sent to the investigators of each cohort to further determine study eligibility. Nineteen cohorts were included in the pooling project. With the exception of the Taiwan CVDFACTS cohort, all other cohorts had accrued at least five years of follow-up and had recruited a minimum of at least 10,000 participants with baseline BMI data. All participating cohorts were required to have baseline data on BMI, age, sex, and cigarette smoking, plus follow-up data on all-cause mortality. Additional data were collected on selected baseline morbid conditions and cause-specific mortality. Individual data from participating cohorts were collected and harmonized for statistical analysis. This study was approved by ethics committees for all participating studies and the Fred Hutchinson Cancer Research Center.
A total of 1,155,676 participants were included in the 19 participating cohorts. Excluded from the analysis were participants with missing data on age (n=2), BMI (n= 13,780), and vital status (n=7). In addition, we excluded those with age<18 (n=14), with BMI>50 (n=174) and with invalid or missing survival time (n=105). After these exclusions, 1,141,609 participants remained (535,199 men and 606,410 women). The association between BMI and mortality was examined using Cox
proportional hazards regression models, employing a categorical representation of BMI as the
3 4 5 6 7 8 9 10 11 12 13 14 15 16 17 18 19 20 21 22 23 24 25 26 27 28 29 30 31 32 33 34 35 36 37 38 39 40 41 42 43 44 45 46 47 48 49 50 51 52 53 54 55 56 57
Confidential: For Review
predictor variable. To define BMI groups for the analysis, we utilized pre-determined levels of 25 (overweight) and 30 (obesity) as cut-off points. With 2.5-unit increments per group between 15 and 35, along with the lowest (≤15.0) and highest (>35.0) BMI groups, ten BMI levels were established:
≤15.0, 15.1-17.5, … 32.6-35.0, and >35.0. Using the BMI range 22.6-24.5 as the reference, hazard
ratios (HR) and 95% confidence intervals (CI) were estimated for the other BMI ranges, after adjusting for potential confounders, including baseline age, sex, education, urban/rural resident, and marital status. We adjusted for additional variables in some analyses — cigarette smoking and known baseline morbid conditions (cancer, coronary heart disease [CHD], stroke, diabetes, and
hypertension). Analyses were conducted separately for Indian/Bangladeshi, and East Asians (Chinese, Japanese, and Koreans), as there are significant heterogeneities between these two populations. Pre-specified stratified analyses were performed by smoking status and sex to evaluate the consistency of the associations. Some analyses were conducted among lifetime nonsmokers to eliminate the potential confounding effect of cigarette smoking on the association between BMI and mortality outcomes. To minimize the influence of possible “reverse causation” (morbid conditions causing low BMI) due to the presence of terminal diseases at baseline in some participants, we excluded the first three years of follow-up and restricted some analyses to those who did not have CHD, stroke, and/or cancer at baseline or to lifetime nonsmokers without these morbid conditions at baseline. Ages at entry and exit were used to define the time variable in the Cox models.
In the models, the effect of BMI on mortality was assumed to be cohort-specific. For each cohort, we assumed that the log hazard ratio for BMI has a fixed-effect component that is common to all cohorts within each of the three major Asian populations and a random effect that is cohort-specific. The random effects for the log hazard ratios were assumed to be normally distributed, with
mean zero; that is, we assumed that βˆ , the estimated log hazard ratio for the j-th BMI level in the i-ij
3 4 5 6 7 8 9 10 11 12 13 14 15 16 17 18 19 20 21 22 23 24 25 26 27 28 29 30 31 32 33 34 35 36 37 38 39 40 41 42 43 44 45 46 47 48 49 50 51 52 53 54 55 56
Confidential: For Review
th cohort, has distribution
β
ˆij ~N(β
j,σ
ˆij2 +τ
2j) whereσ
ˆij2 is within-study variance of βˆ as ijestimated from the Cox regression model (4;5). Parameters
β
jand 95% CIs were estimated in themeta-analysis. Cox model estimation for each cohort was performed using the PHREG procedure in SAS version 9.2. Meta-analysis estimation was performed using the SAS MIXED procedure.
RESULTS
More than 1.14 million participants from 19 cohorts were included in the analysis (Table 1). Overall, the mean BMI for the study population was 22.9 (SD=3.6; range: 19.8 - 23.7). Nearly 34% of study subjects were ever smokers. Over a mean follow-up of 9.2 years, approximately 120,700 cohort members died. Approximately one-third of deaths were due to each of the following causes: cardiovascular diseases (CVD) (35.7%), cancer (29.9%), and other causes (34.3%). Considerable variation, however, existed across the cohorts.
Compared to those with a BMI of 22.6 to 25.0, adjusted HRs for total mortality were elevated among groups with lower BMI in both Asian groups (Table 2). Subjects in the lowest BMI group (<15.0) had an approximately 2- to 2.8-fold elevated risk. Compared with the reference group, HRs for total mortality were elevated with an increasing BMI in East Asians, but not in
Indians/Bangladeshis. In general, the magnitude of the association was similar in ever smokers and lifetime nonsmokers. Results for men and women are similar to those shown in Table 2
(Supplementary Tables S1, S2).
To evaluate possible influence due to reverse causation, we performed analyses that excluded subjects with a baseline diagnosis of CHD, stroke, and/or cancer (Table 3). These exclusions had minimal impact on the point estimate of HRs for the association between BMI and total mortality. Excluding two more years of follow-up (from the first three years to the first five years) slightly
3 4 5 6 7 8 9 10 11 12 13 14 15 16 17 18 19 20 21 22 23 24 25 26 27 28 29 30 31 32 33 34 35 36 37 38 39 40 41 42 43 44 45 46 47 48 49 50 51 52 53 54 55 56 57
Confidential: For Review
attenuated the positive association with low BMI but had no impact on the results for high-BMI groups. Following the exclusion of smokers, the elevated risk associated with lower BMI was attenuated, whereas the positive association with higher BMI was slightly strengthened in East Asians. No positive association of total mortality with high BMI was seen in the Indian/Bangladeshi group in all analyses regardless of the types of exclusions. These results indicate that any possible reverse causation was adequately addressed in analyses conducted among lifetime nonsmokers, after excluding deaths that occurred within the first three years of follow-up, an approach that was used in all main analyses in this study.
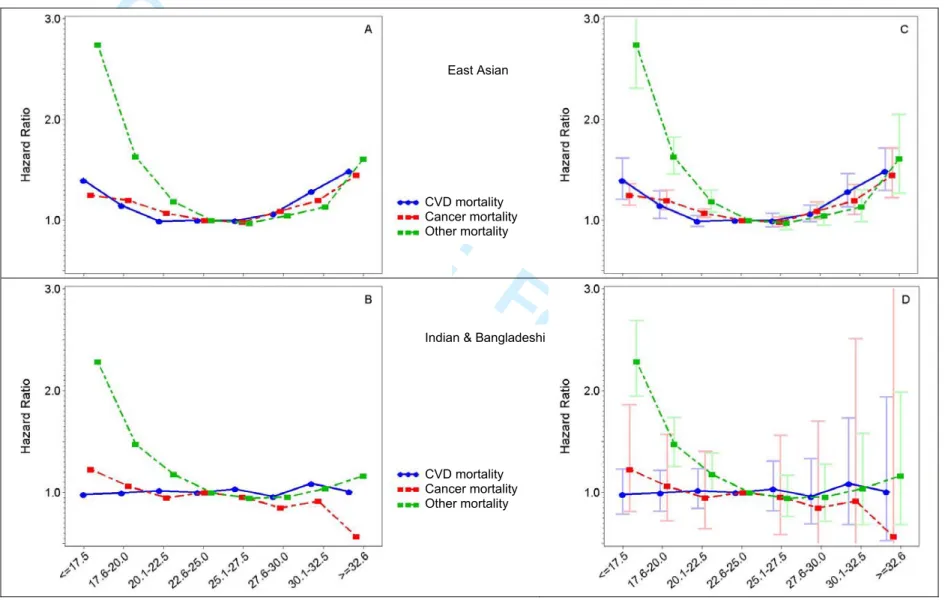
As with the findings for total mortality, a U-shaped association was found between BMI and mortality from CVD, cancer, and other causes in East Asians but not in Indians/Bangladeshis (Fig. 1). In fact, no elevated risk in the high-BMI groups was seen for any of the three cause-specific mortality outcomes in Indians/Bangladeshis. The positive association of low BMI was strongest for other-cause mortality. Results of stratified analyses by smoking status are, in general, consistent with the pattern shown in Fig, 1, although point estimates for some BMI categories were not statistically significant, due to small sample size (Supplementary Tables S3, S4).
The strikingly positive association between low BMI and other-cause mortality was primarily caused by deaths due to respiratory diseases (Fig, 2). After excluding respiratory-disease deaths, the positive association with low BMI was substantially reduced. The association between BMI and respiratory-disease mortality was similar in smokers and non-smokers (Supplementary Fig. 1). It is possible that the observed strong association between low BMI and respiratory diseases mortality could be explained, in part, by reverse causation since respiratory disease can lead to weight loss long before clinical diagnosis.
DISCUSSION 3 4 5 6 7 8 9 10 11 12 13 14 15 16 17 18 19 20 21 22 23 24 25 26 27 28 29 30 31 32 33 34 35 36 37 38 39 40 41 42 43 44 45 46 47 48 49 50 51 52 53 54 55 56
Confidential: For Review
In this pooled analysis of approximately 850,000 East Asians, both low and high BMI were associated with an increased risk of total and cause-specific mortality in this population, resulting in an overall U-shaped association. Analyses of data from over 287,000 Indians/Bangladeshis, however, showed that an elevated risk of death was seen only among those with low BMI. This large pooled analysis provides not only reliable estimates of the overall impact of BMI on total and cause-specific mortality in Asians, but also unique opportunities for a careful evaluation of the association between low BMI and mortality endpoints that could not be adequately investigated in most previous studies, which were conducted in populations of European origin.
The findings among the East Asian populations are, in general, consistent with those of another recent pooled analysis from the Prospective Studies Collaboration (PSC), involving 900,000 participants from 57 prospective studies, mostly from Western Europe and North America (6). Only 8% of the PSC populations were Asians (Japanese). In our analysis of data from Indians and
Bangladeshis, however, a virtually inverse association between BMI and total mortality was found. Even among East Asians, the shape of the curve of the association was quite different between the PSC and the current analysis, as were the values of the hazard ratios (higher at the low-BMI end in Asians, higher at the high-BMI end in the largely European population). Over the past 10 years, several large cohort studies have also evaluated the association of BMI with mortality, again mostly in populations of European origin (6;7-10). Although different groupings were used, these studies, in general, have found that the lowest mortality was associated with a BMI in the range of 23 to 27, regardless of study population. The finding that the same optimal weight range is associated with the lowest mortality both in the current study of East Asians and in previous studies in populations of European origins, argues strongly against the use of ethnic-specific BMI cutoff points to define overweight and obesity.
3 4 5 6 7 8 9 10 11 12 13 14 15 16 17 18 19 20 21 22 23 24 25 26 27 28 29 30 31 32 33 34 35 36 37 38 39 40 41 42 43 44 45 46 47 48 49 50 51 52 53 54 55 56 57
Confidential: For Review
In a longitudinal analysis of approximately 1.2 million Koreans, Jee et al. reported a J-shaped association between BMI and total mortality (9). The BMI associated with the lowest overall
mortality was 21.5 to 27.9 in the Korean study, similar to those found in our study for East Asians (Supplementary Tables S5, S6, S7). The magnitudes of the associations for some analyses, however, differ between the Korean study and the current study. Extensive exclusions were made in the Korean study; thus, subjects with a baseline diagnosis of CHD, cancer, liver diseases, diabetes, stroke, and respiratory diseases were not included in the Korean study. Most other cohort studies do not use such extensive exclusions in their analysis, nor did we in the present study. Because only about 16,000 Koreans were included in our analysis, the East Asian group in our study consists primarily of Chinese and Japanese. Therefore, differences in population characteristics across these populations also could contribute to inconsistencies in the findings.
Although mortality is the most critical measure of the health consequences of excess adiposity, epidemiologic studies examining the relationship between body weight and mortality are fraught with methodologic challenges (11;12). The most important of these is the problem of reverse causation, in which weight loss resulting from illness can distort the relationship between leanness and health. An additional concern is confounding, mainly by smoking tobacco, as smokers often have a lower body mass than nonsmokers. To address these problems, multiple studies have conducted analyses among nonsmokers and people who report no serious underlying illness at the time of enrollment or by excluding from analyses the early years of follow-up (13-16). However, a J- or U-shaped relation between BMI and mortality persisted after addressing major methodologic issues in the current analysis, the PSC project, and the Korean insurance cohort, as well as some other large cohort studies (6;7-10). 3 4 5 6 7 8 9 10 11 12 13 14 15 16 17 18 19 20 21 22 23 24 25 26 27 28 29 30 31 32 33 34 35 36 37 38 39 40 41 42 43 44 45 46 47 48 49 50 51 52 53 54 55 56
Confidential: For Review
There is substantial evidence supporting the biologic plausibility of a positive association between excess adiposity and mortality. Obesity is a well established risk factor for numerous chronic diseases (2). Adipose tissue has been increasingly recognized as an active endocrine organ, capable of releasing a large number of cytokines and bioactive mediators that play important roles in the pathogenesis of many obesity-related diseases (17). In contrast, an increased risk of mortality associated with a low BMI observed in our analysis and other studies remains to be fully explained. Inadequate or incomplete control for confounding or reverse causation bias could explain some of the increased risk (18). Residual influence of reverse causation may remain in our study, particularly since we did not have information on baseline infection and chronic lung disease diagnosis, so those conditions could not be excluded in our data analysis. Low BMI can be an indicator of certain other chronic medical conditions that were not adequately controlled in the study, or an indicator of poor health or living conditions such as under-nutrition, that increase the risk of premature death (21). Several recent cohort studies have shown that, even among individuals with a low BMI, elevated waist-hip ratio or waist circumference (measures of abdominal adiposity) were associated with a statistically significant increased risk of mortality (10;19); this suggests that the observed excess mortality among individuals with a low BMI may be, in part, due to the abdominal adiposity that cannot be measured adequately using BMI (20).
We did not assess mortality risk in relation to abdominal obesity, which may be particularly important in Asian populations. The interval between BMI measurement and mortality outcome ascertainment for several participating cohorts in this consortium is relatively short, raising concern about the effects of subclinical or undiagnosed chronic diseases on the results. Self-reported BMI data were included in our analysis, although the pattern of association between BMI and total
mortality was similar, regardless of the method for assessing BMI (Table S9). Social-economic status (SES) could confound the association between BMI and mortality since people with a high BMI are
3 4 5 6 7 8 9 10 11 12 13 14 15 16 17 18 19 20 21 22 23 24 25 26 27 28 29 30 31 32 33 34 35 36 37 38 39 40 41 42 43 44 45 46 47 48 49 50 51 52 53 54 55 56 57
Confidential: For Review
more likely to have a high SES in less well-developed countries (and thus better access to healthcare) than those with lower BMI. Although we adjusted for several SES indicators, such as education, a major measure of SES status, it is possible that residual confounding effects of SES remain, which could attenuate the positive association between high BMI and mortality outcomes.
In conclusion, this large pooled analysis revealed a U-shaped association between BMI and mortality in East Asians with a pattern broadly comparable to that of earlier studies conducted mostly in North American and European populations. In Indians and Bangladeshis, however, no elevated risk of total and cause-specific mortality was seen in high BMI groups. Overall, mortality in Asians, compared with Europeans, seems to be more strongly affected by low BMI and less by high BMI. Given the limitations of the current study using mortality as the outcome, additional studies are needed to quantify the association of BMI with disease incidence to better define BMI criteria for overweight and obesity in Asians.
3 4 5 6 7 8 9 10 11 12 13 14 15 16 17 18 19 20 21 22 23 24 25 26 27 28 29 30 31 32 33 34 35 36 37 38 39 40 41 42 43 44 45 46 47 48 49 50 51 52 53 54 55 56
Confidential: For Review
Disclosure:
Dr. Gupta reports receiving consulting fees from the CDC Foundation for Global Adult Tobacco
Survey. His institution, Healis - Sekhsaria Institute for Public Health, has received grants from
the World Lung Foundation for advancing tobacco control in India and consulting fees from the
Institute for Community Research for a project on smokeless tobacco use in an urban slum in
Mumbai. No other potential conflict of interest relevant to this article was reported. Disclosure
forms provided by the authors are available with the full text of this article at NEJM.org. 3 4 5 6 7 8 9 10 11 12 13 14 15 16 17 18 19 20 21 22 23 24 25 26 27 28 29 30 31 32 33 34 35 36 37 38 39 40 41 42 43 44 45 46 47 48 49 50 51 52 53 54 55 56 57
Confidential: For Review
References
(1) Abelson P, Kennedy D. The obesity epidemic. Science 2004 June 4;304(5676):1413.
(2) Haslam DW, James WP. Obesity. Lancet 2005 October 1;366(9492):1197-209.
(3) Appropriate body-mass index for Asian populations and its implications for policy and intervention strategies. Lancet 2004 January 10;363(9403):157-63.
(4) Brockwell SE, Gordon IR. A comparison of statistical methods for meta-analysis. Stat Med 2001 March 30;20(6):825-40.
(5) DerSimonian R, Laird N. Meta-analysis in clinical trials. Control Clin Trials 1986 September;7(3):177-88.
(6) Whitlock G, Lewington S, Sherliker P, Clarke R, Emberson J, Halsey J et al. Body-mass index and cause-specific mortality in 900 000 adults: collaborative analyses of 57 prospective studies. Lancet 2009 March 28;373(9669):1083-96.
(7) Flegal KM, Graubard BI, Williamson DF, Gail MH. Excess deaths associated with underweight, overweight, and obesity. JAMA 2005 April 20;293(15):1861-7.
(8) Gu D, He J, Duan X, Reynolds K, Wu X, Chen J et al. Body weight and mortality among men and women in China. JAMA 2006 February 15;295(7):776-83.
(9) Jee SH, Sull JW, Park J, Lee SY, Ohrr H, Guallar E et al. Body-mass index and mortality in Korean men and women. N Engl J Med 2006 August 24;355(8):779-87.
3 4 5 6 7 8 9 10 11 12 13 14 15 16 17 18 19 20 21 22 23 24 25 26 27 28 29 30 31 32 33 34 35 36 37 38 39 40 41 42 43 44 45 46 47 48 49 50 51 52 53 54 55 56
Confidential: For Review
(10) Pischon T, Boeing H, Hoffmann K, Bergmann M, Schulze MB, Overvad K et al. General and abdominal adiposity and risk of death in Europe. N Engl J Med 2008 November
13;359(20):2105-20.
(11) Willett WC, Dietz WH, Colditz GA. Guidelines for healthy weight. N Engl J Med 1999 August 5;341(6):427-34.
(12) Lewis CE, McTigue KM, Burke LE, Poirier P, Eckel RH, Howard BV et al. Mortality, health outcomes, and body mass index in the overweight range: a science advisory from the
American Heart Association. Circulation 2009 June 30;119(25):3263-71.
(13) Manson JE, Willett WC, Stampfer MJ, Colditz GA, Hunter DJ, Hankinson SE et al. Body weight and mortality among women. N Engl J Med 1995 September 14;333(11):677-85.
(14) Calle EE, Thun MJ, Petrelli JM, Rodriguez C, Heath CW, Jr. Body-mass index and mortality in a prospective cohort of U.S. adults. N Engl J Med 1999 October 7;341(15):1097-105.
(15) Adams KF, Schatzkin A, Harris TB, Kipnis V, Mouw T, Ballard-Barbash R et al.
Overweight, obesity, and mortality in a large prospective cohort of persons 50 to 71 years old. N Engl J Med 2006 August 24;355(8):763-78.
(16) Zhang X, Shu XO, Chow WH, Yang G, Li H, Gao J et al. Body mass index at various ages and mortality in Chinese women: impact of potential methodological biases. Int J Obes (Lond) 2008 July;32(7):1130-6.
(17) Van Gaal LF, Mertens IL, De Block CE. Mechanisms linking obesity with cardiovascular disease. Nature 2006 December 14;444(7121):875-80.
3 4 5 6 7 8 9 10 11 12 13 14 15 16 17 18 19 20 21 22 23 24 25 26 27 28 29 30 31 32 33 34 35 36 37 38 39 40 41 42 43 44 45 46 47 48 49 50 51 52 53 54 55 56 57
Confidential: For Review
(18) Manson JE, Bassuk SS, Hu FB, Stampfer MJ, Colditz GA, Willett WC. Estimating the number of deaths due to obesity: can the divergent findings be reconciled? J Womens Health (Larchmt ) 2007 March;16(2):168-76.
(19) Zhang X, Shu XO, Yang G, Li H, Cai H, Gao YT et al. Abdominal adiposity and mortality in Chinese women. Arch Intern Med 2007 May 14;167(9):886-92.
(20) Allison DB, Faith MS, Heo M, Kotler DP. Hypothesis concerning the U-shaped relation between body mass index and mortality. Am J Epidemiol 1997 August 15;146(4):339-49.
(21) Lopez-Jimenez F. Speakable and unspeakable facts about BMI and mortality. Lancet 2009 March 28;373(9669):1055-6. 3 4 5 6 7 8 9 10 11 12 13 14 15 16 17 18 19 20 21 22 23 24 25 26 27 28 29 30 31 32 33 34 35 36 37 38 39 40 41 42 43 44 45 46 47 48 49 50 51 52 53 54 55 56
Confidential: For Review
Figure legends
Figure 1. Hazard ratios for the association between BMI and cause-specific mortality by ethnicity: the Asia Cohort Consortium BMI Project. Two figures are presented for each
population (A and C for East Asians; B and D for Indians/Bangladeshis), one with and one
without confidence interval bars. HRs were adjusted for age, gender, education, urban/rural
resident, marital status, and baseline comorbidities and excluding subjects with less than three
years of follow-up.
Figure 2. Hazard ratios (HR) for the association of BMI with mortality due to respiratory
diseases or non-respiratory diseases, CVD, and cancer, the Asia Cohort Consortium BMI project.
Two figures are presented for each population (A and C for East Asians; B and D for
Indians/Bangladeshis), one with and one without confidence interval bars.
HRs were adjusted for age, gender, education, urban/rural resident, marital status, and baseline
comorbidities and excluding subjects with less than three years of follow-up.
*Excluding deaths due to respiratory diseases, CVD, and cancer. 3 4 5 6 7 8 9 10 11 12 13 14 15 16 17 18 19 20 21 22 23 24 25 26 27 28 29 30 31 32 33 34 35 36 37 38 39 40 41 42 43 44 45 46 47 48 49 50 51 52 53 54 55 56 57
Confidential: For Review
20 Cohort
No of
subjects Study entry
Years of follow-upa Age at entrya BMI a Female (%) Ever smokers (%) No of deaths Cancer death (%)c CVD death (%)c Other death (%)c India Mumbai d 146,820 1991-1997 5.2 50.8 22.3 (4.2)b 40.4 18.9 13,001 8.7 43.8 47.5 Trivandrum 129,097 1995-2002 7.5 49.5 21.8 (4.1) b 61.6 23.5 10,680 11.8 37.4 50.8 Bangladesh 11,452 2000-2002 6.6 37.1 19.8 (3.2)b 57.0 35.6 392 15.6 43.7 40.7 China (Mainland) CHEFS 154,737 1990-1992 7.2 55.4 22.6 (3.7)b 51.1 37.9 17,687 22.5 46.4 31.0 SCS d 18,100 1986-1989 16.3 55.3 22.2 (3.0) 0.0 57.3 4983 39.6 33.8 26.6 SMHS 61,379 2001-2006 3.1 54.9 23.7 (3.1)b 0.0 69.6 946 45.2 31.1 23.7 SWHS 74,873 1996-2000 8.6 52.1 24.0 (3.4)b 100.0 2.8 2895 46.4 27.6 26.0 Taiwan CBCSP 23,763 1991-1992 15.2 47.3 24.0 (3.4)b 49.7 28.9 2758 36.6 20.1 43.3 CVDFACTS 5129 1990-1993 14.9 47.0 23.7 (3.5)b 55.9 24.8 829 26.7 26.3 47.0 Singapore 63,242 1993-1999 11.5 56.5 23.1 (3.2) 55.8 30.6 10,689 36.4 34.7 28.9 Japan 3 Pref Aichi d 32,210 1985 11.6 56.2 22.1 (3.0) 52.6 50.7 5764 32.9 34.8 32.4 Ibaraki 97,578 1993-1994 11.5 58.8 23.5 (3.2)b 65.8 30.3 10,980 NAe NA NA JACC 86,671 1988-1990 12.7 57.6 22.8 (3.0) 58.2 38.6 12,888 36.8 31.0 32.2 JPHC1 42,771 1990-1992 14.4 49.6 23.6 (3.0) 52.2 40.3 3394 43.6 26.1 30.3 JPHC2 55,712 1992-1995 11.5 54.2 23.5 (3.1) 52.6 40.1 5357 44.5 24.9 30.7 3 Pref Miyagi 29,525 1984 11.6 56.9 23.2 (3.3) 55.0 43.1 5880 30.2 40.5 29.3 Miyagi 44,867 1990 12.8 52.0 23.6 (3.0) 52.1 49.5 3441 54.9 27.1 18.0 Ohsaki 47,670 1995 9.9 60.1 23.5 (3.1) 51.8 48.6 6892 35.9 32.9 31.2 Korea (KMCC) d 16,013 1993-2004 6.5 55.6 23.7 (3.3)b 60.3 36.4 1302 29.6 25.4 45.0 Total 1,141,609 1984-2006 9.2 53.9 22.9 (3.6) 53.1 33.5 120,758 29.9 35.7 34.3 a
Mean (SD) for BMI and mean for other variables. b
BMI estimated using weight and height measured at enrollment. For other studies weight and height were self-reported. c
Excluding deaths with unknown causes. d
Data on CHD diagnosis at baseline were unavailable. Table S8 provides data for cohorts with and without baseline CHD data. eNA, not available.
Confidential: Destroy when review is complete.
3 4 5 6 7 8 9 10 11 12 13 14 15 16 17 18 19 20 21 22 23 24 25 26 27 28 29 30 31 32 33 34 35 36 37 38 39 40 41 42 43 44 45 46 47 48 49 50 51 52 53 54 55
Confidential: For Review
21
Body mass index (BMI) at baseline
≤15.0 15.1-17.5 17.6-20.0 20.1-22.5 22.6-25.0 25.1-27.5 27.6-30.0 30.1-32.5 32.6-35.0 35.1-50.0 All subjectsa East Asian No. of deaths 456 3795 13,547 21,200 21,391 11,009 4679 1623 484 283 HR (95% CI)b 2.76 (1.88,4.07) 1.84 (1.65,2.05) 1.35 (1.25,1.45) 1.09 (1.05,1.14) 1.00 (reference) 0.98 (0.95,1.01) 1.07 (1.02,1.12) 1.20 (1.10,1.32) 1.50 (1.31,1.71) 1.49 (1.31,1.69) Indian & Bangladeshi
No. of deaths 755 2412 3340 3196 2349 1269 537 233 64 57 HR (95% CI)b 2.14 (1.78,2.57) 1.59 (1.40,1.81) 1.26 (1.12,1.41) 1.09 (0.97,1.23) 1.00 (reference) 0.98 (0.84,1.13) 0.94 (0.77,1.16) 1.03 (0.77,1.39) 0.86 (0.50,1.49) 1.27 (0.71,2.26) Ever smokersa East Asian No. of deaths 191 1990 7590 11,737 10,450 4733 1722 531 127 82 HR (95% CI)b 2.66 (1.62,4.37) 1.81 (1.61,2.04) 1.38 (1.28,1.49) 1.14 (1.09,1.18) 1.00 (reference) 0.97 (0.93,1.00) 1.01 (0.95,1.07) 1.18 (1.07,1.30) 1.44 (1.13,1.84) 1.60 (1.26,2.03) Indian & Bangladeshi
No. of deaths 267 1055 1277 1067 678 318 116 41 9 5 HR (95% CI)b 1.97 (1.43,2.72) 1.59 (1.28,1.98) 1.24 (1.01,1.53) 1.13 (0.92,1.40) 1.00 (reference) 0.99 (0.74,1.33) 0.99 (0.64,1.53) 1.16 (0.58,2.32) NA NA Lifetime nonsmokersa East Asian No. of deaths 247 1618 5280 8366 9925 5704 2713 1017 325 179 HR (95% CI)b 2.43 (2.06,2.87) 1.72 (1.52,1.94) 1.23 (1.12,1.35) 1.02 (0.97,1.07) 1.00 1.00 (0.95,1.06) 1.11 (1.04,1.20) 1.27 (1.12,1.43) 1.51 (1.30,1.76) 1.56 (1.31,1.86) Indian & Bangladeshi
No. of deaths 488 1357 2063 2128 1671 951 421 192 55 52 HR (95% CI)b 2.15 (1.71,2.69) 1.54 (1.31,1.81) 1.24 (1.07,1.43) 1.07 (0.93,1.23) 1.00 (reference) 0.97 (0.82,1.16) 0.94 (0.74,1.19) 1.01 (0.73,1.41) 0.86 (0.48,1.55) 1.34 (0.73,2.46) a
Included in the analysis were all subjects / ever smokers / lifetime nonsmokers from India and Bangladesh (265,036 / 55,435 / 209,596) and East Asia (779,537 / 270,045 / 479,492) b
Adjusted for age, gender, education, urban/rural resident, marital status, and baseline comorbidities and excluding subjects with less than three years of follow-up.
Confidential: Destroy when review is complete.
3 4 5 6 7 8 9 10 11 12 13 14 15 16 17 18 19 20 21 22 23 24 25 26 27 28 29 30 31 32 33 34 35 36 37 38 39 40 41 42 43 44 45 46 47 48 49 50 51 52 53 54 55
Confidential: For Review
22
All participants Lifetime nonsmokers
Low BMI groups High BMI groups Low BMI groups High BMI groups
Deaths f HR (95% CI)g Deaths f HR (95% CI)g Deaths f HR (95% CI)g Deaths f HR (95% CI)g
East Asian, total 74226 1.18 (1.14,1.22) 47512 1.06 (1.04,1.08) 31543 1.13 (1.09,1.18) 24010 1.08 (1.05,1.10) Excluding first 3 years of follow-upa 59933 1.18 (1.14,1.22) 39469 1.06 (1.04,1.08) 25189 1.13 (1.09,1.18) 19863 1.08 (1.05,1.10) Subjects with CHD data at baselinea 49807 1.18 (1.14,1.23) 34666 1.05 (1.03,1.08) 21895 1.14 (1.09,1.19) 17999 1.08 (1.05,1.10) Excluding subjects with baseline CHDa,c 46706 1.18 (1.14,1.23) 31832 1.06 (1.03,1.08) 20597 1.14 (1.09,1.19) 16531 1.08 (1.05,1.11) Excluding subjects with severe comorbiditya,d 44115 1.18 (1.14,1.23) 29964 1.06 (1.03,1.08) 19425 1.13 (1.08,1.19) 15529 1.08 (1.05,1.11) Subjects without any severe comorbiditya,e 27367 1.19 (1.13,1.25) 20162 1.06 (1.03,.109) 11012 1.13 (1.06,1.20) 9775 1.08 (1.04,1.12)
Excluding first 5 years of follow-upb 48187 1.16 (1.13,1.20) 32353 1.06 (1.04,1.08) 20078 1.12 (1.07,1.17) 16124 1.08 (1.05,1.11) Subjects with CHD data at baselineb 39552 1.17 (1.12,1.22) 28177 1.06 (1.03,1.09) 17286 1.12 (1.07,1.17) 14528 1.08 (1.04,1.11) Excluding subjects with baseline CHDb,c 37137 1.17 (1.13,1.22) 25916 1.06 (1.03,1.09) 16280 1.12 (1.07,1.17) 13362 1.08 (1.05,1.11) Excluding subjects with severe comorbidityb,d 35173 1.17 (1.13,1.21) 24511 1.06 (1.03,1.09) 15380 1.12 (1.06,1.17) 12616 1.08 (1.05,1.12) Subjects without any severe comorbiditya,e 23000 1.17 (1.12,1.23) 17010 1.06 (1.02,1.10) 9267 1.11 (1.04,1.18) 8209 1.08 (1.03,1.13) Indian & Bangladeshi, total 18988 1.16 (1.12,1.21) 7295 1.00 (0.93,1.06) 12155 1.15 (1.09,1.21) 5392 1.00 (0.93,1.07) Excluding first 3 years of follow-upa 11297 1.16 (1.12,1.21) 4509 1.00 (0.93,1.06) 7219 1.15 (1.09,1.21) 3342 1.00 (0.93,1.07) Subjects with CHD data at baselinea 5876 1.17 (0.99,1.38) 1962 0.99 (0.73,1.33) 3410 1.17 (0.94,1.46) 1437 0.99 (0.71,1.39) Excluding subjects with baseline CHDa,c 5733 1.17 (0.99,1.39) 1892 0.99 (0.73,1.34) 3349 1.17 (0.94,1.47) 1385 0.99 (0.71,1.39) Excluding subjects with severe comorbiditya,d 5694 1.17 (0.99,1.39) 1871 0.99 (0.72,1.34) 3322 1.17 (0.94,1.47) 1369 0.99 (0.70,1.40)
Excluding first 5 years of follow-upb 5459 1.14 (1.08,1.21) 2154 0.98 (0.90,1.08) 3398 1.12 (1.04,1.21) 1599 1.00 (0.90,1.11) Subjects with CHD data at baselineb 3611 1.15 (0.93,1.43) 1253 1.01 (0.70,1.47) 2082 1.16 (0.87,1.54) 904 1.03 (0.68,1.55) Excluding subjects with baseline CHDb,c 3529 1.15 (0.93,1.43) 1216 1.01 (0.69,1.47) 2045 1.16 (0.87,1.55) 875 1.02 (0.67,1.55) Excluding subjects with severe comorbiditya,d 3512 1.15 (0.93,1.43) 1206 1.00 (0.68,1.47) 2033 1.16 (0.87,1.55) 868 1.02 (0.67,1.55)
a
Excluding subjects with less than 3 years of follow-up b
Excluding subjects with less than 5 years of follow-up c
Excluding subjects with a prior diagnosis of coronary heart disease at baseline and restricted to cohorts that collected data on prior CHD diagnosis at baseline. d
Excluding subjects with a prior diagnosis of coronary heart disease, cancer, or stroke at baseline and restricted to cohorts that collected data on prior CHD diagnosis at baseline. e
Excluding subjects with a prior diagnosis of coronary heart disease, cancer, or stroke at baseline and restricted to cohorts that collected complete data on prior CHD, cancer, and stroke diagnosis at baseline. This analysis was not performed for the Indian & Bangladesh group since none of the cohorts in this population collected complete data on these comorbidity diagnoses at baseline.
f
Deaths in the reference level are included in the proportional hazards model for both low and high BMI group analyses. g
HRs represent the incremental effect per BMI category from 22.6-25.0 to 20.1-22.5, 17.6-20.0, and 15.1-17.5 in the low BMI group analysis and 22.6-25.0 to 25.1-27.5, 27.6-30.0, 30.1-32.5, 32.6-35, and 35.1-50.0 in the high BMI group analysis. All models adjusted for age, gender, education, urban/rural resident, marital status, and baseline comorbidities.
Confidential: Destroy when review is complete.
3 4 5 6 7 8 9 10 11 12 13 14 15 16 17 18 19 20 21 22 23 24 25 26 27 28 29 30 31 32 33 34 35 36 37 38 39 40 41 42 43 44 45 46 47 48 49 50 51 52 53 54 55
Confidential: For Review
Figure 1. Hazard ratios for the association between BMI and cause-specific mortality by ethnicity: the Asia Cohort Consortium BMI Project. Two figures are presented for each population (A and C for East Asians; B and D for Indians/Bangladeshis), one with and one without confidence interval bars. HRs were adjusted for age, gender, education, urban/rural resident, marital status, and baseline comorbidities and excluding subjects with less than three years of follow-up.
East Asian
Indian & Bangladeshi CVD mortality Cancer mortality Other mortality CVD mortality Cancer mortality Other mortality
Confidential: Destroy when review is complete.
3 4 5 6 7 8 9 10 11 12 13 14 15 16 17 18 19 20 21 22 23 24 25 26 27 28 29 30 31 32 33 34 35 36 37 38 39 40 41 42 43 44 45 46 47 48 49 50 51 52 53 54 55
Confidential: For Review
Figure 2. Hazard ratios (HR) for the association of BMI with mortality due to respiratory diseases or non-respiratory diseases, CVD, and cancer, the Asia Cohort Consortium BMI project. Two figures are presented for each population (A and C for East Asians; B and D for Indians/Bangladeshis), one with and one without confidence interval bars. HRs were adjusted for age, gender, education, urban/rural resident, marital status, and baseline comorbidities and excluding subjects with less than three years of follow-up.
*Excluding deaths due to respiratory diseases, CVD, and cancer.
East Asian
Respiratory diseases Other*
Indian & Bangladeshi
Respiratory diseases Other*
Confidential: Destroy when review is complete.
3 4 5 6 7 8 9 10 11 12 13 14 15 16 17 18 19 20 21 22 23 24 25 26 27 28 29 30 31 32 33 34 35 36 37 38 39 40 41 42 43 44 45 46 47 48 49 50 51 52 53 54 55