國 立 交 通 大 學
材 料 科 學 與 工 程 學 系
博 士 論 文
鐵錳鋁鉻碳合金相變化與抗腐蝕
研 究 生:段 逸 軒
指導教授:劉 增 豐 博士
指導教授:
朝 春 光 博士
中 華 民 國 九 十 九 年 七 月
Phase Transformations and Corrosion
Behaviors in Fe-Mn-Al-Cr-C Alloys
研 究 生:段逸軒 Student: Yi-Hsuan Tuan
指導教授:劉增豐 博士 Advisor: Prof. Tzeng-Feng Liu
指導教授:
朝春光 博士
Advisor:
Prof. Chuen-Guang Chao
國 立 交 通 大 學
材 料 科 學 與 工 程 學 系
博 士 論 文
A Dissertation
Submitted to Department of Materials Science and Engineering College of Engineering
National Chiao Tung University in Partial Fulfillment of the Requirements
for the Degree of Doctor of Philosophy
in
Materials Science and Engineering July 2010
Hsinchu, Taiwan, Republic of China
致謝
由衷的感謝指導老師劉增豐教授以及朝春光教授多年來的悉心指導以 及諄諄教誨,使學生的研究實驗能夠順利且完成此論文。除了在研究領域 上所遇到的困難之外,劉增豐教授對學生在生活上所遇到的問題與困難, 也總是時時的關心以及開導,對於學生能夠持續不放棄的完成學業有莫大 的影響,對此心中也是十二萬分的感激。另外也要感謝師母林美慧老師多 年來對學生的關心以及鼓勵,學生僅此致上最誠摯的感謝。 感謝實驗室的眾多學長學弟們在實驗過程及論文撰寫中對我的幫助。學 長鄭祥成博士、李堅瑋博士、陳志壕博士、王承舜博士、楊勝裕博士、學 弟蘇俊瑋博士,對於我在儀器的使用操作及分析上,給予了無私的教導與 幫助。另外蔡國棟學長、學弟志龍、伯至、浩仰、凱明、永昌、信良以及 眾多曾經共事過的同學及學弟們,對於我在生活及論文撰寫上也給予了很 大的幫助,對此由衷的表示感謝。也希望還在為了各自的學位及將來奮鬥 的學弟們,在接下來的日子裡,不論在學業上或是在生活上都能一切順心。 最後我最需要感謝的就是我最親愛的父母、家人以及總是在背後默默支 持我的另一半其芬,有了你們多年來的支持以及鼓勵,我才能夠心無旁鶩、 無後顧之憂的完成我的學業。對於你們的付出,我的心中只有滿滿的感恩 與感動。鐵錳鋁鉻碳合金相變化與抗腐蝕
研究生:段逸軒 指導教授:劉增豐 博士 朝春光 博士國立交通大學材料科學與工程學系
中文摘要
本論文利用掃描式電子顯微鏡,穿透式電子顯微鏡與 X 光能量散佈分 析儀等,觀察研究單一沃斯田鐵以及(肥粒鐵 + 沃斯田鐵)雙相 FeMnAlCrC 合金之顯微結構及抗腐蝕性。依據實驗結果,本論文所得到的具體研究結 果如下: (一)、在淬火狀態下,Fe-30wt.%Mn-9wt.%Al-5wt.%Cr-0.7wt.%C 合金的顯 微結構為單一沃斯田鐵相。當此合金在 550 到 750℃ 時效處理後, 細微的 (Fe,Mn)3AlC 碳化物 (k′ 碳化物) 會在沃斯田鐵相基地內形 成。此外,隨著時效溫度的上昇,在晶界上的顯微結構變化依序為: (M7C3 碳化物 + D03) → (M7C3 碳化物 + B2) → (M7C3 碳化物 + α)。此現象至今從未被其他學者在 FeMnAlC 以及 FeMnAlCrC 合金系統中發現過。 (二)、在淬火狀態下,Fe-30wt.%Mn-7wt.%Al-xwt.%Cr-1wt.%C alloys (x=0, 3, 6 和 9) 合金的顯微結構為單一沃斯田鐵相。經過電化學腐蝕測試的 研究發現,除了不含鉻的合金之外,其餘合金都能發現有明顯的鈍化區。在鉻的添加不超過 6 wt.% 時, 腐蝕電位及孔蝕電位皆會隨著鉻 含量的增加而明顯的上昇。但是當鉻含量增加到 9 wt.% 時,腐蝕電 位及孔蝕電位皆會下降。造成此抗腐蝕性質變差的原因是由於在沃斯 田鐵基地內和晶界上有 (Fe,Mn,Cr)7C3 碳化物析出。對於高鉻含量 (Cr≥3wt.%) FeMnAlCrC 的抗腐蝕性質研究從未在以前的文獻中被發 表過。 (三)、在淬火狀態下,Fe-30wt.%Mn-10wt.%Al-4st.%Cr-0.45wt.%C 合金的顯 微結構為(肥粒鐵 + 沃斯田鐵)之混合相。當此合金在 550℃ 做時效 處理後,Hägg 碳化物 (M5C2-type 碳化物) 會在 D03 區域的 a/2 〈100〉反向晶界上析出。此種 Hägg 碳化物至今從未被其他學者在 FeMnAlC 以及 FeMnAlCrC 合金系統中發現過。利用穿透式電子顯 微鏡以及擇區繞射技術,Hägg 碳化物與 D03 基地之間的方向關係 為: (510)M5C2 //(110)D03 以及 (134)M5C2 //(102)D03。Hägg 碳化物和 α-type (α, D03, B2) 相間的方向關係也從未被其他學者中發現過。 (四)、Fe-30wt.%Mn-10wt.%Al-4st.%Cr-0.45wt.%C 合金在固溶處理並急速淬 火後,其顯微結構為(肥粒鐵 + 沃斯田鐵)之混合相。當此合金經過 650℃ 時效處理後,細微的 (Fe,Mn)3AlC 碳化物 (k′ 碳化物) 會在沃 斯田鐵相基地內形成。此外,隨著時效時間的延長,在肥粒鐵基地內 的顯微結構之變化依序為:(B2 + Hägg 碳化物) → (B2 + Hägg 碳化物
構之變化至今從未被其他學者在 FeMnAlC 以及 FeMnAlCrC 合金系 統中發現過。
Phase Transformations and Corrosion Behaviors
in Fe-Mn-Al-Cr-C Alloys
Student: Yi-Hsuan Tuan Advisors: Prof. Tzeng-Feng Liu Prof. Chuen-Guang Chao
Department of Materials Science and Engineering
National Chao Tung University
Abstract
Phase transformations and corrosion behaviors in the fully austenitic and (α + γ) duplex FeMnAlCrC alloys have been investigated by means of scanning electron microscopy, transmission electron microscopy and energy-dispersive X-ray spectrometry. On the basis of the experimental examinations, the results can be summarized as follows:
[1] The as-quenched microstructure of the Fe-30wt.%Mn-9wt.%Al-5wt.%Cr- 0.7wt.%C alloy was single-phase austenite. When the as-quenched alloy was aged at 550℃-750℃, fine (Fe,Mn)3AlC carbides (k′ carbides) were
formed within the austenite matrix. In addition, as the aging temperature increased, a M7C3 carbide+D03 → M7C3 carbide+B2 → M7C3 carbide+α
FeMnAlCrC alloy systems before.
[2] The as-quenched microstructure of the Fe-30wt.%Mn-7wt.%Al-xwt.%Cr- 1wt.%C alloys (x=0, 3, 6 and 9) was single-phase austenite. The electrochemical corrosion properties of the present alloys in 3.5% NaCl solution have been investigated. An obvious passivation could be observed for all the alloys except for the alloy without Cr content. The corrosion potential (Ecorr) and pitting potential (Epp) increased pronouncedly with
increasing Cr content up to 6wt.%, and decreased as Cr content up to 9wt.%. The decrease of Ecorr and Epp of the alloy containing 9wt% Cr was due to
the formation of (Fe,Mn,Cr)7C3 carbides in the austenite matrix and on the
grain boundaries. It is noted that the corrosion behaviors of the austenitic Fe-Mn-Al-Cr-C alloys with higher Cr (≥ 3wt.%) content have never been reported in previous literatures.
[3] The as-quenched microstructure of the Fe-30wt.%Mn-10wt.%Al-4st.%Cr- 0.45wt.%C alloy was (α + γ) dual phases. When the alloy was aged at 550℃, Hägg carbides (M5C2-type carbides) occurred at a/2〈100〉 anti-phase
boundaries of the D03 domains. The Hägg carbide has never been observed
by previous workers in FeMnAlC and FeMnAlCrC alloy systems. By means of transmission electron microscopy and diffraction technique, the orientation relationship between Hägg carbide and D03 matrix was
determined to be (510)M5C2 //(110)D03 and (134)M5C2 //(102)D03. The
orientation relationship between Hägg carbide and bcc-type phase has also never been reported in previous literatures before.
[4] The as-quenched microstructure of the Fe-30wt.%Mn-10wt.%Al-4wt.%Cr- 0.45wt.%C alloy was (α+γ) dual phases. When the as-quenched alloy was aged at 650℃, fine κ′ carbides were formed within the γ grains. Additionally, with increasing the aging time at 650℃, a (B2 + Hägg carbide) → (B2 + Hägg carbide + β-Mn) → (B2 + Hägg carbide + β-Mn + M23C6 carbide)
phase transition had occurred within the α grain. This phase transition has never been observed by other workers in the FeMnAlC and FeMnAlCrC alloy systems before.
Contents
page 中文摘要 ………..…………..………. i Abstract ………....………. iv Contents ……….…………. vii List of Tables ……….……… ix List of Figures ……….…….……… xChapter 1. General Introduction ... 1
Chapter 2. Grain boundary precipitation in Fe-30Mn-9Al-5Cr-0.7C alloy .. 11
2-1 Introduction ………...… 13
2-2 Experimental procedure ………...…. 15
2-3 Results and discussion ………... 16
2-4 Conclusions ………... 32
References ………. 33
Chapter 3. Corrosion behaviors of austenitic Fe-30Mn-7Al-xCr-1C alloys in 3.5% NaCl solution ………...………...… 34
3-1 Introduction ………...… 36
3-2 Experimental procedure ………...…. 38
3-3 Results and discussion ………... 41
References ………. 54
Chapter 4. Formation of Hägg carbide in an Fe-30Mn-10Al-4Cr-0.45C alloy .. 56
4-1 Introduction ………...… 58
4-2 Experimental procedure ………...…. 61
4-3 Results and discussion ………... 62
4-4 Conclusions ………... 76
References ………. 77
Chapter 5. Phase transformations in an Fe-30Mn-10Al-4Cr-0.45C alloy .. 79
5-1 Introduction ………...… 81
5-2 Experimental procedure ………...…. 84
5-3 Results and discussion ………... 85
5-4 Conclusions ………... 104
References ………. 105
List of Tables
Table 2.1 Chemical compositions of the phases identified by energy-dispersive X-ray spectrometer (EDS). ………. 31 Table 3.1 Chemical compositions of the present alloys (wt.%). …………..…. 40 Table 3.2 The electrochemical parameters from potentiodynamic polarization
curves for the Fe-30wt.%Mn-7wt.%Al-(0, 3, 6 and 9)wt.%Cr- 1wt.%C alloys in 3.5% NaCl solution. ...………. 47 Table 4.1 The d-spacings of the Hägg carbide. ………. 70 Table 4.2 Angles among some reciprocal vectors of the Hägg carbide. ……… 71 Table 4.3 Chemical compositions of the phases revealed by EDS. ………...… 72 Table 5.1 Chemical compositions of the phases revealed by energy-dispersive
List of Figures
Figure 2.1 Transmission electron micrographs of the alloy aged at 550℃ for 6h. (a) BF, and (b) an SADP taken from a mixed region covering the austenite matrix and fine κ carbides. The zone axis is [001] (hkl: austenite matrix; hkl: κ carbide) ………... 17 Figure 2.2 Transmission electron micrographs of the alloy aged at 550℃ for 24h.
(a) BF, (b) an SADP taken from the D03 phase marked “D” in (a).
The zone axis is [011], and (c) an SADP taken from the M7C3
carbide marked “M” in (a). The zone axis is [1120]. ………. 18
Figure 2.3 Transmission electron micrographs of the alloy aged at 550℃ for 48h. (a) BF, (b) (100)κ DF, (c) and (d) (111) and (200) D03 DF,
respectively. ………. 22 Figure 2.4 Transmission electron micrographs of the alloy aged at 650℃ for 12h.
(a) and (b) BF taken from the grain boundary and austenite matrix, respectively, (c) and (d) (111) and (200) D03 DF, respectively. …... 24
Figure 2.5 Transmission electron micrographs of the alloy aged at 750℃ for 6h. (a) BF, (b) and (c) (111) and (200) D03 DF, respectively. ……….... 26
alloy aged at 550℃ for 48h. ……… 30 Figure 3.1 Optical micrographs of the Fe-30wt.%Mn-7wt.%Al-(6, 9)wt.%Cr-
1wt.%C alloys. (a) 6 wt.%Cr, and (b) 9 wt.%Cr. …………..……. 43 Figure 3.2 Potentiodynamic polarization curves for the five Fe-30wt.%Mn-
7wt.%Al-(0, 3, 6, and 9)wt.%Cr-1wt.%C alloys in 3.5% NaCl solution. ……….. 44 Figure 3.3 AES depth profiles for the passive film of the Fe-30wt.%Mn-
7wt.%Al-(0, 6, and 9)wt.%Cr-1wt.%C alloys. (a) 0 wt.%Cr, (b) 6 wt.%Cr, and (c) 9 wt.%Cr. ………. 45 Figure 3.4 Transmission electron micrographs of the Fe-30wt.%Mn-7wt.%Al
-9wt.%Cr-1wt.%C alloy. (a) BF, and (b) a selected-area diffraction pattern taken from a (Fe,Mn,Cr)7C3 carbide in (a). The zone axis of
the (Fe,Mn,Cr)7C3 carbide is [1210]. (c) and (d) two typical EDS
profiles obtained from the (Fe,Mn,Cr)7C3 carbide and the γ matrix
nearby the (Fe,Mn,Cr)7C3 carbide, respectively. ………...…. 49
Figure 4.1 BF transmission electron micrograph taken from the γ matrix of the alloy aged at 550℃ for 12 h. ……….….. 63 Figure 4.2 Transmission electron micrographs taken from the D03 matrix of the
(001)M5C2 DF image. ………. 64
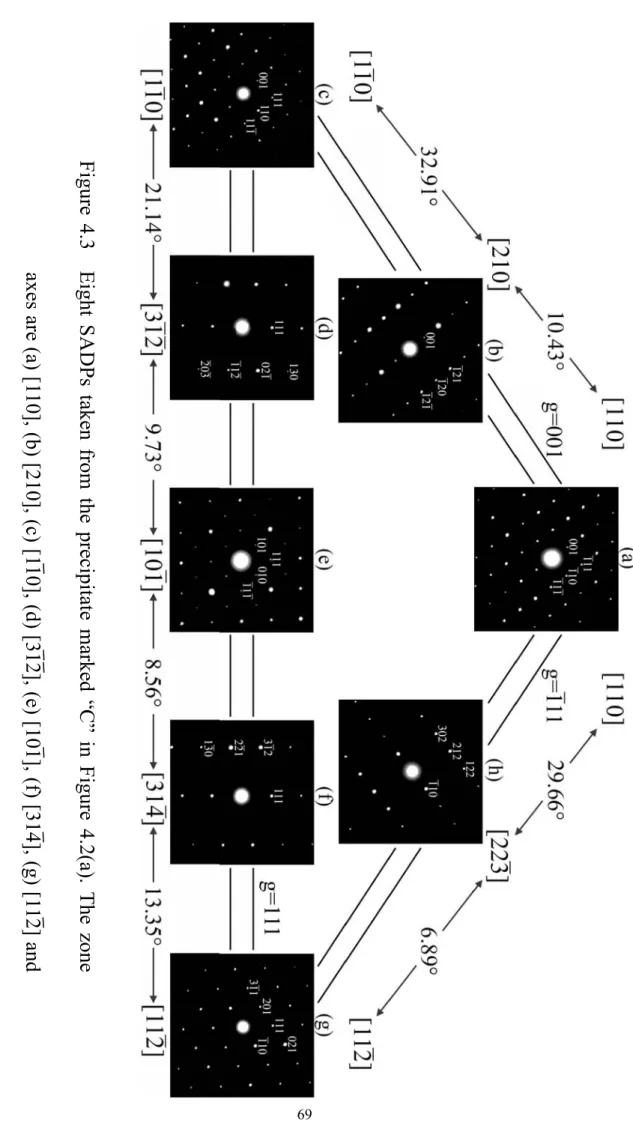
Figure 4.3 Eight SADPs taken from the precipitate marked “C” in Figure 4.2(a). The zone axes are (a) [110], (b) [210], (c) [110], (d) [312], (e)
] 1
[10 , (f) [314], (g) [112] and (h) [223], respectively. ………... 69
Figure 4.4 Two SADPs taken from an area including the precipitate marked “C” in Figure 4.2(a) and its surrounding matrix. The zone axes are (a) [152]M5C2, [110]D03 and (b) [154]M5C2, [221] D03, respectively.
(hkl=M5C2 carbide; hkl=D03 phase) ……….... 75
Figure 5.1 Transmission electron micrographs of the as-quenched alloy. (a) an SADP taken from the α grain. The zone axis is [011] (hkl: α phase, hkl: D03 phase). (b) and (c) (111) and (200) D03 DF image,
respectively. ………...…. 87 Figure 5.2 Transmission electron micrographs of the alloy aged at 650℃ for 6 h. (a) BF taken from the γ grain. (b) BF taken from the α grain. (c) and (d) (111) and (200) D03 DF images, respectively. ………...… 89
Figure 5.3 (a) through (c) Three SAPDs taken from the precipitate marked “C” in Figure 5.2(b). The zone axes are (a) [110], (b) [101] and (c)
Figure 5.4 (a) SEM image of the alloy aged at 650℃ for 12 h. (b) SADP taken from the precipitate marked “B” in Figure 5.4(a). The zone axis is [001]. (c) through (d) Three SADPs taken from an area including the precipitate marked “B” in Figure 5.4(a) and its surrounding matrix. The zone axes are (c) [001]β-Mn, [012]B2, (d) [012]β-Mn, [001]B2 and
(e) [031]β-Mn, [011]B2, respectively. ………..…… 93
Figure 5.5 (a) SEM image of the alloy aged at 650℃ for 18 h. (b) through (e) Transmission electron micrographs of the alloy aged at 650℃ for 18 h. (b) BF. (c) through (e) Three SADPs taken from the precipitate marked “P” in Figure 5.5(b). The zone axes are (c) [010], (d) [011] and (e) [111], respectively. ……….. 96 Figure 5.6 SEM image of the alloy aged at 650℃ for 36 h. …………..….. 101
Chapter 1.
General Introduction
Phase transformations, mechanical properties and corrosion resistance in fully austenitic FeMnAlC alloys have been extensively studied by many workers [1-34]. In these studies, it is seen that the as-quenched microstructure of the FeMnAlC alloys with a chemical composition in the range of Fe-(26-34)wt.%Mn-(6-11)wt.%Al-(0.54-1.3)wt.%C was single-phase austenite (γ). When the as-quenched alloys were aged at 500~750℃ for moderate times, fine and coarse (Fe,Mn)3AlC carbide having an L′12-type structure could be
observed to precipitate coherently within the γ matrix and heterogeneously on the γ/γ grain boundaries, respectively. For convenience, the κ′ carbide and κ carbide were used to represent the (Fe,Mn)3AlC carbide formed coherently
within the γ matrix and heterogeneously on the γ/γ grain boundaries [8]. After prolonged aging time within this temperature range, the coarse κ carbide would grow into adjacent γ grains through a γ → α (ferrite) + β-Mn reaction, a γ → γ0
(carbon-deficient austenite) + κ reaction, a γ → β-Mn + κ reaction or a γ → α + β-Mn + κ reaction on the grain boundaries in the fully austenitic FeMnAlC alloys, depending on the chemical composition and aging temperature [5-10].
Additionally, in the previous studies [1-14], it was reported that the as-quenched microstructure of the Fe-(26-34)wt.%Mn-(7.8-10)wt.%Al-(0-1.75) wt.%M(M=Nb+V+Mo+W)-(0.85-1.3)wt.%C alloys was single γ phase or γ
phase with small amount of (Nb,V)C carbides [1-14]. In the as-quenched condition, the alloys show various ultimate tensile strength (UTS) ranging from 840 to 950 MPa, yield strength (YS) ranging from 410 to 550 MPa and elongation from 70 to 57%, depending on the chemical composition [8, 11-25]. Based on these previous studies, it can be generally concluded that due to the formation of the fine k′ carbides within the γ matrix and no precipitates on the grain boundaries, the alloys could possess an optimal combination of strength and ductility when the as-quenched alloys were aged at 550℃ for about 16 h [8-10, 14]. With an elongation better than about 30%, the values of UTS and YS could be attained to be 953~1259 MPa and 665~1094 MPa, respectively [8-10, 14-15].
In addition to extensive studies of FeMnAlC alloys with C≦1.3 wt.%, the phase transformations in the FeMnAlC alloys with higher carbon content have also examined by several workers [15, 35-38]. In their studies, it is obvious that the as-quenched microstructure of Fe-(26-30.7)wt.%Mn-(6-9)wt.%Al-(1.5-2.8) wt.%C alloys was γ phase containing fine κ′ carbides [15, 35-38]. The fine κ′ carbides were formed by spinodal decomposition during quenching [35-38]. This is quite different from that observed by other workers in the austenitic FeMnAlC alloys with C≦1.3 wt.%. After being aged at 550~1150℃, the fine κ′
boundaries [15, 35-36]. The UTS, YS and elongation of the as-quenched FeMnAlC alloys with 1.8≦C≦2.0 wt.% were 1080~1105 MPa, 868~883 MPa and 55.5~54.5 %, respectively [37-38]. Obviously, with equivalent elongation, the mechanical strength was much higher than that examined in the as-quenched FeMnAlC alloys with C≦1.3 wt.%. Furthermore, after being aged 450~550℃ for moderate times, the alloys could possess high UTS ranging from 1395 to 1552 MPa and YS ranging from 1262 to 1423 MPa with a good elongation ranging from 32.5 to 25.8 % [37-38].
The as-quenched microstructure of the FeMnAlC alloys with 0.4≦C≦0.51 wt.% was (α+γ) dual phases [11, 39-40]. When the alloys were aged at 550~710℃ for moderate times, fine κ′ carbide were found to precipitate within the γ matrix, and coarse κ carbides as well as β-Mn precipitates could be observed within the α grains and on the α/α grain boundaries [39-40]. In 1991, the present workers examined the microstructural developments of an Fe-28.6wt.%Mn-10.1wt.%Al-0.46wt.%C alloy [41]. Consequently, it was found that in the as-quenched condition, extremely fine D03 domains could be
observed within the α grains. The extremely fine D03 domains were formed by a
continuous ordering transition during quenching. This is different from that reported by other workers in the (α+γ) duplex FeMnAlC alloys. When the alloy was aged at temperatures ranging from 450℃ to 750℃, the phase
transformation sequence occurring within the α grain was found to be α + D03
→ α + D03 + κ → α + B2 + κ → α [41]. The tensile properties of (α+γ) duplex
FeMnAlC alloys have also been investigated by many worker before [11, 42-43]. In their studies, the UTS, YS and elongation of the alloys in as-quenched condition were ranging between 570~786 MPa, 240~472 MPa and 70~35 %, respectively [11, 42-43].
Although the austenitic FeMnAl(M)C alloys could possess a remarkable combination of strength and ductility, the corrosion resistance of the alloys in aqueous environments was not adequate for applications in industry [44-48]. In order to improve the corrosion resistance, Cr has been added to the austenitic FeMnAlC alloys [47-50]. Consequently, it was found that the Ecorr and Epp of the
as-quenched austenitic Fe-(29.2-31.3)wt.%Mn-(7.1-9.1)wt.%Al-(2.8-6)wt.%Cr- (0.88-1.07)wt.%C alloys in 3.5% NaCl solution were ranging from -820 to -556 mV and from -240 to -27 mV, respectively [47-50]. The results were much better than the Ecorr (-920~-789 mV) and Epp (-500~-280 mV) of the austenitic
as-quenched FeMnAlC alloys [44-48]. However, the improvement of corrosion resistance due to the addition of Cr was not obvious in the (α+γ) duplex FeMnAlCrC alloys [44, 51-52].
FeMnAlCrC alloys is very deficient. Therefore, the purpose of the present study is an attempt to investigate the microstructural evolutions and corrosion behaviors of the austenitic and (α+γ) duplex FeMnAlCrC alloys by using OM, SEM, TEM, Auger electron spectroscopy (AES) and X-ray photoelectron spectroscopy (XPS), Potentiostat/Galvanostat and energy dispersive X-ray spectrometer (EDS) analyses. The detailed experiment results are presented in Chapters 2 through 5.
References
1. K. Sato, K. Tagawa, Y. Inoue, Scripta Metall. 22 (1988) 899. 2. T.F. Liu, J.S. Chou, C.C. Wu, Metal. Trans. A 21 (1990) 1891. 3. K.H. Han, J.C. Yoon, W.K. Choo, Scripta Metall. 20 (1986) 33. 4. C.N. Hwang, T.F. Liu, Scripta Mater. 36 No.8 (1997) 853.
5. C.Y. Chao, C.N. Hwang, T.F. Liu, Scripta Metall. 28 (1993) 109. 6. K. Sato, K. Tagawa, Y. Inoue, Metal. Trans. A 21 (1990) 5.
7. C.N. Hwang, C.Y. Chao, T.F. Liu, Scripta Metall. 28 (1993) 263. 8. W.K. Choo, J.H. Kim, J.C. Yoon, Acta Mater. 45 (1997) 4877.
9. I.S. Kalashnikov, O. Acselrad, A. Shalkevich, J. Mater. Process. Technol. 136 (2003) 72.
10. G.S. Krivonogov, M.F. Alekseyenko and G.G. Solovyeva, Fiz. Metal. Metalloved 39 No.4 (1975) 775.
11. S.C. Tjong, S.M. Zhu, Mater. Trans. 38 No.2 (1997) 112.
12. I.S. Kalashnikov, O. Aksel’rad, M.S. Khadyev, Metal Sci. Heat Treat. 48 (2006) 5.
13. Kalashnikov, O. Acselrad, A. Shalkevich, L.C. Pereira, J. Mater. Eng. Perform. 9 (2000) 597.
15. Y. Kimura, K. Handa, K. Hayashi, Y. Mishima, Intermetallics 12 (2004) 607.
16. S.K. Banerji, Met. Prog. (1987) 59.
17. H.W. Leavenworth, Jr. and J.C. Benz, J. Met. (1985) 36.
18. J. Charles, A. Berghezan, A. Lutts, P.L. Dancoisne, Met. Prog. (1981) 71. 19. R. Wang, F.H. Beck, Met. Prog. (1983) 72.
20. J.C. Grcia, N. Rosas, R.J. Rioja, Met. Prog. (1982) 47. 21. D.J. Schmatz, Trans. ASM. 52 (1960) 898.
22. M.F. Alekseyenko, G.S. Krivonogov, L.G. Kozyreva, I.M. Kachanova, L.V. Arapova, Met. Sci. Heat Treat. 14 No.3-4 (1972) 187.
23. L.I. Lysak, M.F. Alekseyenko, A.G. Drachinskaya, N.A. Storchak, G.S. Krivonogov, Metallofizika 59 No.4 (1975) 29.
24. R.E. Cairns, Jr. and J.L. Ham, U.S. patent, No. 3111405 (1963). 25. I. Briggs, G.J. Russell, A.G. Clegg, J. Mater. Sci. 20 (1985) 668. 26. W.K. Choo, K.H. Han, Metall. Trans. A 16 (1985) 5.
27. W.K. Choo, D.G. Kim, Metall. Trans. A 18 (1987) 759. 28. S.C. Tjong, N.G. Ho, Metallography 21 (1988) 199. 29. G.L. Kayak, Met. Sci. Heat Treat. 22 No.2 (1969)95. 30. S.M. Zhu, S.C. Tjong, Metall. Trans. A 29 (1998)299.
Mater. Eng. Perform. 9 (2000)334.
32. S.C. Tjong, C.S. Wu, Mater. Sci. Eng. 80 (1986) 203. 33. I.F. Tsu, T.P. Perng, Metall. Trans. A 22 (1991) 215. 34. S.M. Zhu, S.C. Tjong, Scripta 36 (1997) 317.
35. K. Ishida, H. Othani, N. Statoh, R. Kainuma, T. Nishizawa, ISIJ International 30 (1990) 680.
36. C.S. Wang, C.N. Hwang, C.G. Chao, T.F. Liu, Scripta Mater. 57 (2007) 809. 37. K.M. Chang, C.G. Chao, T.F. Liu, Scripta Mater. 63 (2010) 162.
38. C.L. Lin, C.G. Chao, H.Y. Bor, T.F. Liu, Mater. Trans. 51 No.6 (2010) 1084. 39. S.C. Tjong, N.J. Ho, Metallography 21 (1988) 1996.
40. T.F. Liu, C.M. Wan, Strength Met. Alloys 1 (1986) 423.
41. C.C. Wu, J.S. Chou, T.F. Liu, Metall. Trans. A 22A (1991) 2265. 42. K.S. Chan, L.H. Chen, T.S. Lui, Mater. Trans. 38 No.5 (1997) 420. 43. S.C. Chang, Y.H. Hsiau, M.T. Jahn, J. Mater. Sci. 24 (1989) 1117. 44. M. Ruscak, T.P. Perng, Corrosion Oct. (1995) 738.
45. W.T. Tsai, J.B. Duh, J.T. Lee, J. Mater. Sci. 22 (1987) 3517. 46. J.B. Duh, W.T. Tsai, J.T. Lee, Corrosion Nov. (1988) 810.
47. S.C. Chang, J.Y. Liu, H.K. Juang, Corrosion 51 No.5 (1995) 399. 48. C.J. Wang, Y.C. Chang, Mater. Chem. Phys. 76 (2002) 151.
50. Y.H. Tuan, C.S. Wang, C.Y. Tsai, C.G. Chao, T.F. Liu, Mater. Chem. Phys. 114 (2009) 595.
51. S.C. Chang, W.H. Weng, H.C. Chen, S.J. Lin, P.C.K. Chung, Wear 181-183 (1995) 511.
Chapter 2.
Grain boundary precipitation in
Fe-30Mn-9Al-5Cr-0.7C alloy
Grain boundary precipitation in
Fe-30Mn-9Al-5Cr-0.7C alloy
Abstract
The as-quenched microstructure of the Fe-30wt.%Mn-9wt.%Al-5wt.%Cr- 0.7wt.%C alloy was single-phase austenite. When the as-quenched alloy was aged at 550~750℃, fine (Fe,Mn)3AlC carbides were formed within the austenite
matrix. In addition, as the aging temperature increased, a M7C3 carbide+D03 →
M7C3 carbide+B2 → M7C3 carbide+α (ferrite) phase transition had occurred
on the grain boundaries. This grain boundary precipitation behavior has never before been observed in FeMnAlC and FeMnAlCrC alloy systems.
2-1 Introduction
Phase transformations in austenitic FeMnAlC alloys have been extensively studied by many workers [1-8]. These studies have shown that in the as-quenched condition, the microstructure of the alloy with a chemical composition in the range of Fe-(26-34)wt.%Mn-(6-11)wt.%Al-(0.54-1.3)wt.%C was single-phase austenite (γ). After being aged at 500-750℃ for moderate times, fine and coarse (Fe,Mn)3AlC carbides (κ carbides) having an L'12-type
structure were observed to precipitate coherently within the austenite matrix and also heterogeneously on the austenite grain boundaries, respectively. With increasing aging time within this temperature range, the coarse κ carbides grew into the adjacent austenite grains through a γ → γ0 (carbon-deficient austenite)+
κ carbide reaction, a γ → α+κ carbide reaction, a γ → κ carbide+β-Mn reaction, or a γ → α+κ carbide+β-Mn reaction [5-8], depending on the chemical composition and aging temperature. In order to improve the corrosion resistance, chromium has been added to the austenitic FeMnAlC alloys [9-12]. In their studies, it was concluded that the chromium addition could effectively improve the corrosion resistance of the alloys. However, to date, information about the influence of Cr addition on the microstructural developments of the austenitic FeMnAlC alloys is very deficient. Therefore, the purpose of this work
2-2 Experimental procedure
Fe-30wt.%Mn-9wt.%Al-5wt.%Cr-0.7wt.%C alloy, was prepared in an induction furnace by using commercial 99.9% Fe, Mn, Al, Cr and pure carbon powder under a controlled protective argon atmosphere. After being homogenized at 1250℃ for 12h, the ingot was hot-forged and then cold-rolled to a final thickness of 3.0 mm. The sheet was subsequently solution heat-treated (S.H.T.) at 1050℃ for 2h and then rapidly quenched into room temperature water. Isothermal aging was performed at 550-850℃ for various times in a vacuum furnace and then quenched. Specimens for electron microscopy were prepared by means of a double-jet electropolisher with an electrolyte of 65% ethanol, 20% acetic acid and 15% perchloric acid. Electron microscopy was performed with JEOL 2000FX scanning transmission electron microscope (STEM) operating at 200 kV. This microscope was equipped with a Link ISIS 300 energy-dispersive X-ray spectrometer (EDS) for chemical analysis. Quantitative analyses of elemental concentrations for Fe, Mn, Al and Cr were made using the Cliff-Lorimer ratio thin section method.
2-3 Results and discussion
Transmission electron microscopy examinations indicated that in the as-quenched condition, the microstructure of the alloy was single-phase austenite. Figure 2.1(a) is a bright-field (BF) electron micrograph of the alloy aged at 550℃ for 6 h, revealing that fine precipitates with a modulated structure were formed along the <100> directions within the austenite matrix and no evidence of precipitates could be detected on the grain boundary. A selected-area diffraction pattern (SADP) taken from a mixed region covering the austenite matrix and fine precipitates (Fig. 2.1(b)), demonstrates that the fine precipitates are (Fe,Mn)3AlC carbides (κ carbides) having an L'12 structure [4-7]. After
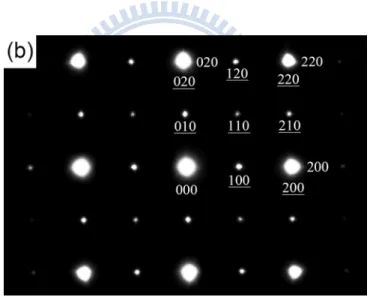
prolonged aging at 550℃, a heterogeneous reaction started to occur on the grain boundaries. A typical microstructure is illustrated in Fig. 2.2(a). Figures 2.2(b) and (c) are two SADPs taken from the precipitates marked as “D” and “M” in Fig. 2.2(a), indicating that the two kinds of coarse precipitates were of D03
phase and (Fe,Mn,Cr)7C3 (designated as M7C3) carbide, respectively [3, 13].
This result indicates that the precipitation of (M7C3 carbide + D03 phase) had
occurred on the grain boundaries. By increasing the aging time at the same temperature, the precipitation would proceed toward the inside of the austenite grains, as illustrated in Fig. 2.3. Figure 2.3(a) is a BF electron micrograph of the
Figure 2.1 (a)
Figure 2.1 (b)
Figure 2.1 Transmission electron micrographs of the alloy aged at 550℃ for 6h. (a) BF, and (b) an SADP taken from a mixed region covering the austenite matrix and fine κ carbides. The zone axis is [001] (hkl: austenite matrix; hkl: κ carbide)
Figure 2.2 (a)
Figure 2.2 (c)
Figure 2.2 Transmission electron micrographs of the alloy aged at 550℃ for 24h. (a) BF, (b) an SADP taken from the D03 phase marked “D” in
Figure 2.2(a). The zone axis is [011], and (c) an SADP taken from the M7C3 carbide marked “M” in (a). The zone axis is [1120].
alloy aged at 550℃ for 48h, revealing that the precipitation of (M7C3 carbide +
D03 phase) has a lamellar structure. Figure 2.3(b) is a (100)κ dark-field (DF)
electron micrograph, revealing the presence of fine κ carbides within the austenite matrix. Figures 2.3(c) and (d) are (111) and (200) D03 enlarged DF
electron micrographs, clearly revealing that the (111) D03 DF image and (200)
D03 DF image are morphologically identical. Since the (200) reflection spot
comes from both the B2 and D03 phases, while the (111) reflection spot comes
only from the D03 phase [14], the bright precipitates presented in Figs. 2.3(c)
and (d) are considered to be D03 phase.
When the alloy was aged at 650℃, the morphology of the grain boundary M7C3 carbides changed from plate-like to granular shape, as shown in Fig. 2.4(a).
Figure 2.4(b) is a BF electron micrograph taken from the austenite matrix, showing that the amount of the fine κ carbides within the austenite matrix was drastically decreased. Figures 2.4(c) and (d) are (111) and (200) D03 enlarged
DF electron micrographs of the grain boundary, revealing the presence of the extremely fine D03 and large B2 domains, respectively. Since the size of the D03
domains is extremely fine, it is plausible to suggest that the extremely fine D03
domains were formed by a B2 → D03 ordering transition during quenching from
electron microscopy of thin foils indicated that the precipitation of (M7C3
carbide + B2) was preserved up to 700℃. Figures 2.5(a) through (c) are BF, (111) and (200) D03 DF electron micrographs of the alloy aged at 750℃ for 6h
and then quenched, revealing that besides the presence of the M7C3 carbide
(marked as “M” in Fig. 2.5(a)), only extremely fine D03 domains and small B2
domains could be observed on the grain boundaries. This indicates that the grain boundary microstructure of the alloy present at 750℃ should be a mixture of (M7C3 carbide + α), and the extremely fine D03 domains and small B2 domains
were formed by a α→B2→D03 continuous ordering transition during quenching
[14]. Progressively higher temperature aging and quenching experiments indicated that the grain boundary precipitation of (M7C3 carbide + α) could be
observed up to 800℃. However, when the aging temperature was increased to 850℃, only single-phase austenite could be observed and no evidence of the grain boundary precipitation could be detected.
The fact that the phase transition of M7C3 carbide+D03 → M7C3 carbide+
B2 → M7C3 carbide+α had occurred on the grain boundaries in the alloy aged
at 550~750℃ is a remarkable feature in the present study. This grain boundary precipitation behavior has never before been observed in FeMnAlC and FeMnAlCrC alloy systems. In order to clarify this feature, an STEM-EDS study
Figure 2.3 (a)
Figure 2.3 (c)
Figure 2.3 (d)
Figure 2.3 Transmission electron micrographs of the alloy aged at 550℃ for 48h. (a) BF, (b) (100)κ DF, (c) and (d) (111) and (200) D03 DF,
Figure 2.4 (a)
Figure 2.4 (c)
Figure 2.4 (d)
Figure 2.4 Transmission electron micrographs of the alloy aged at 650℃ for 12h. (a) and (b) BF taken from the grain boundary and austenite matrix, respectively, (c) and (d) (111) and (200) D03 DF,
Figure 2.5 (a)
Figure 2.5 (c)
Figure 2.5 Transmission electron micrographs of the alloy aged at 750℃ for 6h. (a) BF, (b) and (c) (111) and (200) D03 DF, respectively.
was made. Figures 2.6(a) and (b) represent two typical EDS spectra taken from a M7C3 carbide and the D03 phase in the alloy aged at 550℃ for 48h, where the Fe,
Mn, Al, and Cr peaks were examined (EDS with a thick-window detector is limited to detect the elements of atomic number of 11 or above; therefore, carbon cannot be examined by this method). The quantitative chemical compositions of M7C3 and D03 phases from Figs. 2.6(a) and (b) are listed in
Table 2.1. For the comparison, the chemical compositions of the M7C3 carbide,
B2 and α phases in the alloy aged at different temperatures are also listed in Table 2.1. In Fig. 2.6 and Table 2.1, it is clearly seen that when the alloy was aged at 550℃, the Mn and Cr contents in the M7C3 carbide are much higher than
those of the as-quenched alloy, and the reverse result is obtained for the Al content. Since it is known that the Mn is an austenite former in the FeMnAlC alloy system, the precipitation of coarse Mn-rich M7C3 carbide on the grain
boundary would cause the austenite phase in the vicinity of the coarse M7C3
carbides to become unstable. Furthermore, it is seen in Table 2.1 that the Al content in the M7C3 carbide is only about 1.83 at.%, which is much less than that
in the as-quenched alloy. It is thus anticipated that along with the precipitation of the M7C3 carbides, the surrounding regions would be enriched in Al. In Fe-Al
phase diagram [14], it is seen that when an Fe-26.31at.%Al alloy is heated at 550℃, the microstructure was a D03 phase. Therefore, it is reasonable to believe
that owing to the enrichment of Al, the unstable austenite phase would be transformed into the D03 instead of the α phase. Similarly, when the alloy was
aged at 650℃ as well as 750℃ and then quenched, the Al-rich B2 and α phases could be formed at the regions contiguous to the M7C3 carbides, and B2 → D03
as well as α → B2 → D03 ordering transitions would be expected to occur
during quenching [14]. This is in agreement with the experimental observations in Figs. 2.4 and 2.5, respectively. Finally, it is worthwhile pointing out that the coarse Mn-rich κ carbides were always observed on the grain boundaries in the austenitic FeMnAlC alloys aged at 500~750℃ for longer times [5-8, 15]. However, only (Mn,Cr)-rich M7C3 carbides were formed, and no evidence of
coarse κ carbides could be detected on the grain boundaries in the present alloy aged at 550~750℃. Obviously, the chromium addition in the austenitic FeMnAlC alloys would bring about for the formation of the (Mn,Cr)-rich M7C3
carbides and suppress the precipitation of the coarse Mn-rich κ carbides on the grain boundaries.
Figure 2.6 (a)
Figure 2.6 (b)
Figure 2.6 EDS spectra taken from (a) M7C3 carbide, and (b) D03 phase in the
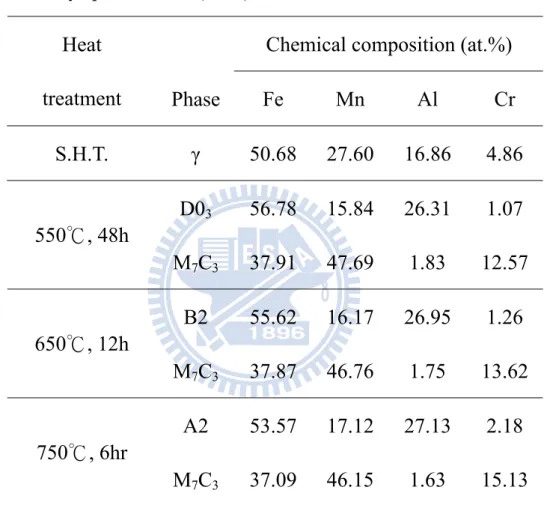
Table 2.1 Chemical compositions of the phases identified by energy-dispersive X-ray spectrometer (EDS).
Chemical composition (at.%) Heat treatment Phase Fe Mn Al Cr S.H.T. γ 50.68 27.60 16.86 4.86 D03 56.78 15.84 26.31 1.07 550℃, 48h M7C3 37.91 47.69 1.83 12.57 B2 55.62 16.17 26.95 1.26 650℃, 12h M7C3 37.87 46.76 1.75 13.62 A2 53.57 17.12 27.13 2.18 750℃, 6hr M7C3 37.09 46.15 1.63 15.13
2-4 Conclusions
As-quenched microstructure of the Fe-30wt.%Mn-9wt.%Al-5%wt.Cr- 0.7wt.%C alloy was single-phase austenite. When the as-quenched alloy was aged at 550~750℃, fine κ carbides were formed within the austenite matrix, and a M7C3+D03 → M7C3+B2 → M7C3+α phase transition had occurred on the
References
1. S. Kalashnikov, O. Acselrad, A. Shalkevich, J. Mater. Process. Technol. 136 (2003) 72.
2. K. Sato, K. Tagawa, Y. Inoue, Scripta Metall. 22 (1988) 899. 3. T. F. Liu, J. S. Chou, C. C. Wu, Metal. Trans. A 21 (1990) 1891. 4. K. H. Han, J. C. Yoon, W. K. Choo, Scripta Metall. 20 (1986) 33. 5. C. Y. Chao, C. N. Hwang, T. F. Liu, Scripta Metall. 28 (1993) 109. 6. C. N. Hwang, C. Y. Chao, T. F. Liu, Scripta Metall. 28 (1993) 263. 7. W. K. Choo, J. H. Kim, J. C. Yoon, Acta Mater. 45 (1997) 4877. 8. K. Sato, K. Tagawa, Y. Inoue, Metal. Trans. A 21 (1990) 5.
9. C. S. Wang, C. Y. Tsai, C. G. Chao, T. F. Liu, Mater. Trans. 48 (2007) 2973. 10. S. C. Chang, J. Y. Liu, H. K. Juang, Corros. Eng. 51 (1995) 399.
11. S. C. Chang, W. H. Weng, H. C. Chen, S. J. Lin, P. C. K. Chung, Wear 181-183 (1995) 511.
12. C. J. Wang, Y. C. Chang, Mat. Chem. Phy. 76 (2002) 151. 13. F. Ernst, Y. Cao, G. M. Michal, Acta Mater. 52 (2004) 1469. 14. Samuel M. Allen, Phil. Mag. 36 (1977) 181.
15. C. S. Wang, C. N. Hwang, C. G. Chao, T. F. Liu, Scripta Metall. 57 (2007) 809.
Chapter 3.
Corrosion behaviors of austenitic
Fe-30Mn-7Al-xCr-1C alloys
Corrosion behaviors of austenitic
Fe-30Mn-7Al-xCr-1C alloys in 3.5% NaCl solution
Abstract
The corrosion behaviors of the as-quenched Fe-30wt.%Mn-7wt.%Al- xwt.%Cr-1wt.%C alloys (x=0, 3, 6 and 9) in 3.5% NaCl have been investigated. Passivation could be observed for all the alloys except for the alloy without Cr content. The corrosion potential (Ecorr) and pitting potential (Epp) increased
pronouncedly with increasing Cr content up to 6wt.%, and decreased as Cr content up to 9wt.%. The decrease of Ecorr and Epp of the alloy containing 9wt%
Cr was due to the formation of (Fe,Mn,Cr)7C3 carbides in the austenite matrix
and on the grain boundaries. It is noted that the corrosion behaviors of the austenitic Fe-Mn-Al-Cr-C alloys with higher Cr (≥ 3wt.%) content have never been reported in previous literatures.
3-1 Introduction
The austenitic Fe-Mn-Al-C quarternary alloys have many advantages, such as low cost, low density, high strength, high toughness, and good oxidation resistance [1-6]. However, the corrosion resistance of the austenitic Fe-Mn-Al-C alloys in aqueous environments was not adequate for applications in industry [5-13]. Therefore, many researchers tried to improve the corrosion resistance of the austenitic Fe-Mn-Al-C alloys by adding chromium and decreasing carbon content [6,9,14-17]. Since Cr and C are ferrite and austenite formers in ferrous alloys, respectively, the Fe-Mn-Al-Cr-C alloys with higher Cr and lower C contents consist of (austenite + ferrite) dual phases. Some literatures showed that Fe-(21.5-27.7)wt.%Mn-(8.9-9.9)wt.%Al-(3.1-6.2)wt.%Cr-(0.33-0.42)wt.%C alloys exhibited austenite and ferrite dual phases, and the mechanical properties of the dual-phase Fe-Mn-Al-Cr-C alloys were far inferior to those of austenitic ones. In order to obtain full austenitic structure, a proper combination of chromium and carbon contents was treated. In the previous studies [5,6], it was reported that the Fe-(29.5-31.3)wt.%Mn-(8.4-8.9)wt.%Al-(2.6-2.8)wt.%Cr- (0.98-1.06)wt.%C alloys had a single-phase austenite, and the corrosion resistance of the austenitic Fe-Mn-Al-Cr-C alloys was indeed superior to that of the austenitic Fe-Mn-Al-C or dual-phase Fe-Mn-Al-Cr-C alloys. However, to date, information concerning the corrosion behaviors of the austenitic
Fe-Mn-Al-Cr-C alloys with higher Cr (≥ 3wt.%) content is very deficient. In this study, the electrochemical corrosion properties of four austenitic Fe-30wt.%Mn-7wt.%Al-1wt.%C alloys with 0, 3, 6 and 9 wt.% Cr contents in 3.5% NaCl solution were investigated to evaluate the effects of Cr content on the corrosion resistance.
3-2 Experimental procedure
The chemical compositions of the alloys are shown in Table 3.1. The alloys were prepared by melting commercial pure Fe, Mn, Al, Cr and carbon powder in an induction furnace under a controlled protective argon atmosphere. The melt was cast into 30mm× 50mm × 200mm ceramic shell mold. After being
homogenized at 1473K for 24 h, the ingots were sectioned into 12mm×12mm×5mm slices. These slices were subsequently solution heat-treated
in vacuum furnace at 1373K for 2 h and then rapidly quenched into room-temperature water. Potentiodynamic polarization curves were measured in 3.5% NaCl solution at 298K. Electrochemical polarization curves were obtained by using an EG&G Princeton Applied Research Model 273 galvanostat/potentiostat. Specimens with an exposed surface area of ~1cm2 were ground with 2000-grit SiC paper and then with 1.5μm Al2O3 powder, washed in
distilled water and rinsed in acetone prior to passivation. Potentiodynamic polarization curves were obtained at a potential scan rate of 5 mV/sec from -1 V to 0.5 V. The concentration of elements in the passive film was examined by Auger electron spectroscopy (AES) and X-ray photoelectron spectroscopy (XPS). As well known, the composition quantification of AES is very poor due to matrix effect, peaks overlapping and surface roughness, etc. However, the depth profiling is one of the most important and convenient application of AES
for analysing the composition of thin surface layer. Therefore, the depth profiling of AES is an appropriate and effective method for analysing the composition distributions of the passive film in this experiment [18,19]. Microstructures were examined by using optical microscopy and transmission electron microscopy (TEM). TEM specimens were prepared by means of a double-jet electropolisher with an electrolyte of 15% perchloric acid, 25% acetic acid and 60% ethanol. Electron microscopy was performed on JEOL-2000FX STEM operating at 200 kV. This microscope was equipped with a Link ISIS 300 energy-dispersive X-ray spectrometer (EDS) for chemical analysis. Quantitative analyses of elemental concentrations for Fe, Mn, Al and Cr were made using the Cliff-Lorimer ratio thin section method.
Table 3.1 Chemical compositions of the present alloys (wt.%). Alloy Mn Al Cr C Fe A(0Cr) 29.18 7.05 0 0.96 Bal. B(3Cr) 29.92 7.12 3.01 1.04 Bal. C(6Cr) 30.12 7.06 5.96 1.01 Bal. D(9Cr) 30.02 7.08 9.05 0.98 Bal.
3-3 Results and discussion
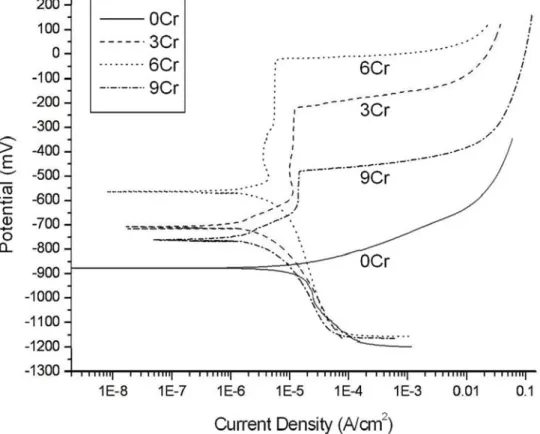
Optical microscopy examinations showed that the as-quenched microstructure of the alloys A(0Cr) through C(6Cr) was single-phase austenite. Figure 3.1(a) shows a typical optical micrograph of the alloy C(6Cr), indicating single-phase austenite with annealing twins. Transmission electron microscopy examinations indicated that besides the austenite phase, no evidence of carbides could be detected in the as-quenched alloys A(0Cr) through C(6Cr). Figure 3.1(b) is an optical micrograph of the alloy D(9Cr), revealing the presence of some carbides in the austenite matrix and on the grain boundaries. It seems to imply that Cr could be completely dissolved in the austenite matrix at 1373K as Cr ≤ 6 wt.%, and carbides could be formed at this temperature as Cr up to 9 wt.%. Potentiodynamic polarization curves for the four Fe-Mn-Al-Cr-C alloys in 3.5% NaCl solution are shown in Figure 3.2. The electrochemical parameters are summarized in Table 3.2. Ecorr of the alloys with different Cr content was varied
from -556 mV to -877 mV. Alloy C(6Cr) has the noblest Ecorr (-556mV).
Similarly, with increasing Cr content from 3 to 6 wt%, the Epp was drastically
increased from -224mV to -27mV. However, with further increasing the Cr content to 9 wt%, Epp became more negative (-472mV). The results indicate that
3.2, it is clearly seen that the passive region increased as Cr content increased from 0 to 6 wt.%, and decreased as Cr content up to 9 wt.%. In order to determine the chemical composition and the valence state of element in passive film formed on the alloys in 3.5% NaCl solution, the technique of AES/XPS was undertaken. Figure 3.3 indicates that the depth-concentration profiles for passive film formed on the alloys A(0Cr), C(6Cr) and D(9Cr). The detection of carbon concentration of outmost layer may be due to surface contamination. The O concentration of the alloy A(0Cr) was much smaller than that of the alloys C(6Cr) and D(9Cr) in depth profile. In Figure 3.3(a), it is clear that passive film was not obvious in the alloy without Cr content. However, in the alloys C(6Cr) and D(9Cr), the O concentration at the surface was much higher than that in the matrix, as illustrated in Figures 3.3(b) and (c). The Mn and Fe contents in the outmost surface were much lower than those in the matrix, but Cr and Al contents were reverse tendency. It means that the Cr and Al enrichment was attributed to the preferential dissolution of unstable oxides of Fe and Mn into electrolyte solution, and then replacement by Cr and Al within the oxide layer. There were broad peaks of Cr and Al at a depth of 0 to 2nm, which corresponded with the peak of O. This implies that the increase of Cr and Al in oxides is likely to be responsible for the improved stability of the passive film. However, the AES analysis for passive film can not explain the reason why the
Figure 3.1 (a)
Figure 3.1 (b)
Figure 3.1 Optical micrographs of the Fe-30wt.%Mn-7wt.%Al-(6, 9)wt.% Cr-1wt.%C alloys. (a) 6 wt.%Cr, and (b) 9 wt.%Cr.
Figure 3.2 Potentiodynamic polarization curves for the five Fe-30wt.%Mn- 7wt.%Al-(0, 3, 6, and 9)wt.%Cr-1wt.%C alloys in 3.5% NaCl solution.
Figure 3.3 (a)
Figure 3.3 (c)
Figure 3.3 AES depth profiles for the passive film of the Fe-30wt.%Mn- 7wt.%Al-(0, 6, and 9)wt.%Cr-1wt.%C alloys. (a) 0 wt.%Cr, (b) 6 wt.%Cr, and (c) 9 wt.%Cr.
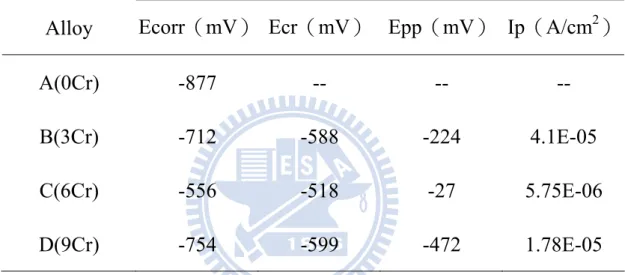
Table 3.2 The electrochemical parameters from potentiodynamic polarization curves for the Fe-30wt.%Mn-7wt.%Al-(0, 3, 6 and 9)wt.%Cr- 1wt.%C alloys in 3.5% NaCl solution.(*)
Electrochemical Parameters from Polarization Curves Alloy Ecorr(mV) Ecr(mV) Epp(mV) Ip(A/cm2)
A(0Cr) -877 -- -- --
B(3Cr) -712 -588 -224 4.1E-05 C(6Cr) -556 -518 -27 5.75E-06
D(9Cr) -754 -599 -472 1.78E-05
(*)Ecorr, corrosion potential; Ecr, critical potential for active-passive transition;
Ecorr of the alloy D(9Cr) decreased (more negative), as indicated in Table 3.2. In
order to obtain more information, the alloy with 9 wt.% Cr content was examined by TEM. Figure 3.4(a), a bright-field electron micrograph, clearly reveals the presence of carbides in the austenite matrix. Figure 3.4(b) is a selected-area diffraction pattern taken from a carbide. Compared to the previous studies [20], it is clear that the carbide is (Fe,Mn,Cr)7C3 with lattice parameters a
= 1.398nm and c = 0.452nm. Figures 3.4(c) and (d) are two EDS profiles taken from a (Fe,Mn,Cr)7C3 carbide and the austenite matrix nearby the (Fe,Mn,Cr)7C3
carbide, respectively. The quantitative analyses of ten different EDS profiles showed that the chemical composition of the carbide was Fe-0.56wt.%Al- 40.12wt.%Mn-34.39wt.%Cr (EDS with the thick-window detector can only detect the elements with atomic number 11 or above, hence carbon is unable to be examined by this method), and the chemical composition of the austenite matrix nearby the carbide was Fe-10.51wt.%Al-25.48wt.%Mn-2.73wt.%Cr. It is clearly seen that the Cr content in the (Fe,Mn,Cr)7C3 carbide is up to 34.39wt.%,
which is much higher than that in the austenite matrix nearby the (Fe,Mn,Cr)7C3
carbide. It is thus expected that the conspicuous decrease of the Cr content in the austenite matrix was ascribed to the formation of Cr-rich (Fe,Mn,Cr)7C3 carbides.
Therefore, it is deduced that the formation of Cr-rich (Fe,Mn,Cr)7C3 carbides
Figure 3.4 (a)
Figure 3.4 (c)
Figure 3.4 (d)
Figure 3.4 Transmission electron micrographs of the Fe-30wt.%Mn-7wt.%Al- 9wt.%Cr-1wt.%C alloy. (a) BF, and (b) a selected-area diffraction pattern taken from a (Fe,Mn,Cr)7C3 carbide in (a). The zone axis of
the (Fe,Mn,Cr)7C3 carbide is [1210]. (c) and (d) two typical EDS
profiles obtained from the (Fe,Mn,Cr)7C3 carbide and the γ matrix
Based on the preceding results, it is clear that no evidence of passivation could be found in the alloy A(0Cr) and the Ecorr of the alloy was -877mV. This
result is similar to that examined by other workers in the as-quenched austenitic Fe-(26.0-32.2)wt.%Mn-(8.3-10.0)wt.%Al-(0.85-1.45)wt.%C alloys in 3.5% NaCl solution, in which they reported that only narrow passive region could be observed and the Ecorr of the alloys was in the range from -789 to -920 mV
[5-9,14]. However, an obvious broad passive region could be detected in the present alloys containing Cr. This shows that the Cr addition is indeed beneficial for the corrosion resistance of the austenitic Fe-Mn-Al-C alloys in NaCl solution, which is in agreement with that examined by other workers in the austenitic Fe-(29.5-31.3)wt.%Mn-(8.4-8.9)wt.%Al-(2.6-2.8)wt.%Cr-(0.98-1.06)wt.%C alloys [5,6]. In addition, the Ecorr value for the alloy B(3Cr) was -712 mV, which
is comparable to about -720 mV for the as-quenched Fe-29.5wt.%Mn- 8.4wt.%Al-2.6wt.%Cr-1.06wt.%C alloy in 3.5% NaCl solution reported by other workers [6]. In the present study, we have further shown that the 6.0 wt.% Cr addition was completely dissolved in the Fe-30wt.%Mn-7wt.%Al-1.0wt.%C alloy at 1373K. Thus, the Ecorr and Epp values would be pronouncedly increased
to -556 mV and -27mV, respectively, in the alloy C(6Cr). However, when the Cr addition was increased up to 9 wt%, the Cr-rich (Fe,Mn,Cr)7C3 carbides could
(Fe,Mn,Cr)7C3 carbides resulted in the drastic decrease of the Ecorr and Epp
3-4 Conclusions
The corrosion potential (Ecorr) of the as-quenched Fe-30wt.%Mn-7wt.%Al- (0,
3, 6 and 9)wt.%Cr-1wt.%C alloys increased from -877 mV to -556 mV as Cr content increased from 0 to 6 wt.%. However, the Ecorr of the alloy with 9 wt.%
Cr dropped to -754 mV due to the formation of (Fe,Mn,Cr)7C3 carbides in the
austenitic matrix and on the grain boundaries. The result indicates that the alloy C (6Cr) exhibited the highest corrosion resistance in 3.5% NaCl solution. Passivation could be observed for all of the present alloys except for the alloy without Cr content.
References
1. Zhu SM, Tjong SC, Metalls. Trans. A 29 (1998) 299. 2. Choo WK, Kim JH, Yooh JC, Acta Mater. 45 (1997) 4877.
3. Kalashnikov IS, Acselrad O, Pereira LC, Kalichak T, Khadyyev MS, Journal of Materials Engineering and Performance 9 (2000) 334.
4. Chang SC, Hsiau YH, J. Mater. Sci. 24 (1989) 1117.
5. Chang SC, Liu JY, Juang HK, Corrosion. Eng. 51 (1995) 399.
6. Chang SC, Weng WH, Chen HC, Lin SJ, Chung PCK, Wear 181-183 (1995) 511.
7. Tsai WT, Duh JB, Lee JT, J. Mater. Sci. 22 (1987) 3517. 8. Duh JB, Tsai WT, Lee JT, Corrosion Nov (1988) 810. 9. Ruscak M, Perng TP, Corrosion Oct (1995) 738. 10. Tjong SC, Wu CS, Mater. Sci. Eng. 80 (1986) 203.
11. Tjong SC, Surface and Coatings Technology 28 (1986) 181. 12. Wang CJ, Chang YC, Mater. Chem. Phy. 76 (2002) 151. 13. Zhu XM, Zhang YS, Corrosion 54 (1998) 3.
14. Shih ST, Tai CY, Perng TP, Corrosion Feb (1993) 130. 15. Tsu IF, Perng TP, Metall. Trans. A 22 (1991) 215.
16. Wu CC, Chou JS, Liu TF, Metall. Trans. A 22 (1991) 2265. 17. Zhu SM, Tjong SC, Scripta 36 (1997) 317.
18. J.M. Walls, Methods of Surface Analysis, Cambridge University Press, New York, 1989.
19. David Briggs, John T, Grant (Ed.), Surface Analysis by Auger and X-Ray 20. Ernst F, Cao Y, Michal GM, Acta Materialia 52 (2004) 1469.
Chapter 4.
Formation of Hägg carbide in an
Fe-30Mn-10Al-4Cr-0.45C alloy
Formation of Hägg carbide in an
Fe-30Mn-10Al-4Cr-0.45C alloy
Abstract
When the present alloy was aged at 550 , Hägg carbides (M℃ 5C2-type
carbides) occurred at a/2〈100〉 anti-phase boundaries of the D03 domains. The
Hägg carbide has never been observed by previous workers in FeMnAlC and FeMnAlCrC alloy systems. The orientation relationship between Hägg carbide and D03 matrix was determined to be (510)
_ M5C2 //(110) _ D03 and (134) _ M5C2
//(102_)D03. The orientation relationship between Hägg carbide and bcc-type
4-1 Introduction
In previous studies [1-6], it is seen that the as-quenched microstructure of the Fe-(28-34)wt.%Mn-(7.8-11)wt.%Al-(0.54-1.3)wt.%C alloys was single-phase austenite (γ). After being aged at 500~750 for moderate times, ℃ fine and coarse (Fe,Mn)3AlC carbides were found to precipitate coherently
within the γ matrix and heterogeneously on the γ/γ grain boundaries, respectively. For convenience, the κ′ carbide and κ carbide were used to represent the (Fe,Mn)3AlC carbide formed coherently within the γ matrix and
heterogeneously on the γ/γ grain boundaries [2]. After prolonged aging time within this temperature range, the coarse κ carbides grew into adjacent γ grains through a γ → α (ferrite) + β-Mn reaction, a γ → γ0 (carbon-deficient austenite)
+ κ reaction, a γ → β-Mn + κ reaction or a γ → α + β-Mn + κ reaction [1-5], depending on the chemical composition and aging temperature. In the FeMnAlC alloys with lower carbon content (i.e. 0.4~0.51wt.%C), the as-quenched microstructure was found to be (γ+α) dual phases [7-9]. After being aged at 550~710 , fine κ′ carbides were found to appear within the γ grai℃ ns, and coarse κ carbides as well as β-Mn precipitates could be observed in the α grains and on the α/α grain boundaries [8, 9]. In 1991, the present workers examined the microstructural developments of an Fe-28.6wt.%Mn-10.1wt.%Al-0.46wt.%C alloy [10]. Consequently, it was found that in the as-quenched condition,
extremely fine D03 domains could be observed within the α grains. This is
different from that reported by other workers in the duplex FeMnAlC alloys. When the alloy was aged at temperatures ranging from 450 to 750 , the ℃ ℃ phase transformation sequence occurring within the α grain was found to be α + D03 → α + D03 + κ → α + B2 + κ → α [10].
In order to improve the corrosion resistance and high-temperature oxidation resistance, the Cr has been added to the austenitic or duplex FeMnAlC alloys [11-15]. Based on these results, it can be generally concluded that the addition of Cr does achieve these results. Additionally, the effects of Cr addition on the microstructures of the austenitic FeMnAlC alloys have also been examined by several researchers [16-17]. In the previous study [16], it is seen that when the Fe-30wt.%Mn-9wt.%Al-5wt.%Cr-0.7wt.%C alloy was aged at 550~750 , the ℃ fine κ′ carbides were formed within the γ grain, and a (M7C3 + D03) → (M7C3 +
B2) → (M7C3 + α) reaction occurred on the γ/γ grain boundaries. Besides, when
the Fe-28.3wt.%Mn-8.7wt.%Al-5.5wt.%Cr-1wt.%C alloy was aged at 800-1250 , a (γ + Cr℃ 7C3) → γ → (γ + (α + B2 + D03)) reaction occurred within
the γ grain and on the γ/γ grain boundaries [17]. In contrast to the studies of the austenitic FeMnAlCrC alloys, information concerning the microstructures of the (γ+α) duplex FeMnAlCrC alloys is very deficient. Therefore, the purpose of this
4-2 Experimental procedure
The Fe-30wt.%Mn-10wt.%Al-4wt.%Cr-0.45wt.%C alloy was prepared in a vacuum induction furnace using pure Fe, Mn, Al, Cr and carbon powder. After being homogenized at 1250 for 12 h, the ingot was hot℃ -rolled to a final thickness of 2.0 mm. The sheet was subsequently solution heat-treated (SHT) at 1050 for℃ 1 h and then rapidly quenched into room-temperature water. Aging process was performed at 550 for 12 h in a vacuum furnace followed by rapid ℃ quenching. Electron microscopy specimens were prepared by means of a double-jet electropolisher with an electrolyte of 65% ethanol, 20% acetic acid and 15% perchloric acid. Electron microscopy was performed on a JEOL 2100 transmission electron microscope (TEM) operating at 200kV. This microscope was equipped with a Link ISIS 300 energy-dispersive X-ray spectrometer (EDS) for chemical analysis. Quantitative analyses of elemental concentrations for Fe, Mn, Al and Cr were made using the Cliff-Lorimer ratio thin section method. The EDS with a thick-window detector is limited to detect the elements of atomic number of 11 or above. Therefore, carbon cannot be examined by this method.
4-3 Results and discussion
In the as-quenched condition, the microstructure of the alloy was (γ+α) dual phases. No precipitates could be detected within the γ grains; however, extremely fine D03 domains could be observed within the α grains. The
extremely fine D03 domains were formed within the α grains by a continuous
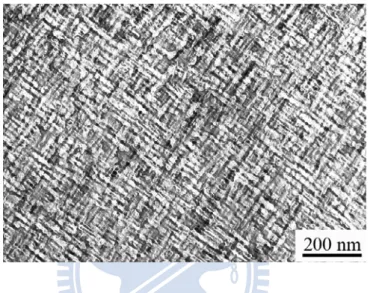
ordering transition during quenching. This is similar to that observed by the present workers in the Fe-28.6wt.%Mn-10.1 wt.%Al-0.46 wt.%C alloy [10]. When the as-quenched alloy was aged at 550 for 12 h, fine k′ carbides were ℃ formed within the γ grain, as shown in Figure 4.1(a). Figure 4.2(a) is a bright-field (BF) electron micrograph taken from the α grain, indicating that a lot of small precipitates occurred within the α matrix. Figure 4.2(b) is a selected-area diffraction pattern (SADP) taken from the α matrix, exhibiting the presence of the superlattice reflection spots of the ordered D03 phase [10].
Figures 4.2(c) and (d) are the (111) and (200) D03 dark-field (DF) electron
micrographs taken from the same area as Figure 4.2(a), clearly revealing that the (111) DF image and the (200) DF image are morphologically identical. Therefore, the bright domains presented in Figures 4.2(c) and (d) are of the D03
phase with a/2<100> anti-phase boundaries (APBs) [10]. Figure 4.2(e) is the DF image of the small precipitates, indicating that these precipitates have occurred preferentially at a/2<100> APBs of the D03 domains. A preliminary
Figure 4.1 BF transmission electron micrograph taken from the γ matrix of the alloy aged at 550 for 12 h.℃
Figure 4.2 (a)
Figure 4.2 (c)
Figure 4.2 (e)
Figure 4.2 Transmission electron micrographs taken from the D03 matrix of
the alloy aged at 550 for 12 h. (a) BF, (b) an SADP, the zone axis ℃ is [011], (c) and (d) (111) and (200) D03 DF image, respectively,
study of electron diffraction indicated that the precipitate was not of any known phases reported in FeMnAl, FeMnAlC and FeMnAlCrC alloy systems [1-17]. In order to clarify the crystal structure of the precipitate, eight SADPs taken from the precipitate marked as C in Figure 4.2(a) were obtained by tilting the specimen about some specific reflections. The results are shown in Figures 4.3(a)~(h). Table 4.1 shows the interplanar spacings of the precipitate phase, which were measured directly from the SADPs in Figures 4.3(a)~(h). The measured angles among the reciprocal lattice vectors are listed in Table 4.2. Using these measured values of the interplanar spacings and angles, the crystal structure of the precipitate was determined to be monoclinic with lattice parameters a=1.158nm, b=0.452nm, c=0.509nm, and β=98.3°. Based on these lattice parameters, the interplanar spacings and the angles between the chosen reciprocal reflections were calculated by using the following equations [18]:
β β β β 2 2 2 2 2 2 2 2 2 2 sin cos 2 sin 1 1 sin 1 1 ac hl l c k b h a d = + + −
(
)
2 / 1 2 2 2 2 2 2 2 2 2 2 2 2 1 1 2 1 2 2 2 1 2 2 1 2 1 2 2 1 2 1 2 2 2 1 2 2 1 2 cos 2 1 sin 1 1 cos 2 1 sin 1 1 cos 1 1 sin 1 1 cos ⎭ ⎬ ⎫ ⎩ ⎨ ⎧ ⎟ ⎠ ⎞ ⎜ ⎝ ⎛ + + − × ⎟ ⎠ ⎞ ⎜ ⎝ ⎛ + + − + − + + = β β β β β β φ ac l h l c k b h a ac l h l c k b h a h l h l ac l l c k k b h h ameasured values are quite consistent with those obtained by calculation. Therefore, the SADPs of the precipitate phase in Figures 4.3(a)~(h) could all be indexed. The zone axes of Figures 4.3(a)~(h) are [110], [210], [110], [312],
] 1
[10 , [314], [112] and [223], respectively. Compared with previous studies [19-23], it is clear that the crystal structure of the precipitate corresponds to that of the Hägg carbide (M5C2-type carbide).
Based on the preceding observations, two important experimental results are discussed below. ( ) The coarse MnⅠ -rich κ carbides or Mn-rich β-Mn precipitates were always observed within the α or D03 matrix in the duplex
FeMnAlC alloys aged at 450~750 [8℃ -10]. However, only M5C2 carbides were
formed at a/2<100> APBs of the well-grown D03 domains, and no evidence
of κ carbide or β-Mn precipitate could be detected within the α grain in the present alloy aged at 550 . In order to clarify the apparent difference, ℃ an TEM-EDS study was made. The average concentrations of the alloying elements were obtained from at least ten different EDS profiles of each phase. The results are summarized in Table 4.3. It is seen in Table 4.3 that the Cr and Mn concentrations in the well-grown D03 domains were much lower than those in
the as-quenched alloy, and the reverse result was obtained in the M5C2 carbide.
Therefore, it is believed that during the growth of the D03 domains, partial Cr
Figure 4.3
Eight SADPs tak
en from the precip
itate m
arked “C” in Fi
gure 4.2(a). The zone
axes are (a) [1
10], (b) [210], (c) [1 10], (d ) [312], (e) [101], (f) [314], (g) [1 12] and (h) [223], respectively .
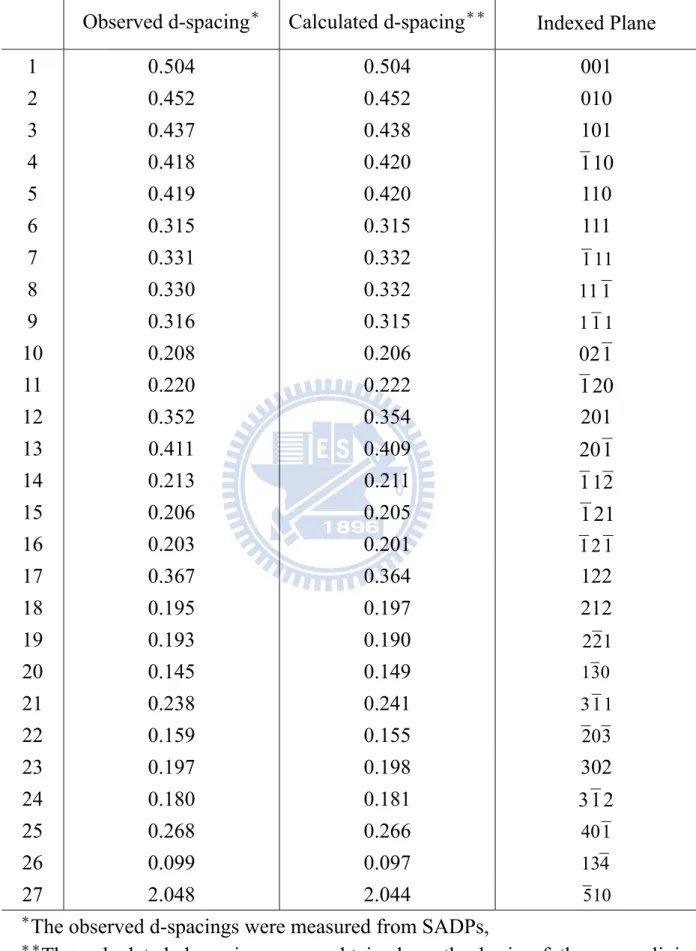
Table 4.1 The d-spacings of the Hägg carbide. Observed d-spacing* Calculated d-spacing**
Indexed Plane 1 0.504 0.504 001 2 0.452 0.452 010 3 0.437 0.438 101 4 0.418 0.420 110 5 0.419 0.420 110 6 0.315 0.315 111 7 0.331 0.332 111 8 0.330 0.332 111 9 0.316 0.315 111 10 0.208 0.206 021 11 0.220 0.222 120 12 0.352 0.354 201 13 0.411 0.409 201 14 0.213 0.211 112 15 0.206 0.205 121 16 0.203 0.201 121 17 0.367 0.364 122 18 0.195 0.197 212 19 0.193 0.190 221 20 0.145 0.149 130 21 0.238 0.241 311 22 0.159 0.155 203 23 0.197 0.198 302 24 0.180 0.181 312 25 0.268 0.266 401 26 0.099 0.097 134 27 2.048 2.044 510
*The observed d-spacings were measured from SADPs,
**The calculated d-spacings were obtained on the basis of the monoclinic
Table 4.2 Angles among some reciprocal vectors of the Hägg carbide. Two Desired
Reciprocal Vectors Observed Angle
*
Calculated Angle**
Fig. 3(a) (001) and (111) 51.8 51.9
(001) and (110) 93.1 93.0 (001) and (111) 131.5 131.6 Fig. 3(b) (001) and (121) 67.5 67.6 (001) and (120) 91.4 91.6 (001) and (121) 115.0 115.1 Fig. 3(c) (001) and (111) 48.5 48.4 (001) and (110) 87.0 87.0 (001) and (111) 128.3 128.1 Fig. 3(d) (111) and (021) 68.5 68.7 (111) and (112) 107.5 107.4 (111) and (203) 135.7 135.5
Fig. 3(e) (111) and (101) 44.3 44.1
(111) and (010) 45.8 45.9 (111) and (111) 91.6 91.8 Fig. 3(f) (111) and (312) 68.3 68.2 (111) and (221) 102.5 102.4 (111) and (130) 130.2 130.0 Fig. 3(g) (111) and (110) 59.0 59.1 (111) and (204) 45.3 45.1 (111) and (311) 79.6 79.8 Fig. 3(h) (110) and (122) 53.8 53.9 (110) and (212) 76.4 76.2 (110) and (302) 103.5 103.4
Fig. 4(a) (201) and (311) 92.1 92.1
(201) and (510) 122.0 122.1
Fig. 4(b) (201) and (401) 89.5 89.3
(111) and (134) 21.5 21.4
Table 4.3 Chemical compositions of the phases revealed by EDS. Chemical Composition (at.%)
Heat Treatment Phase Fe Mn Al Cr γ 49.07 30.20 17.05 3.68 SHT α + D03 52.07 21.80 21.55 4.58 D03 57.56 16.32 25.18 0.94 550 , 12h℃ M5C2 30.56 43.20 1.02 25.22
higher concentrations of both Cr and Mn would cause the (Cr,Mn)-rich M5C2
carbides to precipitate at a/2 < 100 > APBs. The precipitation of the (Cr,Mn)-rich M5C2 carbides would decrease the Mn concentration drastically,
thus inhibiting the precipitation of both Mn-rich κ carbides and Mn-rich β-Mn precipitates within the α grain. ( II ) The Hägg carbide was extensively observed by many workers in the bcc-type alloys [20-24]. Depending on the chemical compositions, the lattice parameters of the Hägg carbide varied in the range of a=1.150-1.158nm, b=0.452-0.457nm, c=0.501-0.509nm and β=97.6-98.3° [19-22]. However, to date, the orientation relationship between the Hägg carbide and the bcc-type (i.e. α, D03, B2) structure is very deficient. We are aware of
two articles [22, 23], in which they reported that both Fe5C2 carbide and Fe3C
carbide were formed intimately in α-iron after being heat-treated at 500-800 ℃ under a CO or/and H2 atmosphere. By using electron diffraction, the orientation
relationship between the Fe5C2 and Fe3C was determined to be (100)Fe5C2 //
(001)Fe3C [22, 23]. In addition, they correlated the obtained result with the
orientation relationship between Fe3C and α phase, (001)Fe3C // (211)α, which was
reported by other workers in ferritic stainless steel [24]. Therefore, they deduced that the orientation relationship among Fe5C2, Fe3C and α phase was (100)Fe5C2 //