Contour Detection for the Breast Tumor in Ultrasonic Images Using Watershed Segmentation
20
0
0
全文
(2) Keywords: Breast ultrasound, Texture analysis, Neural network, Watershed, and Tumor contour approximation. Assistant Professor Yu-Len Huang (contact author) Department of Computer Science and Information Engineering Tunghai University Taichung, Taiwan 407, R.O.C. Telephone: 886-4-23590121~3618 Fax: 886-4-23591567 E-mail: [email protected]. Xun-Yao Lin Department of Information Management Chaoyang University of Technology Wufeng, Taichung County, Taiwan 413, R.O.C. Telephone: 886-4-23323000~7122 Fax: 886-4-23742337 E-mail: [email protected]. -2-.
(3) I. INTRODUCTION Both medical mammographic images [1-2] and ultrasonic images [3] can be used to detect and diagnose breast tumors. Although mammography can visualize nonpalpable and minimal tumors, ultrasonography is a convenient and safe tool for diagnosing breast tumors, especially palpable tumors. Modern medical ultrasound equipment provides real-time high-resolution imaging without the use of ionizing radiation, and it is relatively inexpensive and portable. The cost effectiveness and portability of the modality is particularly important in smaller hospitals as useful equipment to complex medical imaging in a timely manner. Ultrasonic Images are basically markers for early detection of some breast cancers. Using ultrasonic images to analyze the homogeneity of the internal echo is one criteria that can assist in differentiating between benign and malignant lesions. Garra et al. [4] suggests that ultrasonic image texture analysis is a simple means of markedly reducing the number of benign lesion biopsies. Furthermore, Chen et al. proposes various computer-aided diagnosis (CAD) systems to differentiate between benign and malignant tumors [5-8] by using neural network techniques. The proposed systems diagnose breast tumors exploiting inter-pixel correlations within the manual extraction ultrasonic sub-image of the region of interest (ROI). The proposed CAD systems perform differential diagnosis very well. Experienced radiologists can identify a tumor in an ultrasound image by the tumor’s shape and by the contrast of internal echoes. A precise ultrasound image segmentation approach can make an accurate diagnosis of breast tumor. However, the digital ultrasonic image always comprises speckles, noise, and tissue-related textures, as shown in Fig. 1. In practice, tumor segmentation for a digitized ultrasonic image is a difficult task for physicians. Thus, a well functional automatic contour detection method is essential and urgent for clinical application. The traditional edge-based segmentation methods often use the gradient of the image to find. -3-.
(4) objects’boundary. These methods are not designed for detecting the discontinuity of image intensity. That is, the edge-based methods do not perform well for the ultrasonic image. The region-based segmentation methods such as split-and-merge, region growing, and watershed transformation are sensitive to the noise and contrast in image. Preprocessing procedures are proposed for improving the performance of watersheds in various approaches [9-12]. Nevertheless, the tissues in the breast ultrasonic image are excessive variety and boundary discontinuity that always create difficulties in extracting the accurate tumor’s contour. Hence, we present an adaptive texture-based preprocessing filtering in our contour detection scheme to reduce the noise, speckles, and tissue-related textures in breast ultrasonic images. Our scheme combines the advantages of neural network classification and watershed segmentation techniques to extract contour of the breast tumor from the ultrasound images. The rest of this paper is organized as follows. Section II describes the textual features extraction and classification for breast tumor. Section III reviews the main features of watershed transformation. Further, the proposed contour detection scheme for breast tumor is presented in Section IV. Section V gives the experimental results for the clinical ultrasonic images. Finally, conclusions are drawn in Section VI.. II. TEXTUAL FEATURES CLASSIFICATION An ultrasonic image consists of many points with different values of gray level intensity. Different tissues have significantly different textures. We exploited the correlation between neighboring pixels within the images as textural features to distinct the breast ultrasonic images. The normalized auto-correlation coefficients [13] can be used to reflect the inter-pixel correlation within an image. The 2-D normalized auto-correlation coefficient between pixel (i, j) and pixel (i+∆m, j+∆n) in an image with size M × N is defined as. -4-.
(5) γ (∆m, ∆n ) =. A(∆m, ∆n ) , A(0,0 ). (1). where A(∆m , ∆n ) =. M −1 −∆ m 1 ∑ ( M − ∆m )( N − ∆n ) x = 0. N −1− ∆ n. ∑ f (x, y ) f (x + ∆m, y + ∆n ).. (2). y =0. Moreover, the 2-D auto-correlation coefficients are further modified into a mean-removed version to generate the similar auto-correlation coefficients for images with different brightness but with a similar texture. The modified version is expressed as A' (∆m, ∆n ) =. M −1− ∆ m 1 ∑ ( M − ∆m)( N − ∆n) x =0. N −1− ∆n. ∑ ( f (x , y ) −. y =0. f )( f ( x + ∆m, y + ∆n ) − f ) (3). where f is the mean value of f(x, y). Previous studies have found the modified 2-D auto-correlation coefficients can be used as the inter-pixel features to distinguish the differences between breast tumors [9-10]. A self-organizing map (SOM) [14] contains an input layer, a single hidden layer, and a mapping array of output, as illustrated in Fig. 2. It refers to the ability of unsupervised learning. The number of input neurons ensures from the dimension of the input vectors. In general, the SOM model defines a mapping from the higher dimension of input data space onto a regular two-dimensional mapping array. With every neuron in the mapping array, a parametric weight vector produced by learning algorithm is associated. An input vector will compare with all weight vectors, and the best match is defined as the SOM response. For a more useful analysis, each neuron in the mapping array may also be marked a class label using training samples. During the weight modification phase of the learning algorithm, the learning rate parameter and radial of the region of weight modification could be monotonically. -5-.
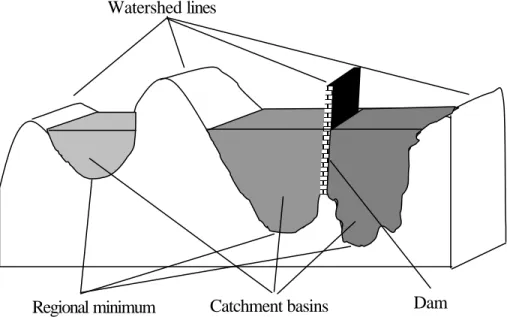
(6) decreasing over time. The SOM models perform high unsupervised learning capability and computational efficiency. The proposed contour detection scheme classifies the breast ultrasonic images by adding the final SOM mapping array.. For this work, the modified version of the 2-D normalized auto-correlation coefficients and the variance value of image are used as the input vector in the SOM model. The dimension of the matrix can be fixed for any size of image. At first the auto-correlation matrix is calculated as the texture features from an ultrasonic image. Take note of that th e value of ?(0, 0) is always 1 for a normalized auto-correlation matrix. Thus, except for the element ?(0, 0), other auto-correlation coefficients and the variance value of the image are formed as the feature vector. Afterward the SOM model is used to decide the texture class of breast ultrasound image. For each texture class in the SOM model, a special designed noise reduction filter si adopted for preprocessing filtering of the ultrasonic image. The proposed preprocessing scheme can reduce the ineffectual speckles, noise, and tissue-related textures in ultrasonic images and preserve the shape and contrast of tumor.. III. WATERSHED TRANSFORMATION One of the most reliable automatic and unsupervised segmentation is the watershed transformation [15-16]. This segmentation method has been applied successfully to solve some difficult and diverse image segmentation problem. Identically, the breast ultrasonic images are considered as the 3D topographic surfaces in this paper. The intensity of a pixel in the image denotes the elevation in the corresponding location. The objective of watershed transformation is to find the watershed lines in a topographic surface. Figure 3 illustrates the watershed transformation to be performed on a topographic surface of an ultrasonic image. Suppose that each regional minimum of the surface has. -6-.
(7) holes. And then the topography is flooded from the bottom and rise through the holes. In the meanwhile, dams are built to prevent the merging of two adjacent minima. Finally, each regional minimum is surrounded by dams. These dam boundaries correspond to the divide lines of the watersheds. In general, the watershed algorithm always can extract the continuous boundaries in an image. However, the watershed transformation may produce over-segmentation. That is due to noise and irregular textures in an image. As shown in Fig. 4, over-segmentation can be serious enough to render the ineffectual result. Many approaches have been proposed to solve this problem [17-20]. One of the famous methods for controlling over-segmentation is based on the concept of markers. A marker is defined as a connected component in image. The marker typically select by a set of criteria from the preprocessed image. In [20], the detection algorithm of similarity-based watershed boundaries is achieved from the markers. From the experiences, the proposed watershed segmentation algorithm suits for the ultrasound applications. Hence, the similarity-based watershed algorithm is performed in this work to control over-segmentation. The implementations of the SOM preprocessing scheme and the watershed segmentation are detail described in Section IV.. IV. CONTOUR DETECTION FOR BREAST TUMOR In the proposed contour detection scheme, the modified auto-correlation coefficients are first computed from the ultrasound image. The textural coefficients and the variance value of the image are obtained as a 25-D feature vector. The SOM model utilized the feature vector to decide the texture class of the ultrasonic image. The SOM learning algorithm is a type of unsupervised, iterative vector quantization that converts complex, nonlinear statistical data items from a high-dimensional space onto simple reference vectors in a low-dimensional space. Whole algorithm is considered similarly to the -7-.
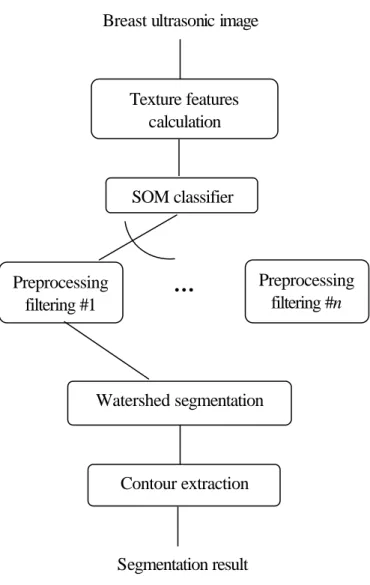
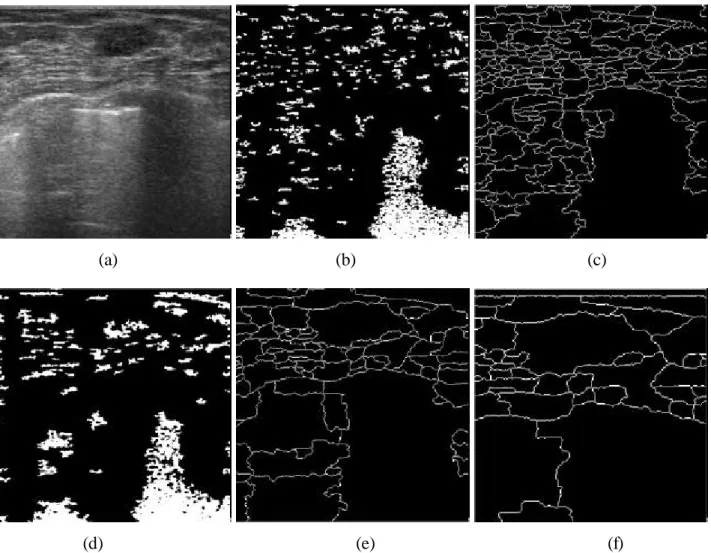
(8) function of mapping in the brain of higher biological organisms.The on-line implementation of the learning algorithm is reiteratively executed from the training vectors and then products the synaptic weight vectors which used for SOM model. Figure 5 illustrates the structural diagram of the proposed contour detection scheme. The preprocessing filtering procedures are special designed for the breast tumors in the ultrasonic images. We examined various preprocessing filters that suit for reduce speckles, noise, and tissue-related textures in the breast ultrasound image. For each texture class in the SOM model, we predefined an effective filter in keeping out the useless information in the ultrasound images. After achieving the preprocessing filtering into the original ultrasound image, the similarity-based watershed segmentation algorithm is used to detect the boundaries of the breast tumors in the proposed contour detection scheme. Note that the preprocessed images adopted for producing the markers and the watershed flooding procedure may create by the dissimilar preprocessing filters. This work can improve the performance to generate the more efficient markers for the watershed flooding procedure. The watershed segmentation always products a poor contour for the breast tumor if the selected marker is not efficient enough. For example, Fig. 6(a) is an original breast ultrasound image with a benign tumor. Figure 6(b) is the markers’ image that generated without preprocessing filtering. We perform the similarity-based watershed detection from the markers. As shown in Fig. 6(c), the result of the detected boundaries is still over-segmentation. In this paper, a 2-D minimum mean square error filter – Wiener method [13] is utilized as the primary preprocessing filter to reduce ineffectual noises and then to obtain the more precise markers. The Wiener method is a pixel-wise adaptive low-pass filtering that based on statistics estimated from a local neighborhood of each pixel. The markers that generated by using the 3 × 3 Wiener filter is shown in Fig. 6(d). It’s effortless to observe that the. -8-.
(9) markers in Fig. 6(d) are more efficient than the markers in Fig. 6(b). In practice, the watershed algorithm always fulfills better segmentation results from the accurate markers. Fig. 6(e) and Fig. 6(f) are the watersheds for the ultrasonic image through with 5 × 5 and 3 × 3 Wiener filtering, respectively. Both of these two segmentations for the breast tumor are more efficient than Fig. 6(c). Moreover, Fig. 6(e) is quite similar to the manual sketch contour of the breast tumor in comparison with Fig. 6(f). From the results, the texture-based SOM preprocessing scheme is adopted in this paper. We found the proposed scheme can automatic generate the accurate contour for the breast tumor in an ultrasound image.. V. SIMULATIONS AND RESULTS In this paper, the breast ultrasound image database contained 60 ultrasonic images of pathologically proven breast tumors. The database contained only one sonography from each patient and the tumor size is larger then 1 cm in diameter for all cases. The images were recorded from January 1, 1997 to May 31, 1998; the patients' ages ranged from 18 to 62 years. All of the ultrasonic images were performed using an ALOKA SSD 1200 (Tokyo, Japan) scanner and a 7.5 MHz lineal real-time transducer with freeze-frame capability. No acoustic standoff pad was used. The sonographic examination was carried out by setting remained unchanged throughout the entire period of study, except for changes made to obtain the best view. Then, when a sonogram is performed, an analog video signal is transmitted from the VCR output of the scanner to the image acquisition computer; the data is then digitized by a frame grabber Video CATcher (from the Top Solution Technology Co.). The capturing resolutions the external frame grabber are 736 × 566 pixels for an NTSC video screen picture. The study used the Prolab’s ProImage software package to capture the real-time digital sonography. The monochrome ultrasonic image is quantized into 8 bits (i.e. 256 gray levels). The. -9-.
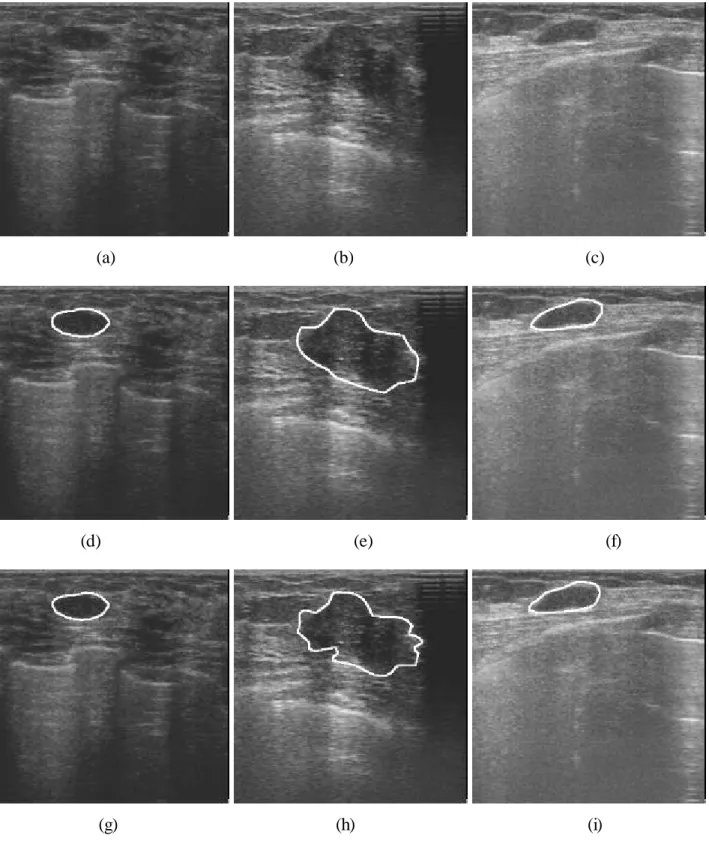
(10) contour of tumor is manually selected and then saved as a file for later comparison with the proposed scheme. In the simulations, we use an SOM neural network as nonlinear texture classifier. The SOM with the size of mapping array was 3 ×3 neurons. The SOM output is used to decide the texture class for an ultrasound image. The 40 ultrasound images are used to train the SOM model and the remaining 20 images are used to evaluate the performance of the proposed contour detection scheme. Table 1 shows the pre-processing filters that are special designed for the breast ultrasonic images in the training set. In our experiments, the Wiener filters are efficacious for remove the speckles, noise, and tissue-related textures in ultrasound images. To evaluate the proposed method's performance numerically, the precision ratio (PR) and the match rate (MR) between the manual contour and the automatic detected contour have been calculated. The PR is defined as. PR = (. N diff ) ×100% , NM. (4). where Ndiff is the number of the discrepancy pixel between the manual contour and the automatic detected contour, and NM is the number of the pixel in the manual contour. The MR is defined by. MR = (1 -. Area M − Area W Area M. ) ×100%. (5). where AreaM and AreaW denote the area covered by the contour of the manual sketch and produced by the proposed scheme, respectively. Table 2 shows the pathology-proven result, size of breast tumor, SOM texture class, PR, and MR for the 20 ultrasound images that are outside the training set. the original magnified monochrome breast ultrasound images no. 7, no. 14, and no. 19 are shown in Fig. 7(a), Fig. 7(b), and Fig. 7(c), - 10 -.
(11) respectively. Fig. 7(d), Fig. 7(e), and Fig. 7(f) illustrate the manual sketch contours from the corresponding ultrasound image. Fig. 7(g), Fig. 7(h), and Fig. 7(i) show the contours produced by the proposed scheme. Obviously, our proposed scheme obtains the similar contour with the manual sketch of the breast tumor in the ultrasonic images.. VI. CONCLUSIONS In this paper, we have proposed a novel contour detection scheme for the tumors in the breast ultrasonic image. The proposed scheme combines the advantages of neural networks and watershed segmentation. The texture-based preprocessing in the proposed method adopts an SOM model to classify the input images. The unsupervised learning algorithm is performed to construct the synaptic weights for the SOM classifier. Furthermore, the preprocessing methods are special designed for each texture class. And then the contour of tumor will be produced by using the similarity-based watershed algorithm. This work can keep away from over-segmentation and further improve the performance of the watershed segmentation. In comparison with the manual sketch contour, the proposed scheme can obtain the very similar contour of the breast tumor in the ultrasound images. From the experimental results, we find that the proposed scheme is superior to detect the tumor’s contour from the breast ultrasonic image. Besides, the area information of the tumor can be used to trace the variant state in clinical diagnosis.In the future work, the proposed scheme could be utilized to find the initial shape of tumor; moreover, some contour approximation algorithms such as the active contour model (snake) may be used to perform the more precise tumor contour.. - 11 -.
(12) REFERENCES [1] N. Petrick, H. P. Chan, B. Sahiner, and D. Wei, “An adaptive density-weighted contrast enhancement filter for mammographic breast mass detection,” IEEE Transactions on Medical Imaging, vol . 15, pp. 59-67, 1996. [2] A. P. Dhawan, Y. Chitre, C. Kaiser-Bonasso, and M. Moskowitz, “Analysis of mammographic microcalcifications using gray-level image structure features,” IEEE Transactions on Medical Imaging, vol. 15, pp. 246-259, 1996. [3] P. M. Shankar, J. M. Reid, H. Ortega, C. W. Piccoli, and B. B. Goldberg, “Use of non-rayleigh statistics for identification of tumors in ultrasonic B-scans of the breast,” IEEE Transactions on Medical Imaging, vol. 12, pp. 687-692, 1993. [4] B. S. Garra, B. H. Krasner, S. C. Horii, S. Ascher, S. K. Muk, and R. K. Zeman, “Improving the distinction between benign and malignant breast lesions: The value of sonographic texture analysis,” Journal of Ultrasound Medicine, vol. 13, no. 4, pp. 267-285, 1993. [5] D. R. Chen, R. F. Chang, and Y. L. Huang, "Computer-aided Diagnosis Applied to US of Solid Breast Nodules by Using Neural Networks", Radiology, vol. 213, no. 2, pp.407-412, 1999. [6] D. R. Chen, R. F. Chang, and Y. L. Huang, "Breast Cancer Diagnosis Using Self-Organizing Map for Sonography", Ultrasound in Medicine and Biology, vol. 26, no. 3, pp. 405-411, Mar. 2000. [7] R. F. Chang RF, W. J. Kuo, D. R. Chen, Y. L. Huang, J. H. Lee, and Y. H. Chou, "Computer-Aided Diagnosis for Surgical Office-Based Breast Ultrasound", Archives of Surgery, vol. 135, pp.696-699, June 2000. [8] D. R. Chen, R. F. Chang, Y. L. Huang, Y. H. Chou, C. M. Tiu, and P. P. Tsa, "Texture Analysis of Breast Tumors on Sonograms", Seminars in Ultrasound, CT and MRI, vol. 21, no. 4, pp. 308-316, Mar. 2000. [9] P. R. Detmer, G. Bashein, and R. W. Martin, "Matched filter identification of left-ventricular endocardial borders in transesophageal echocardiograms," IEEE Transactions on Medical Imaging, vol. 9, no. 4, pp. 396-404, Dec. 1990. - 12 -.
(13) [10] C. Y. Han, K. N. Lin, W. G. Wee, R. M. Mintz, and D. T. Porembka, "Knowledge-based Image Analysis for Automated Boundary Extraction of Transesophageal Echocardiographic LeftVentricular Images," IEEE Transactions on Medical Imaging, vol. 10, no. 4, pp. 602-610, Dec. 1991. [11] M. Choy and J. Jin, “Morphological image analysis of leftventricular endocardial borders in 2d echocardiograms”, in Proceedings of SPIE-Medical Imaging, vol. 2710, 1996. [12] N. Richard, and R. N. Czerwinski, "Detection of lines and boundaries in speckle imagesapplication to medical ultrasound," IEEE Transactions on Medical Imaging, vol. 18, no. 2, pp. 126-136, Feb. 1999. [13] R. C. Gonzalez and R. E. Woods, Digital image processing 2nd Ed., Reading, Massachusetts, Addison Wesley, pp.414-417. 2002 [14] T. Kohonen, Self-Organization and Associative Memory 2nd Ed., New York: Springer-Verlag, 1988. [15] L. Vincent and P. Soille, “Watersheds in digital spaces: an efficient algorithm based on immersion simulations,” IEEE Trans. Pattern Anal. Machine Intell., vol. 13, no. 6, pp. 583–598, June 1991. [16] L. Najman and M. Schmitt, “Geodesic saliency of watershed contours and hierarchical segmentation,” IEEE Trans. Pattern Anal. Machine Intell., vol. 18, no. 12, pp. 1163–1173, 1996. [17] S. Beucher and F. Meyer, “The morphological approach to segmentation: the watershed transformation,” in E. R. Dougherty, editors, Mathematical Morphology in Image Processing, chapter 12, pp. 433-481. Marcel Dekker, New York, 1993. [18] K. Haris and S.N. Efstratiadis, “Hybrid image segmentation using watersheds and fast region merging” IEEE Trans. Image Processing, vol. 7, no. 12, pp. 1684-1699, Dec. 1998. [19] A. Bleau and L. J. Leon, “Watershed-based segmentation and region merging,” Computer Vision and Image Understanding, vol. 77, no. 3, pp.317-370, 2000.. - 13 -.
(14) [20] R. Lotufo and A. Falcao, “The ordered queue and the optimality of the watershed approaches,” in J. Goutsias and L. Vincent and D. Bloomberg, editors, Mathematical Morphology and its Application to Image and Signal Processing, pp. 341-350. Kluwer Academic Publishers, Dordrecht, 2000.. - 14 -.
(15) Fig. 1. A 736 × 556 digital image is captured from the sonographic scanner. Note that there are 58 × 58 = 3364 pixels in a 1cm × 1cm rectangle.. Input vector. … …. SOM weights. SOM mapping array. Fig. 2. Structural graph of the SOM neural network used in this work.. - 15 -.
(16) Watershed lines. Regional minimum. Catchment basins. Dam. Fig. 3. Topographic view of watershed tranformation.. Fig. 4. Illustration of over-segmentation: (a) a breast ultrasound image and (b) result of applying the watershed algorithm in [15].. - 16 -.
(17) Breast ultrasonic image. Texture features calculation. SOM classifier. Preprocessing filtering #1. …. Preprocessing filtering #n. Watershed segmentation. Contour extraction. Segmentation result. Fig. 5. The structural diagram of the proposed contour detection scheme.. - 17 -.
(18) (a). (d). (b). (e). (c). (f). Fig. 6. Watershed segmentation with the distinct preprocessing: (a) the original ultrasound image, (b) the markers generated without preprocessing, (c) watersheds generated without preprocessing, (d) the marker generated by the ultrasound image through with 3 × 3 Wiener filtering, (e) watersheds generated by the preprocessed image (using 5 × 5 Wiener filter) and the marker (d), and (f) watersheds generated by the preprocessed image (using 3 × 3 Wiener filter) and the marker (d).. - 18 -.
(19) (a). (d). (g) Fig. 7.. (b). (c). (e). (h). (f). (i). Results of the automatic tumor’s contour segmentation (white lines).. - 19 -.
(20) TABLE 1 The preprocessing filtering that special designed for the ultrasonic images outside the training set. SOM texture class 1 2 3 4 5 6 7 8 9. Preprocessing filters used to create markers Filters Mask size Wiener 3×3 none none Wiener 3×3 Wiener 3×3 Wiener 5×5 Wiener 5×5 none none -. Preprocessing filters used to create watersheds Filters Mask size Wiener 5×5 none none none Wiener 5×5 Wiener 5×5 Wiener 3×3 none none -. TABLE 2 The pathology-proven result, size of breast tumor, SOM class, PR, and MR for the 20 breast ultrasonic images outside the training set. Ultrasound image no. 1 2 3 4 5 6 7 8 9 10 11 12 13 14 15 16 17 18 19 20. Benign/ Malignant M M M M M M M M M M M M M M B B B B B B. Tumor size (cm) width height 1.89 1.06 2.56 1.25 1.61 1.04 1.18 0.90 0.64 0.46 1.46 0.58 1.46 1.28 1.66 1.35 2.33 2.54 2.06 1.02 1.94 1.06 1.01 0.92 2.33 1.80 1.54 1.27 1.35 0.63 0.90 0.42 1.32 0.56 1.52 0.78 1.52 0.59 1.90 0.83. Average - 20 -. SOM class 1 3 7 4 8 6 8 9 6 1 1 3 4 4 2 6 6 2 5 1. PR. MR. 86.00 84.77 85.20 82.24 74.33 87.23 78.25 74.90 80.69 87.72 86.26 86.13 91.40 81.91 71.70 80.71 82.81 84.34 82.43 88.80. 99.44 98.98 96.97 97.17 98.25 93.89 95.49 84.14 85.64 93.66 91.39 95.81 99.36 97.54 83.11 99.43 95.84 97.37 97.05 98.74. 82.89. 94.96.
(21)
數據
+2
相關文件
Robinson Crusoe is an Englishman from the 1) t_______ of York in the seventeenth century, the youngest son of a merchant of German origin. This trip is financially successful,
fostering independent application of reading strategies Strategy 7: Provide opportunities for students to track, reflect on, and share their learning progress (destination). •
In this chapter we develop the Lanczos method, a technique that is applicable to large sparse, symmetric eigenproblems.. The method involves tridiagonalizing the given
volume suppressed mass: (TeV) 2 /M P ∼ 10 −4 eV → mm range can be experimentally tested for any number of extra dimensions - Light U(1) gauge bosons: no derivative couplings. =>
Courtesy: Ned Wright’s Cosmology Page Burles, Nolette & Turner, 1999?. Total Mass Density
• Formation of massive primordial stars as origin of objects in the early universe. • Supernova explosions might be visible to the most
Like the proximal point algorithm using D-function [5, 8], we under some mild assumptions es- tablish the global convergence of the algorithm expressed in terms of function values,
The difference resulted from the co- existence of two kinds of words in Buddhist scriptures a foreign words in which di- syllabic words are dominant, and most of them are the
