11
Operating reserve and reliability analysis of
the
Taiwan power system
Prof. Y.-Y. Hsu, PhDY.-S. Lee J.-D. Jien C.C. Liang K.-K. Chen T . 4 . Lai T.-E. Lee
Indexing terms: Power system protection
Abstract: A probabilistic approach to examining the effect of operating reserve on the reliability and security of the Taiwan power system is devel- oped. To evaluate the probability of failure to carry load in system operation, an extension of the original PJM (Pennsylvania-New Jersey- Maryland) method is presented. System security is analysed using the reliable emergency output power (REOP) index. The proposed methods are applied to evaluate the reliability and security of the Taiwan power system using the operating records of the past five years. 3 2 load patterns are examined for each year to cover the different seasons of the year, the different days of the week and the peak and off-peak periods of the day. The factors affecting system reliability and security such as the amount and type of spinning reserves and the availability of rapid-start units are exten- sively examined. It is found that the presented probabilistic approach can provide valuable infor- mation which can assist the system operators to reach a secure and reliable, as well as economical, unit commitment strategy.
1 Introduction
Unit commitment has an important function in a modern energy management system aiming to reach an eco- nomical and reliable generation schedule which meets the load demand. Current practice in the commitment of generating units is to minimise the total cost during the study period (typically between one day and one week) subject to certain constraints on operating reserve requirements [l-31.
Most of the works on unit commitment [4-71 employ some deterministic criteria for the operating reserve requirements. For example, a criterion which is widely employed by the utilities is to keep the spinning reserve of the system greater than the capacity of the largest unit. Paper 7318C (P9, Pll), received 27th October 1989
Prof. Hsu, Y.-S. Lee and J.-D. Jien are with the Department of Electri- cal Engineering, College of Engineering, National Taiwan University, Taipei, Taiwan. Republic of China
C.C. Liang, T.-S. Lai, K.-K. Chen and T.-E. Lee are with the System Operation Department, Taiwan Power Company, Taipei, Taiwan, Republic of China
IEE PROCEEDINGS, Vol. 137, Pt. C , N o . 5 , SEPTEMBER 1990
With such a policy, the system load can be met if any single unit is lost and in a sense the system seems to be secure and reliable. However, this is of a purely qualitat- ive nature from the viewpoint of system reliability and security. Probabilistic approaches which can provide quantitative measurements of system reliability and security are required because generating units are suscep- tible to unpredictable, random outages [8-lo].
This paper presents a probabilistic approach to inves- tigate the relationship between the amount and distribu- tion of operating reserve and system reliability and security. The relationship, once established, can provide information valuable to system operators reaching a reli- able as well as economical commitment schedule. Two indices, the estended probability of just carrying or just failing to carry load L(P&(T)) [11-131 and the reliable
emergency output power (REOP) [14], are proposed for the evaluation of system reliability and security, respec- tively. To demonstrate the usefulness of the proposed method, the operating records of the Taiwan power system for the past five years are studied. A total of 32 different load patterns covering differing seasons of the year, different days of the week, and the peak and off- peak periods of the day are considered for each year. Both the amount and distribution of spinning reserves and rapid start units and the reliability and security indices are computed for each of these load patterns.
The main contributions of this paper are summarised as follows :
(i) A probabilistic approach using the P&(T) index
and REOP index is developed for the reliability analysis of the Taiwan power system.
(ii) Records of five years of operation of the Taiwan power system are extensively studied to observe the effect of factors such as the amount and distribution of spin- ning reserves and the amount of hydro reserves on system reliability and security.
(iii) The relationship between system security and total fuel cost is examined.
(iv) It is found that, because of the geographical dis- tribution of the generating units in Taiwan, area power balance can only be reached at the expense of higher fuel cost and poorer security.
2
The system under study is the Taiwan power system. The generating stations and the 345 kV and 161 kV transmis- sion lines are shown in Fig. 1.
349
During the five-year study period (1983-1987) many new units were put in operation to meet the increasing load demand and some aged units were pulled out of the
pumped-storage units (plant 511), are concentrated in the central area of the island while most thermal and nuclear units are located in the north and south. The complex Table 1 : Generating unit data
~~
Type Unit Max. Number FOR Failure Repair Lead Pick up output of unit rate rate time rate
( MW) (per year) (per year) (min) (MW/min) North: nuclear nuclear nuclear nuclear coal coal coal coal oil oil oil oil hydro hydro ROR ROR ROR ROR ROR gas diesel Centre: hydro hydro hydro hydro hydro hydro hydro hydro hydro hydro hydro gas South: nuclear nuclear coal coal coal coal coal coal coal coal coal oil oil oil hydro gas gas 601 602 61 1 61 2 303 304 305 31 7 323 324 329 330 401 404 104 105 201 202 21 2 705 31 6 01 1 002 003 101 102 103 1 06 107 108 109 51 1 707 709 621 622 307 308 31 3 31 4 31 5 331 332 333 334 31 8 31 9 320 403 71 3 600.0 600.0 940.0 940.0 75.0 125.0 185.0 31 0.0 480.0 480.0 480.0 480.0 45.0 40.0 22.5 13.0 18.0 56.6 21 .o 71.2 6.0 22.0 21.8 20.7 15.3 45.0 22.5 16.0 48.6 90.0 78.0 250.0 14.2 31 5.0 920.0 920.0 40.0 125.0 280.0 280.0 280.0 480.0 480.0 530.0 530.0 350.0 350.0 480.0 50.0 61.9 1 1 1 1 1 1 1 1 1 1 1 1 2 1 1 1 1 1 1 4 8 5 2 1 1 4 4 2 2 4 3 4 8 3 1 1 2 1 1 1 1 1 1 1 1 1 1 1 1 4 0.027550 0.01 2330 0.0491 40 0.0091 70 0.01 3440 0.01 9780 0.086060 0.022390 0.091 850 0.00751 0 0.006830 0.048760 0.000151 0.006925 0.001 464 0.001 464 0.001 464 0.001 464 0.001 464 0.039055 0.039055 0.002559 0.001 930 0.000245 0.000245 0.000121 0.002549 0.001 71 1 0.001 502 0.003431 0.000343 0.01 8829 0.039055 0.039055 0.0731 00 0.1 04000 0.01 6250 0.01 1540 0.079420 0.049650 0.072720 0.041 880 0.076200 0.041 OOO 0.053026 0.020480 0.001 830 0.020500 0.0 0.039055 8.308 4.847 5.286 3.221 1.874 2.536 5.01 7 2.427 4.495 4.1 30 1.71 1 4.070 3.113 1.926 1.254 1.254 1.254 1.254 1.254 4.765 4.765 2.422 0.31 6 0.448 0.448 0.303 2.321 0.363 1.195 0.848 1.040 2.657 4.765 4.765 24.380 14.960 1.386 1.499 6.365 5.842 4.991 1 1.450 9.098 11.590 10.71 3 1.734 1.584 3.562 0.0 4.765 293.25 388.25 102.28 348.03 137.56 125.67 53.27 105.96 44.44 545.80 248.80 79.40 2489.84 276.1 6 855.30 855.30 855.30 855.30 855.30 1 17.23 11 7.23 943.88 163.59 1825.88 1826.29 2496.60 908.24 21 1.41 794.45 246.33 3051.31 138.45 11 7.23 11 7.23 309.1 3 128.88 83.90 128.39 73.77 11 1.82 63.64 261.95 1 10.29 271.09 191.31 82.93 863.98 170.1 9 0.0 117.23 - 6.3 - 6.3 - 9.8 - 9.8 270 0.7 270 1.2 270 2.0 275 3.5 300 5.0 300 5.0 300 5.0 300 5.0 7 15.0 7 15.0 - -- -- -- -- -40 10.2 10 0.3 7 4.0 7 16.0 7 10.0 7 10.0 7 15.0 7 7.0 7 5.0 7 15.0 7 30.0 7 21.0 7 55.0 30 2.0 30 7.0 9.5 - 9.5 300 0.4 395 1.2 260 3.0 260 3.0 260 3.0 690 5.0 690 5.0 690 5.5 690 5.5 260 3.7 260 3.7 260 5.0 7 15.0 30 5.2 -
system. Table 1 lists the maximum output powers, failure rates, repair rates, lead times, and pickup rates of the gen- erating units in the system during the study period. There are six nuclear units, 14 coal-fired units, seven oil-fired units, five run-of-river hydro units, 36 non-run-of-river hydro units and 27 gas and diesel units in the system. Of these 95 units, the six large nuclear units are not allowed to perform load-following due to safety reasons. They are therefore excluded from the set of operating reserves. Run-of-river hydro units do not qualify for reserve units either, owing to the limitation on water availability. The
36 non-run-of-river hydro units, including four large
350
generation mix means the problem of unit commitment and spinning reserve determination is quite complicated; especially when area power balance is to be maintained considering area security and transmission loss.
Since continuous load change is experienced by the system, 32 load patterns, as described in Table 2, are con- sidered for each year. This enables the various loading conditions to be covered as far as possible.
The output power of each unit under each load pattern is gathered and compiled for the past five years. The unit output power for each of these load patterns can be found in References 15 and 16.
1EE PROCEEDINGS, Vol. 137, Pt. C, No. 5, S E P T E M B E R 1990
3
To evaluate system reliability using the probabilistic approach, the conventional PJM method is introduced. An extended PJM method is then developed to make the index more practical.
Reliability evaluation using the extended PJM ( Pennsylvania-New Jersey-Maryland) method
-#601 #602
CENTRE
---
SOUTH
#621,&622
Fig. 1 Taiwan power system
t nuclear A thermal 0 EHVstation 0 primary station hydro - 3 4 5 k V - 161 kV
3.1 The original PJM method
In the original PJM method, the probability that the gen- eration just satisfies or fails to satisfy the system load [ll-131 is evaluated, i.e.
PcL(T) = PrCC(T)
<
L] (1)where C(T) is the available capacity at time T and L is the load demand. The PcL(T) as expressed in eqn. 1 can be computed by summing the risk areas A , , A,,
...,
A,, +,, ,, under the risk curvef(t) in Fig. 2 [ 141, i.e.
Table 2 : Load petterns
Item Number of Description Season of the year 4 spring (April),
alternatives
summer (July), autumn (October), winter (January) Day of the week 4 Monday, Tuesday,
Wednesday, Thursday, Friday, Saturday, Sunday off-peak period Hour of the day 2 peak period, * The number of load patterns in a year = 4 x 4 x 2 = 32
IEE PROCEEDINGS, Vol. 137, P t . C , No. 5 , S E P T E M B E R 1990
where nR is the number of rapid start units (including hydro and gas turbine units) and nH is the number of hot reserve units (thermal units). The lead times
(Ti,
i = 1,. . .
, nR+
nH) of rapid-start and hot reserve units can be found in Table 1. Each unit has its own lead time.The risks R T i - (i = 1,
...,
nR+
n,,+
1) and, R T i +(i = 1,
.
. .
, nR+
nH) are those before and after unit i (with lead time Q is committed. TRi (i = 1,. .
.
,
nR) is the lead time of ith rapid start unit, and THi is that of ith hot reserve unit. Details of the computation of the risks R T i -and R T i + are given in Reference 14. It is assumed that the
online units have their maximum capacity available at the outset of the study period (t = 0) and the rapid start units and hot reserve units can give output powers, which are equal to their maximum capacities, immediately after the lead times. The pickup rate constraints of all units are therefore neglected, causing the discontinuities in the curve of Fig. 2 at the instant of lead times for these units. In reality, the output power of any generating unit is limited by its pickup rate. Since we are concerned about the system’s capability to increase its output power in order to carry load in a certain period T , it is desirable to extend the original PJM method to account for the unit pickup rates. The resulting reliability index from the extended PJM method will be denoted by P&( T).
3.2 The extended PJM method
In the extended PJM method, which takes the pickup rate of each unit into account, the risk curve must be replaced by the continuous solid curve as shown in Fig. 3.
‘“’I
Toi Ti TFi t
Fig. 3 Modified risk curve original risk curve
_ _ _ _
__ modified risk C U N e
is the lead time of unit i as described in the preced- ing Section and
T i
andTFi
are the times required to put unit i on-line and to have unit i in the state of ratedoutput, respectively. The output power of a generating unit i as a function of time, C i t ) , can thus be expressed as
O < t < T , ,
C i t ) =
{::,
CO+
Puht -Ti)
Ti
<
t < TFi (3) t 2 TFiwhere CO is the output power of unit i at t = 0, (CO = 0 for rapid-start and hot reserve units), C,, is the maximum output power of unit i, Pui is the pickup rate
of unit i (a constant pickup rate is assumed), and
Ti
= 0 for on-line units.After the C i t ) of each unit has been established, the
r&(T) index is computed in the same way as the P,(T)
in the original PJM method. The only difference is that, in building the outage probability table for each instant, the actual C i t ) at that time instead of the rated capacity of that unit is used. It is certain that the P&(T) can reveal system risk better than the original P,,(T) because
it uses the actual output power of each unit at any time.
3.3 PCL ( T ) and PEL (T ) indices for Taiwan power system
3.3.1 P,, ( T ) Index: Using the method described above, the P,,(T) index for each of the 32 load patterns of each
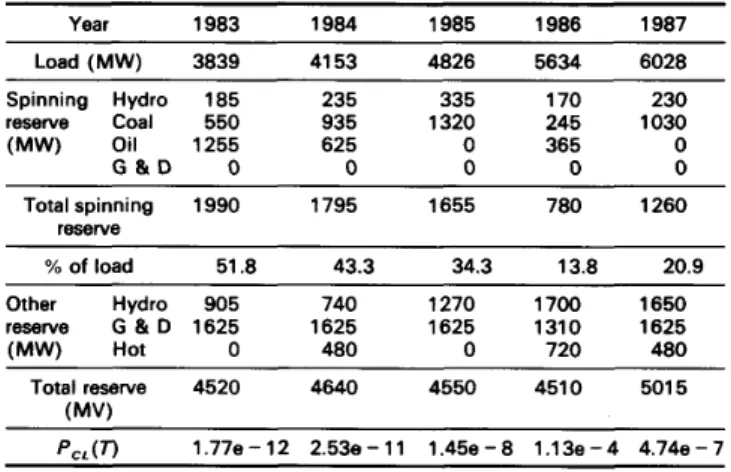
year is computed for the Taiwan power system. In the present study, a time period of 300 minutes is employed for T because the lead times for online units, rapid-start units, and hot reserve units, are Omin, 7 to a m i n , and 260 to 290 min, respectively. Table 3 gives the amount of reserves and the P,,(T) index for one of these load pat- terns (off-peak period, Saturday, spring).
Fig. 4 shows the PcL( T) index as a function of spinning reserves. The P,,(T) indices as functions of the sum of spinning reserves and hydro unit reserves, and total reserves are also studied [l5, 161. These are not depicted owing to limited space.
From the results in Fig. 4, the following observations with regard to P,,(T) can be made:
(i) The P,,(T) index decreases with increasing amount of spinning reserve. In other words, system reliability will be improved by putting more spinning reserve in the system.
Thus, the probability of failing to carry load is less than 1/1OOO.
3.3.2 PEL(T) Index: The P&(T) index is especially useful when considering the ability of the system to carry load
(ii) In most cases, P,,(T) is smaller than
over a short period because the pickup rate of any unit is taken into account in the computation of this index. The
P&(T) indices of the Taiwan power system under two
different loading conditions, peak and off-peak periods, are computed. 8 s e e o s 0 0 0 0 0 n o n 0 0 20 40 60 80 100
spinning reserve (% of load)
P,,(T) as afunction of spinning reserve (T = 6 hrs) Fig. 4
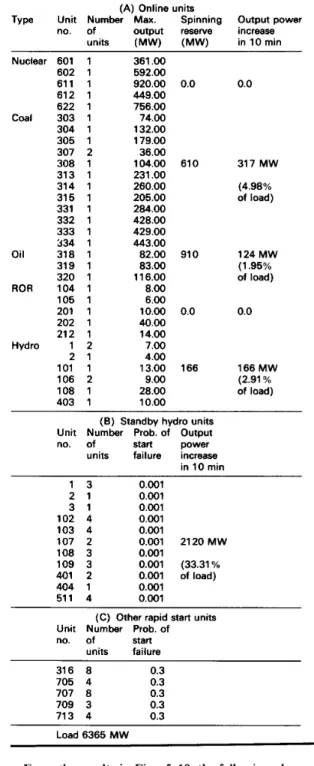
Table 4 and Table 5 list the generator data for the two loading conditions. The P&(T) index as a function of time T is plotted in Fig. 5. Notice that the P&(T) indices are very small for T > 10 minutes. We shall therefore mainly consider the variation of the P&(T) index in the first ten min.
r 2 0 2 4 6 8 10 T,min Fig. 5 0 off-peakperiod x peakperiod
P&(T) index of Taiwan power system
It can be observed from Fig. 5 that the P&(T) index for the peak period decreases at a much faster rate than that for the off-peak period during the first 2 min. The Table 3: Operating reserve and P,,(T) index (off-peak period, Satur-
day, spring) Year 1983 1984 1985 1986 1987 Load (MW) 3839 41 53 4826 5634 6028 Spinning Hydro 185 235 335 170 230 reserve Coal 550 935 1320 245 1030 (MW) Oil 1255 625 0 365 0 G & D 0 0 0 0 0 Total spinning 1990 1795 1655 780 1260 reserve % of load 51.8 43.3 34.3 13.8 20.9 Other Hydro 905 740 1270 1700 1650 reserve G & D 1625 1625 1625 1310 1625 (MW) Hot 0 480 0 720 480 ~ ________ ~~ Total reserve 4520 4640 4550 4510 5015 I M W P,'(T) 1.7713-12 2.53e-11 1.4513-8 1.13~3-4 4.7413-7
situation then reverses and eventually the index for the off-peak period becomes smaller than that for the peak time. To examine the factors that bring about the changes in P&(T) indices, the output power within the 10 min period from all operating reserves, from coal-fired online units, from oil-fired online units, from online hydro units, and from standby hydro units are shown in Figs. 6, 7, 8, 9, and 10, respectively. It is assumed that standby hydro units can be put on line in 2 min and can Table 4: Generator data for peak period
(A) Online units
Type Unit Number Maximum Spinning Output power no. of output reserve increase
units (MW) (MW) in 10 min Nuclear 601 1 602 1 611 1 612 1 622 1 Coal 303 1 304 1 305 1 307 2 308 1 313 1 314 1 315 1 331 1 332 1 333 1 334 1 Oil 318 1 319 1 320 1 323 1 324 1 329 1 ROR 104 1 105 1 201 1 202 1 212 1 Hydro 1 2 2 1 3 1 101 1 102 4 103 4 106 2 107 2 108 1 401 2 403 1 404 1 511 4 370.00 590.00 91 8.00 891 .00 744.00 74.00 132.00 187.00 37.50 104.00 279.00 276.00 208.00 276.00 432.00 524.00 528.00 256.00 266.00 360.00 21 2.00 300.00 300.00 8.00 5.00 10.00 40.00 23.00 6.00 1 .00 20.00 12.00 24.50 22.75 15.00 35.00 22.00 17.00 49.00 38.00 11 9.50 0.0 0.0 350 159 M W (1.7% of load) 930 274 M W (2.93% of load)
reach their maximum capacities in 6 min. The gas-turbine units and hot reserve units are excluded from the present study since their lead times are greater than 10 min. Table 5: Generator data for off-peak period
(E) Standby hydro units Unit Number Prob. of Output no. of start power
units failure increase in 10 min
(E) Standby hydro units Unit Number Prob. of Output no. of start power
units failure increase in 10 min
(A) Online units
Type Unit Number Max. Spinning Output power no. of output reserve increase
units (MW) (MW) in 10 min Nuclear 601 1 602 1 611 1 612 1 622 1 Coal 303 1 304 1 305 1 307 2 308 1 313 1 314 1 315 1 331 1 332 1 333 1 334 1 Oil 318 1 319 1 320 1 ROR 104 1 105 1 201 1 202 1 212 1 Hydro 1 2 2 1 101 1 106 2 108 1 403 1 361 .00 592.00 920.00 0.0 449.00 756.00 74.00 132.00 179.00 36.00 104.00 610 231 .OO 260.00 205.00 284.00 428.00 429.00 443.00 82.00 910 83.00 11 6.00 8.00 6.00 10.00 0.0 40.00 14.00 7.00 4.00 13.00 166 9.00 28.00 10.00 0.0 317 M W (4.98% of load) 124 M W (1.95% of load) 0.0 166 M W of load) (2.91 Yo 81 6 816 M W (8.73% Of load) 1 3 0.001 591 M W 2 1 0.001 (6.33% of 108 3 0.001 load) 109 3 0.001
(C) Other rapid start units Unit Number Prob. of
no. of start 316 8 0.3 705 4 0.3 707 8 0.3 709 3 0.3 713 4 0.3 units failure Load 9343 M W
IEE PROCEEDINGS, Vol. 137, P t . C , N o . 5, S E P T E M B E R 1990
1 3 2 1 3 1 102 4 103 4 107 2 108 3 109 3 401 2 404 1 511 4 0.001 0.001 0.001 0.001 0.001 0.001 2120 M W 0.001 0.001 (33.31% 0.001 of load) 0.001 0.001
(C) Other rapid start units Unit Number Prob. of no. of start units failure 316 8 0.3 705 4 0.3 707 8 0.3 709 3 0.3 713 4 0.3 Load 6365 M W
From the results in Figs. 5-10, the following observa- tions may be made:
(a) During the first two minutes only online units are available since it takes two minutes for standby hydro units to start up. Of these online units, coal-fired units contribute more power in off-peak periods than in peak periods while oil-fired units give out more power in peak periods than in off-peak periods. This is because coal-
fired units are used as base-load units while oil-fired units are employed as cycling units. Thus, there are more oil- fired units in peak periods and more coal-fired units in off-peak periods. If the two types of units are combined, the contribution of the thermal units is essentially the same for the peak and off-peak periods. Online hydro units are therefore the dominant units available for emer- gency output power and P&(T) in the first 2-min period. The curves in Fig. 9 reveal that these hydro units contrib- uted much more output power in peak periods than in off-peak periods since there are more online hydro units in peak times. This explains the smaller P&(T) index in
the first two minutes for peak periods.
400 3 r 3 Or - 0 2 6 1
g
2 2 time,m in Fig. 6 - off-peakperiod + peakperiodOutput power of all operating reserves
500 I 3 4 0 0 1
d
300- 3 Q c 2 2 0 0 - c 3 0 2 4 6 8 10 time, min Fig. 7 - off-peakperiod+
peakperiodOutput power of coal-fired online units
0 2 4 6 8 10 time,min Fig. 8 - off-peakperiod
+
peakperiod 354Output power of oil-fired online units
(b) Hydro units also dominate the available output power between 2 and 6 min, since there is no significant difference between the contribution of thermal units in peak periods and that in off-peak periods. In this period the standby hydro units increase their outputs from zero to their maximum capacities. The output power in the off-peak period soon surpasses that in the peak period since the available capacity of standby hydro units in the off-peak period is 2120 MW (Table 5) compared with 591
MW (Table 4) for the peak period. A significant drop in the P&(T) index in the off-peak period can, therefore, be expected (Fig. 5). It appears that the system is weakest during the period before the standby hydro units are put on line. This raises the issue of the number of hydro units which should be committed in a proper unit commitment strategy. This will be examined in detail in the following Section. L i 1.41 3
h o t
2t
t
:
0.6 0 . 2 y & / , , , , , , , , , 0 2 4 6 8 10 tlme,min Fig. 9 - off-peakperiod + peakperiodOutput power of online hydro units
time,min
Fig. 10
- off-peakperiod
+
peakperiod(c) The computation of the P&(T) index is more time consuming than that of the P,-,(T) index since a con- tinuous risk curve is employed. A time increment of 0.5 minute was chosen to give an accurate reliability index in a reasonable computational time.
4
To investigate the effect of unit commitment and oper- ating reserve policy on system security, the following index is defined [ 141 :
Output power of standby hydro units
Security analysis using the reliable emergency output power
PR(T) = response risk within a period of T = PR (the amount of output power
increase that the system can provide
in time T
<
REOP) (4)where REOP is the reliable emergency output power in time T . The REOP index and the response risk, as described in Reference 14, are related indices. The REOP index is employed because we are concerned with the system’s capability to increase its output power in 10 min and we are examining how the different commitment policies affect system security. The P&(T) index gives system reliability information over a certain period (e.g., ten minutes) but the REOP index provides the reliable output power in this period. Although the two indices are related they provide the reliability and security informa- tion in different forms. The REOP index is especially useful in examining the effect of commitment strategy and operating reserve policy on system security. In the present study, T is chosen to be 10 min and P R ( T ) is fixed at 0.001. The aim is to find the REOP values for different loading conditions and try to reach a good unit commitment and operating reserve policy using the
REOP index. This index is an indication of the system’s ability to increase its output power to survive a contin- gency such as loss of generation. The REOP index is computed probabilistically. It can be inferred from eqn. 4 that, in no more than one in one thousand emergency cases, the power increase in the 10 min following a dis- turbance will be less than the REOP.
4.1 REO P index for Taiwan power system
The REOP index for each of the 32 load patterns of each year has been computed. The only result presented is that of the off-peak period on a Saturday in spring (Table 6). This is due to limited space. As in P&(T) index computa- tion, gas-turbine units and hot-reserve units are excluded because their lead times are longer than 10 min.
Table 6: REOP index (off-peak period, Saturday, spring)
Year 1983 1984 1985 1986 1987 Load (MW) 3839 4153 4826 5634 6028 Gen. Nuclear 88.8 94.7 79.4 84.0 97.3 in % of Hydro 18.8 29.9 28.2 21.2 23.4 capacity Coal 44.6 55.5 36.9 89.9 67.6 Oil 24.2 24.3 - 24.4 - G & D - - - - - ~~ ~ (MW) Hydro 1096 962 1602 1879 1890 1Omin Coal 102 219 216 182 334 operating Oil 174 87 0 50 0 reserve G & D 0 0 0 0 0 Total 1372 1268 1818 2111 2224 % of Load 35.7 30.5 37.6 37.4 36.9 REOP (MW) 1351 1237 1787 2080 2173
From the computed REOP indices, the following con- clusions can be drawn :
(U) Except for some rare cases in the summer peaks of
1983 and 1984, the REOP index is greater than twice the capacity of the largest unit. In other words, the system can pick up the load in 10 min, even with the loss of the two largest units. This high value of the REOP index is especially desirable for an isolated system like the Taiwan power system.
(b) From Fig. 11, greater operating reserve in ten minutes (including spinning reserve and standby hydro reserve) gives higher values of the REOP index. System security can therefore be enhanced either by increasing the amount of spinning reserve or by increasing the standby hydro reserves.
IEE PROCEEDINGS, Vol. 137, P t . C, No. 5, S E P T E M B E R 1990
4 2 The effect of operating reserve distribution on system security
To examine the effect of operating reserve distribution on the REOP index, the commitment and dispatch for the loading condition on 21st July 1987 will be studied. Table 7 gives the historical operating record during the peak and off-peak periods of that day. This dispatch policy will be referred to as the ‘reference dispatch’. The other dispatch policies that will be investigated are described as follows :
Table 7: Reference dispatch policy of July 21,1987
No. Capacity Nuclear 601 N 600 611 N 940 612 N 940 621 S 920 622 S 920 Fossil coal 303 N 75 304 N 125 305 N 185 307 S 80 313 N 280 314 S 280 315 S 280 317 N 310 331 S 480 332 S 480 333 S 530 334 S 530 oil 318 S 350 319 S 350 320 S 480 323 N 480 329 N 480 330 N 480 Hydro 1 c 110 2 c 44 3 c 21 101 c 15 102 C 180 103 C 92 106 C 32 107 C 98 108 C 360 109 C 234 401 N 90 403 N 50 404 S 40 511 C 1000 run-of-river unit 104 N 22 105 N 13 201 N 18 202 N 56 212 c 21 Nuclear: 4320 Fossil : 6255 Hydro: 2496 North : 5094 Centre: 2207 South: 5730 LOC. (MW) Total : 13071 Peak (MW) %Cap. 553(92.2%) 91 8(97.7%) 904(96.2%) 870(94.6%) 894(97.2%) 74(98.7%) 99(79.2%) 90(48.6%) 70(87.5%) 268(95.7%) 1 17(41.8%) 137(48.9%) 175(36.5%) 397(82.7%) 505(95.3%) 51 4(97.0%) 339(96.9%) 242(78.1%) 330(94.3%) 324(67.5%) 377(78.5%) 207(43.1%) 203(42.3%) 110(100.0%) 21 (1 00.0%) 46(104.5%) 16(106.7%) 84(46.7%) 96(104.3%) 20(62.5%) 17(4.7%) 84(85.7%) 42(17.9%) 90(100.0%) 35 (70.0%) 40(100.0%) 524(52.4%) 25(113.6%) 14(107.7%) 13(72.2%) 49(87.5%) 23(109.5%) 41 39(95.8%) 4468(71.4%) 1349(54.0%) 41 26(41.4%) 1083(10.9%) 9956(100.0%) 4747(47.7%) Trough (MW) %Cap. 548(91.3%) 91 8(97.7%) 907(96.5%) 870( 94.6%) 900( 97.8%) 36(48.0%) 91 (49.2%) 62(77.5%) 61 (48.8%) 11 7(41 .a%) 11 7(41.8%) 133(47.5%) 141 (45.5%) 181 (37.7%) 377(78.5%) 41 5(78.3%) 453(85.5%) 91 (26.0%) 91 (26.0%) 11 5(24.0%) -(-I 4 - 1 4 - 1 11 5(104.5%) 44(100.0%) 21 (100.0%) 15(100.0%) 66 (36.7 %) 96(104.3%) 20(62.5%) 26(7.2%) 35(15.0%) 30(60.0%) 39(97.5%) O(O.O%) 36(36.7%) 84(93.3%) 25(113.6%) 14(107.7%) 13(72.2%) 49(87.5%) 18(85.7%) 41 43 2481 746 3004 (40.8 % ) 492(6.7%) 7370(100.0%) 3874(52.6%)
Dispatch policy 2: The output powers of nuclear units and hydro units are the same as those in the reference dispatch. The spinning reserves are distributed among four larger thermal units while the small thermal units are loaded to their maximum capacities.
Dispatch policy 3 : The output powers of nuclear units
and hydro units are as before. The coal-fired units are all loaded to their maximum capacities. The spinning reserves are distributed over six oil-fired units.
2.2 0 -0 0 1.8- 1.4- x -d
g
1.0- f r - 0.6 3.0 2.61 - - - 0 . 2 1 - 0 0 20 40operating reserve (% of load)
Fig. 11 REOP index as a function often-minute operating reserve
Dispatch policy 4 : The output powers of nuclear units and hydro units are as before. Every thermal unit is loaded to 71.43% of its maximum capacity. The spinning reserves are distributed over all 18 thermal units.
Dispatch policy 5 : The output powers of nuclear units are
the same as before. All hydro units are loaded to their maximum capacity and all thermal units are loaded to 53% of their maximum capacity.
Dispatch policy 6 : The output powers of nuclear units are
the same as before. All hydro units are used as reserves. Every thermal unit is loaded to 91% of its maximum capacity.
The computed REOP indices for these dispatch poli- cies are summarised in Table 8.
Table 8: The REOP indices for different dispatch policies Dispatch Reference 2 3 4 5 6 policy
REOP (MW) 1632 1357 1421 1753 605 2891
The following conclusions can be made from the results in Table 8:
( a ) To enhance system security, the spinning reserves should be distributed over as many units as possible. This is evident from the high REOP index for dispatch policy 4 and the low REOP values for dispatch policies 2 and 3.
(b) Comparing the REOP indices for dispatch policies 5 and 6, it is observed that when more hydro capacities are dispatched, a lower value of REOP can be reached. However, system fuel cost can be reduced by dispatching more hydro units. A compromise must be made between system security and fuel cost. This issue will be addressed in detail later.
4.3 System security and area power balance
Area power balance is desirable for a longitudinal power system such as the Taiwan power system. It can be divided into three areas; the north, the centre, and the south (see Fig. l), from the viewpoint of system stability and transmission losses. Heavy power flows, over the 345 kV trunk lines connecting the three areas, resulting in 356
area power unbalance, could cause dynamic instability
[ 17, 181 and incur high transmission losses.
Table 9: Power generation and load for the three areas under the reference dispatch
Area Generation Load Power (MW) (MW) surplus ( MW) North 4126 4948 -822 Centre 1083 1951 -868 South 4747 3057 1690 Total 9956 9956 0 ( M O P = 1632 MW)
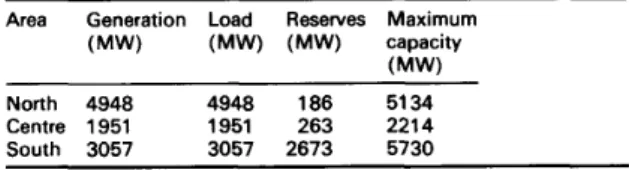
Table 9 list the generation and load for the three areas under the reference dispatch. It is observed that there are 822 MW and 868 MW power deficiencies for the north and the centre, respectively. The power flows over the trunk lines from the south to the centre and from the centre to the north will therefore be 1690 MW and 822 MW, respectively. These undesirable heavy flows between the three areas can be avoided by generation redispatch. The resulting dispatch, which will be referred to as dispatch policy 7, is summarised in Table 10. It can be concluded from this Table that area power balance can be achieved at the expense of a much lower REOP value (854 MW rather than 1632 MW for the reference dispatch). The poor security for dispatch policy 7 is mainly because all hydro units in the centre are com- mitted and dispatched. A compromise between system security and area power balance must be made to reach an optimal dispatch policy.
T a b l e l o : Power generation and load for the three areas under dispatch policy 7
Area Generation Load Reserves Maximum (MW) (MW) (MW) capacity (MW) 4948 186 5134 North 4948 Centre 1951 1951 263 2214 South 3057 3057 2673 5730
4.4 System security and fuel cost
To examine the relationship between system security and total fuel cost, the following dispatch policies are con- sidered :
Dispatch policy 8 : The outputs of nuclear units are fixed. All hydro units are loaded to the same percentage as that of their maximum capacities. This percentage varies from 0 to 100%. All thermal reserves are in the south.
Dispatch policy 9 : This is the same as dispatch policy 8
but all thermal reserves are in the north.
Dispatch policy 10: This is the same as dispatch policy 8 but the thermal reserves are distributed between both northern and southern areas.
The REOP indices and fuel costs for the three dispatch policies are depicted in Figs. 12 and 13, respectively.
It is observed from the results in Figs. 12 and 13 that the fuel cost can be decreased by increasing hydro gener- ation. However, the system security will deteriorate as more hydro units are committed. Thus, a compromise between system security and fuel costs must be made to determine the correct level of hydro generation. Of the IEE PROCEEDINGS, Vol. 137, Pt. C, No. 5, SEPTEMBER 1990
three dispatching policies, policy 10 yields highest value of REOP by distributing the thermal reserves in the northern and southern areas. Policy 9 has the lowest fuel cost because many coal-fired units with a lower fuel cost in the south are committed and dispatched.
0 20 40 60 80 100
hydro generation ( % o f maximum capacity)
REOP indices for dispatching policies 8 , 9 and I O Fig. 12 ______ policy 10 policy 8 policy 9 I 0 20 40 60 ao 100
hydro generation ( % o f maximum capacity)
Fig. 13
~ policy 10
policy 9
Fuel costs for dispatching policies 8 , 9 and 10
policy 8
5 Conclusions
An extension to the original PJM method has been pro- posed to examine the effect of operating reserve, unit commitment and dispatch policy on the reliability of Taiwan power system. System security is studied using the reliable emergency output power (REOP) index. The relationships between system security and reserve dis- tribution, area power balance and fuel cost are exten- sively studied. From the study conducted on Taiwan power system, the following conclusions can be drawn :
(i) The P,,(T) for T = 6 hours is less than
(ii) The P,,(T) index decreases with increasing amount of spinning reserves.
(iii) Hydro units dominate the available emergency output power during the first few minutes following a dis- turbance. Hence, they are the most important units which affect the P&( T) index.
(iv) Except for some rare cases, the REOP index is greater than twice the capacity of the largest unit.
(v) While the P&(T) index gives the system reliability in a certain period, the REOP index provides the reliable output power in this period. The two indices are related IEE PROCEEDINGS, Vol. 137, Pt. C , N o . 5, S E P T E M B E R 1990
to each other but they provide reliability and security information in different forms.
(vi) A greater amount of spinning reserve gives a higher REOP index.
(vii) System security can be enhanced by decreasing the dispatched hydro generation. However, this is achieved at the expense of higher fuel cost.
(viii) Area power balance can be reached at the expense of poorer security.
(ix) Although the present work is based on the oper- ating records of the past, the techniques developed can also be applied to predict system performance of the future: When the generation schedule for the next 24 h has been determined by unit commitment routine, the
P&(T) and REOP indices for the generation schedule can
be calculated. The errors for the forecasted hourly loads and generator lead times in our system are normally less than 3%. It is therefore expected that accurate probabil- istic indices can be calculated.
6 Acknowledgments
The authors would like to thank the referees for their valuable comments. Assistance from the people of the System Operation Department of Taiwan Power Company is very much appreciated.
7 References
1 WOOD, A.J., and WOLLENBERG, B.F.: ‘Power generation, oper-
ation and control’ (Wiley, New York, 1984)
2 COHEN, AI., and SHERKAT, V.R.: ‘Optimisation-based methods
for operations scheduling’, IEEE Proc., 1987,75, (12), pp. 1574-1591
3 HAPP, H.H.: ‘Optimal power dispatch - a comprehensive survey’,
IEEE Trans., 1977, PAS-96, pp. 841-854
4 HAPP, H.H., JOHNSON, R.C., and WRIGHT, W.J.: ‘Large scale
hydro-thermal unit commitment-method and results’, IEEE Trans.,
1971, PAS-90, pp. 1373-1384
5 PANG, C.K., and CHEN, H.C.: ‘Optimal short-term thermal unit
commitment’, IEEE Trans., 1976, PAS%, pp. 13361346
6 SYNDER, W.L., Jr., POWELL, H.D., Jr., and RAYBURN, J.C.:
‘Dynamic programming approach to unit commitment’, IEEE
Trans., 1987, PWRS2, pp. 339-350
7 MERLIN, A., and SANDRIN, P.: ‘A new method for unit com-
mitment at Electricite de France’, IEEE Trans., 1983, PAS-102, pp. 1218-1225
8 GUY, J.D.: ‘Security constrained unit commitment’, IEEE Trans., 1971, PAS-90, pp. 138S1390
9 DILLON, T.S., EDWIN, K.W., KOCHS, H.D., and TAUD, R.J.: ‘Integer programming approach to the problem of optimal unit commitment with probabilistic reserve determination’, IEEE Trans.,
1978, PAS-97, pp. 2154-2166
10 ARARIPE NETO, T.A., PEREIRA, M.V.F., and KELMAN, J.: ‘A
risk-constrained stochastic dynamic programming approach to the operation planning of hydrothermal systems’, IEEE Trans., 1985,
PAS-104, pp. 273-279
11 ENDRENYI, J. : ‘Reliability modelling in electric power systems’ (Wiley, New York, 1978)
12 ANSTINE, L.T., et al.: ‘Application of probability methods to the
determination of spinning reserve requirements for the Pennsylvania-New Jersey-Maryland Interconnection’, IEEE Trans.,
1963, PAS-82, pp. 726735
13 LEFFLER, L.G., et al., ‘Operating reserve and generation risk
analysis for the PJM interconnection’, IEEE Trans., 1973, PAS-94,
14 BILLINTON, R., and ALLAN, R.N.: ‘Reliability evaluation of power systems’ (Plenum Press, New York, 1984)
15 LEE, Y.S.: ‘Short term generation reliability analysis’. MSc thesis,
National Taiwan University, 1988
16 JIEN, J.D.: ‘Effect of operating reserve on generation system relia-
bility’. MSc thesis, National Taiwan University, 1988
17 HSU, Y.Y., SHYUE, S.W., and SU, C.C.: ‘Low frequency oscil-
lations in longitudinal power system: experience with the dynamic stability of Taiwan Power System’, IEEE Trans., 1987, PWRS2,
18 HU, I.H., CHEN, M.S., LIANG, C.C., and LUN, C.T.: The
dynamic operational characteristics of Taiwan Power Company’,
IEEE Trans., 1984, PAS-103, pp. 2173-2180 pp. 396407
pp. 92-100