腦中風預防衛教對腦中風認知的影響— 以大學生為對象之先驅研究
39
0
0
全文
(2) Acknowledgement. I would like to thank my supervisors Dr. Mei-Chiun Tseng and Dr. Lih-Lian Hwang for their kind support and patience.. II.
(3) 摘要 背景與目的 在台灣,腦中風多年來位居主要死因前三名,若民眾對腦中風預防具備更充 足及正確的知識,或可降低腦中風的發生率及死亡率。本研究目的在初探是否可 藉由腦中風預防衛教課程,提升大學生對腦中風的致病危險因子、發生時的症 狀,以及緊急送醫處理(撥打 119)的認知。 研究方法 以北市某大學 A、B 兩個班級的學生為方便性樣本,在課程前以問卷測試對 腦中風相關知識的認知水準,作為比較基準。然後對學生以影片及投影片的方式 進行 50 分鐘的衛教課程,內容包括上述各方面的知識。課程後馬上以問卷進行 後測,並於課程後的 12 週再行追蹤。其中班級 A 採封閉型問卷,而班級 B 採開 放式問卷。以重複量數一因子變異數分析(repeated measure one-way ANOVA)檢驗 此三次測驗的平均分數是否相同,並且以 T 檢定比較男女間各次測驗的平均分數 是否有差異。本研究採用之統計軟體為 Stata 7.0 版,顯著水準定為 0.05。 研究結果 兩班級樣本數共 138 人,其中班級 A 的有效樣本為 56 人(90%),班級 B 為 53 人(91%),平均年齡皆為 22 歲;班級 A 中有 39%的學生是女性,而女性在班 級 B 則佔了 77%。前測時,班級 A 全部的學生均能夠辨識出 1 個以上的危險因 子、1 個危險徵狀;班級 B 則有 5%的學生無法回答出 1 個危險因子,24%無法 說出 1 個危險徵狀。並且兩班級中有 18-20%的學生不知道腦部是腦中風發生的 器官。課程實施後,學生對腦中風預防相關知識的分數顯著提升(p<0.0001),然 而 12 週後學生的分數則比課程結束時低(p<0.0001);除了班級 B 的後測結果外 (p<0.05),各次分數在性別間並無顯著差異。 結論 對大學生實施本衛教課程的確提升了學生對腦中風知識的認知水準,但該效. III.
(4) 果會隨著時間消退;性別在本研究中並不是影響學習效果的因素。有關當局可考 慮透過適當的衛教課程設計,提升目標族群的腦中風預防知識。 關鍵詞:腦中風 ■ 衛生教育 ■ 台灣. IV.
(5) Abstract Background and Purpose—Stroke has been a leading cause of death for decades in Taiwan.. The mortality and morbidity may be reduced if people have the correct. knowledge about stroke.. This pilot study aimed to examine the effectiveness of an. educational program aiming to increase college students’ knowledge of cause of stroke, risk factors, stroke warning signs, and action needed (call 119) when a stroke is suspected. Methods—Two classes (A and B) of college students was used as convenience sample.. The program evaluation consisted of a pretest, a 50-minute educational. intervention, immediate posttest, and a 12-week follow-up. Class A was tested via close-ended questionnaire while class B open-ended one.. Repeated measure. one-way ANOVA was used to compare mean score of three tests.. Comparisons of. mean score between male and female participants of each evaluation point were assessed by t-tests.. Stata 7.0 for Windows was used for the analysis at significance. level of 0.05. Results—A total of 138 college students participated the educational program. Response rate was 90% and 91% in class A and B respectively with mean age of 22 years.. In pretest, all students in class A were able to recognize ≥1 risk factors (RF),. ≥1 warning signs (WS).. In class B, 5% were not able answer one RS and 24%. couldn’t name one WS.. Of the students, 18-20% in both classes did not recognize. the brain as the affected organ in stroke.. Mean score improved significantly after the. intervention (p<0.001), and dropped after 12 weeks (p<0.001).. The effects of gender. toward knowledge level were non-significant except posttest in class B (p<0.05). Conclusions—Our study showed that college students’ knowledge of stroke could be improved by educational program.. However, learning effects faded away with time.. V.
(6) Our data showed that gender was irrelevant to learning effects.. Policy makers may. consider improving public knowledge of stroke through properly designated educational program. Key Words: stroke ■ health education ■ Taiwan. VI.
(7) Content 1. Background and Purpose ........................................................................................1 2. Methods.....................................................................................................................3 2.1 Design ..................................................................................................................3 2.2 Description of the Educational Program .........................................................4 2.3 Questionnaire and Assessment..........................................................................5 2.4 Statistical Analysis..............................................................................................6 3. Results .......................................................................................................................7 4. Discussion..................................................................................................................9 Reference.....................................................................................................................15 Appendix 1.. Slides of the Stroke Prevention Educational Program ..................28. Appendix 2.. Close-ended Questionnaire for Class A. (Pretest) ..........................29. Appendix 3.. Open-ended Questionnaire for Class B. (Pretest) ..........................30. Appendix 4.. Close-ended Questionnaire for Class A. (Posttest and 12 week. follow-up) ....................................................................................................................31 Appendix 5.. Open-ended Questionnaire for Class B. (Posttest and 12 week. follow-up) ....................................................................................................................32. VII.
(8) 1. Background and Purpose Stroke remains the second or third leading cause of death and a major cause of long-term disability in Taiwan for decades. Once a stroke occurs, it affects not only the person that could be disabled, but also the entire family and other caregivers as well.. In Taiwan, 12,596 deaths (55.2 deaths per 100,000 people) and around $12.6. billion NT dollars medical expenses (including outpatient and inpatient services) were attributed to cerebrovascular disease in 2006.1 While enormous resources have been used in the treatment and rehabilitation of stroke patients, the living quality of stroke patients as well as their caregivers cannot be restored.. Since healthcare resources are. limited, it is best to consider how to effectively prevent stroke.. Researches have indicated that to a certain extent stroke is preventable. According to a guideline published by American Heart Association/American Stroke Association (AHA/ASA) in 2006, modifiable risk factors can be classified as well-documented and less well-documented ones.2. The former include hypertension,. exposure to cigarette smoke, diabetes, certain cardiac conditions, atrial fibrillation, dyslipidemia, carotid artery stenosis, sickle cell disease, postmenopausal hormone therapy, poor diet, physical inactivity, body fat distribution or high cholesterol level and obesity.. The later include alcohol abuse, acute infection, sleep-disordered. breathing, and so forth.. People may improve their health status and lower the risk of 1.
(9) stroke via behavioral changes such as healthy diet, proper physical exercise and smoke quitting.. However, people behave according to their perception or knowledge.. False perception or insufficient knowledge will inevitably lead to unhealthy behavior and life style, and raise stroke incidence. Besides, time is crucial for saving a stroke patient’s life: for ischemic stroke patients, intravenous recombinant tissue-type plasminogen activator (IV rtPA) is the most effective therapy so far, and it must be applied within 3 hours of symptom onset; for hemorrahage stroke patients, immediate surgery (e.g., aneurysm repair) is crucial to prevent rebleeding that results in serious impairment or death.. Therefore, teaching people how to recognize stroke warning. symptoms and react correctly when a stroke is suspected may save stroke patients’ lives before it is too late. There were several studies investigating public awareness about stroke.3-8 Researchers also examined whether stroke-related knowledge can be improved through educational programs.9,10. However, few studies reported public’s. knowledge toward stroke in Taiwan. Yeh et al. concluded that knowledge of stroke risk factors and warning signs was still not well known in one-third to one-half of their study samples, and suggested that education projects should be implemented in order to improve people’s knowledge of stroke.11. With this background information,. the present study aimed to examine whether the awareness/perception of stroke 2.
(10) knowledge can be improved through educational program.. Positive results can be a. reference for further studies, or be a supportive evidence to recommend the authorities to invest more resources into stroke prevention educational programs or campaigns to the public.. 2. Methods 2.1 Design. To examine if the knowledge of stroke could be improved through a prevention educational program, the experiment started from October 2007, and ended in January 2008.. This program aimed at college students in order to change their. perception/knowledge before their joining the work force and fixing their living style. Using convenience sampling, two classes (class A and B) of college students in Taipei were chosen as subjects.. All sample students took this one semester course named. “recognizing common diseases”, and they had no medical related background. Students of both classes completed a pretest questionnaire which was developed specially for this study. A healthcare management professor developed this assessment questionnaire after consulting with a neurologist.. Note that class A was. tested by a close-ended questionnaire while class B by an open-ended one in order to. 3.
(11) obtain extra information.. Both classes were exposed to an educational program. lectured by the aforementioned professor. Before the program, both classes were informed that an immediate posttest would follow the program. program, we had both classes complete their posttest.. Right after the. Twelve weeks later, all the. students were again tested by the same questionnaire as a follow-up.. 2.2 Description of the Educational Program. We designed a 50-minute educational program including video and lecture to introduce knowledge of stroke. First, students watched a DVD named “The Body Invaders: Brain Attack”, published by Discovery Channel. The video is English pronounced with traditional Chinese subtitle.. Total length of this DVD is 50 minutes,. but we only presented the first 34 minutes to the students. This video first explained the cause of ischemic and hemorrahage stroke. Then, it explained five warning symptoms and the risk factors such as hypertension, diabetes, heart diseases, improper diet, lack of exercise and smoking via actual cases.. Lastly, it showed an interview. with a stroke patient who was undergoing his rehabilitation to reveal the mental and physical suffering of him.. After this show, the students were given a 16 minutes. lecture with slides (Appendix 1).. Lecture part comprised of 5 sections: (1). 4.
(12) pathophysiology of stroke; (2) eight risk factors, including cardiopathy, cigarette smoking, high blood pressure (hypertension), high cholesterol levels, obesity, diabetes, age and history of stroke; (3) what can be done to prevent stroke: taking exercise, BMI control, proper diet, quitting smoking, good control of hypertension/diabetes/high cholesterol; (4) five warning signs: numbness or a lack of feeling (on one side of the body), headache, visual impairment, speech impairment, balance problems; (5) what to do when a stroke is suspected: call 119 (emergency call in Taiwan) immediately to send the patient to hospital in time.. 2.3 Questionnaire and Assessment. Parallel questionnaire in pretest, posttest and 12 weeks follow-up were used to assess stroke knowledge (Appendix 2 to 5). Each questionnaire contained four domains that were mentioned in the slides.. Domain 1: which organ does a stroke. attack; domain 2: what are the risk factors of stroke; domain 3: what are the warning symptoms of stroke; domain 4: what is the correct action to take when you witness a stroke.. Multiple choices were provided to students of class A to choose, while. students of class B write answers in their own manners.. In order to moderate the. reinforcement effect of slide and close-ended questionnaire, only those replies. 5.
(13) identical to the messages highlighted on the slide were considered as correct and scored.. In other words, brain was the only correct response in domain 1.. For risk. factors, correct responses included cardiopathy, cigarette smoking, hypertension, high cholesterol level, obesity, diabetes, age, history of stroke.. Other response such as. weather, mood, stress, improper diet, physical inactivity, alcohol intake, family history and gene were considered incorrect although some of them were documented.2 Stroke warning symptoms were defined according to the lectured five as mentioned afore.. “Coma” was classified as incorrect.. In domain 4, “calling 119” was the. correct action to take when a stroke was suspected, while “bloodletting” was classified as incorrect.. 2.4 Statistical Analysis. Students who completed all pretest, first posttest and second posttest were considered as valid samples.. The recognition rate of each option/answer was. calculated. For example, if 5 out of 56 students choose/answer headache as stroke warning symptom, the recognition rate of headache would be 9% (5/56). Comparison of recognition rate of each option/answer in pretest between male and female participants was assessed with χ2 tests.. 6.
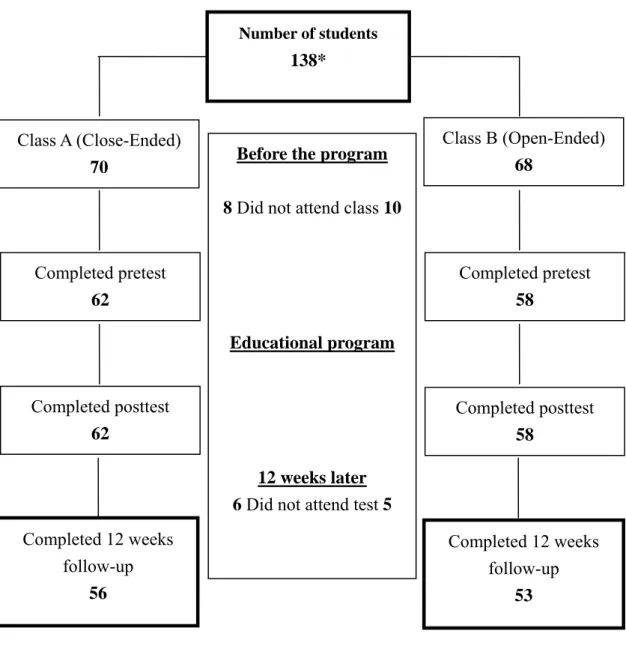
(14) In order to check if the education can improve students’ knowledge, we hypothesized that mean score of three assessments were equal, and then tested it by repeated measure one-way ANOVA.. If the hypothesis didn’t hold, we would further. test if any two mean scores are equal by the same means.. P value was adjusted by. Huynh-Feldt ε due to repeated measure experimental design. Mean difference in scores of each assessment point were compared between male and female participants with t test. Stata 7.0 for Windows was used for the analysis at significance level of 0.05.. 3. Results Figure 1 summarizes the flow of studied subjects.. Overall, 90% (56/62) of. class A and 91% (53/58) of class B completed all pretest, posttest and 12 weeks follow-up.. Six students in class A and five students in class B were excluded. because they didn’t participate in the 12 weeks follow-up. In class A, there were 61% male and 39% female with an average age of 22 years (range 19-26 years). Among students of class A, 61% reported that they had been exposed to stroke related knowledge before.. As for class B, 23% of the students were male and 77% were. female with an average age of 22 years (range 20-24 years). In class B, 42%. 7.
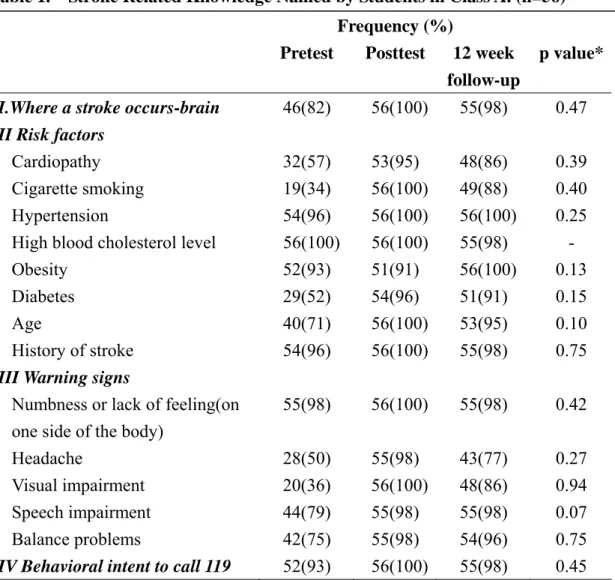
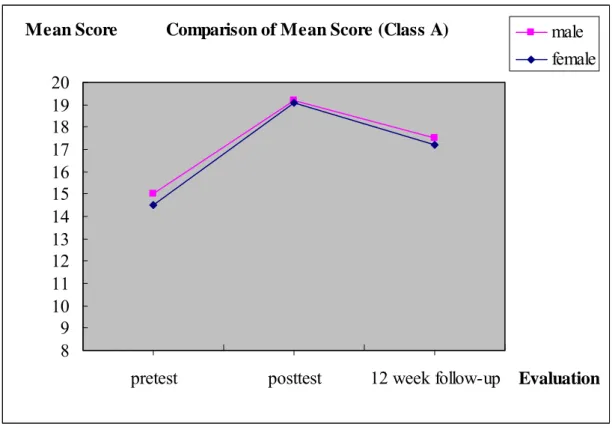
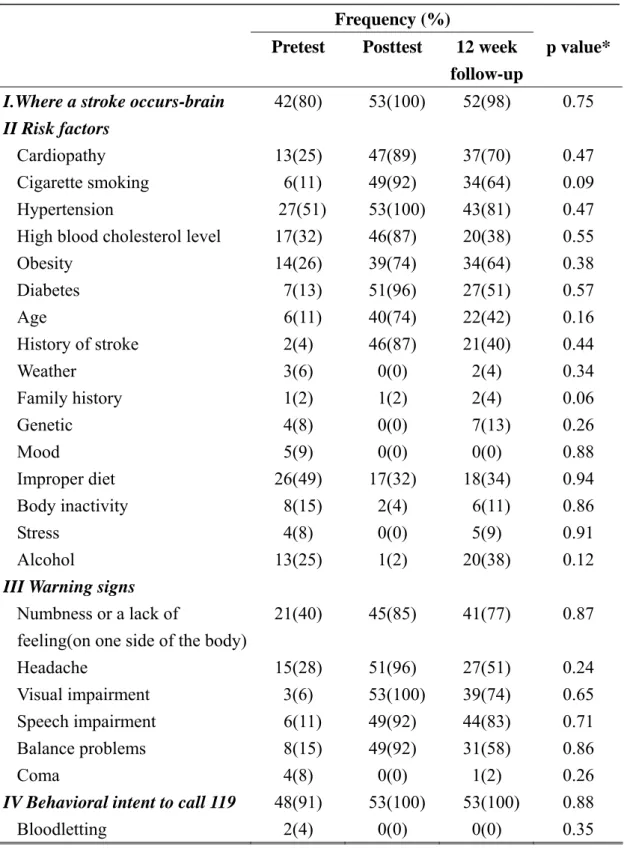
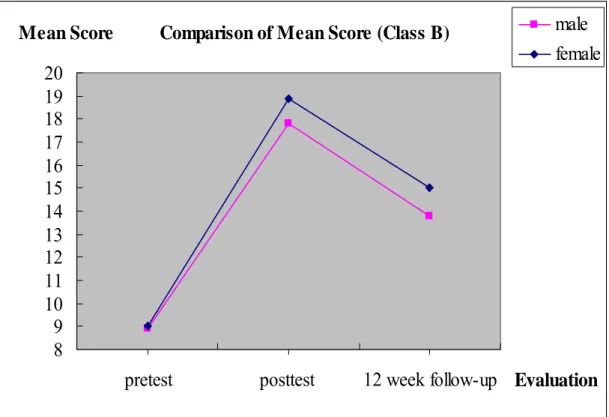
(15) reported that they had been exposed to stroke related information before.. Generally speaking, recognition rate of each correct option/answer was the lowest in pretest and the highest right after the intervention, with that of 12-week follow-up test being in-between.. Nevertheless, the recognition rate of high. cholesterol level and obesity in class A did not conform to this tendency. Comparisons of recognition rate of each option/answer in pretest between male and female participants showed that there was no significant difference between genders in both classes. (p>0.05) (Table 1 and 2).. In pretest, all students in class A were able to recognize at least three risk factors, while 5% in class B were not able to answer even one.. For warning symptoms, all. students in class A could recognize one or more, while 24% in class B couldn’t even name one.. Of the students, 18 and 20% respectively in class A and B did not know. that brain is the affected organ in stroke.. When comparing three mean score of pretest, posttest and 12 weeks follow-up, we found that the mean score of pretest was the lowest, while mean score of posttest was the highest.. The tendency was the same when we observed the three mean score. of male and female students separately (Figure 2 and 3).. For each assessment point,. female students performed less well than male ones in class A.. 8. On the contrary,.
(16) female students in class B had higher mean score than male ones.. But such. difference between gender was not statistically significant except posttest result in class B (p<0.05) (Table 3 and 4).. Test of equality of three mean scores showed that there was at least one mean score unequal to the other two (p<0.0001).. Mean score between pretest and posttest,. posttest and 12 weeks follow-up, pretest and 12 weeks follow-up were all unequal in both classes (p<0.0001).. The results indicated that the educational program indeed. had an influence on students’ knowledge towards stroke.. However, the influence. would somehow fade away as time passed by.. 4. Discussion Our study showed that the stroke educational program indeed could improve college students’ knowledge towards stroke pathophysiology, risk factors, warning symptoms and action to take when a stroke was suspected, same as other studies.4-5, 12 Regardless of the type of assessment questionnaire, mean score of both classes improved immediately after the educational program.. Overall, such educational. program design successfully conveyed message to the students.. Before the program, knowledge of stroke risk factors and warning symptoms 9.
(17) seemed extremely well in class A (close-ended questionnaire): all students in class A could recognize three or more risk factors and at least one warning symptom.. A. study in Brazil found that up to 38% of respondents were unable to identify any risk factors and 41% any symptoms.13. Müller-Nordhorn J et al. reported that 32% of. respondents in Berlin were not able to name one stroke risk factor.5. In northwest. India, Pandian et al concluded that 23% of the subjects did not know a single warning symptom, and 21% couldn’t identify even a single risk factor.4. However, the. aforementioned studies all used open-ended questionnaire for assessment.. If we. checked the results of class B (open-ended questionnaire) for equal comparison, the awareness/knowledge level of our subjects was still higher than that of other studies. There was only 5% of students couldn’t name a single risk factor and 24% did not know any warning symptom.. Any attempt on cross-study comparisons has to be. done carefully since studies generally adopted different questionnaire or survey methods.14. The original awareness status of students was presented in the pretest results, and such information is important for goal setting of future educational program/campaign. Reconsidering what we have done, it seems better to design the program/campaign based on pretest results. For instance, “genetic factors” was included in the nonmodifiable risk factors in ASA/AHA 2006 guideline,2 but we did not introduce it 10.
(18) during the educational program.. The recognition rate of it then dropped after the. program, somehow to our surprise. Another example was cigarette smoking: its recognition rate was the lowest in both classes during pretest.. This may imply that. college students were not alert to smoking behavior in their daily life.. Besides, 4%. of students in class B replied that “bloodletting” as an emergency treatment to stroke and which is merely a myth.15. There were also students in class B replying weather,. stress, mood, alcohol intake and family history as risk factors, yet whether they are risk factors were still controversial.16-30. All information collected during pretest. could help identify the deficiency or myths the students have and permit more targeted education efforts.. Mean score of male students was not significantly different from that of female students except in the posttest of class B (p<0.05).. However, sample size was too. small (34 male and 22 female in class A; 12 male and 41 female in class B) for us to assert that gender was a factor that has influence on the learning performance.. The coding rule may affect the evaluation of educational effects, so does the questionnaire design. The overall average score of class A was higher than that of class B.. This might due to the fact that close-ended questionnaire somehow. reminded students of the message introduced on the slides. Moreover, we did not code physical inactivity and improper diet as correct answers. 11. The reason for doing.
(19) so was to avoid underestimating the learning effect.. If we coded these two risk. factors as correct, the mean score of posttest would be lower than present data since the recognition rate of them dropped after the intervention. As a matter of fact, these two risk factors were listed on the “how to prevent a stroke” section of the slide instead of “risk factors” one.. And since we did not measure students’ attitude. towards how to prevent stroke, we may not assert that students were not aware that they can reduce risk of stroke through dietary control and physical exercise.. This. was why we kept them neutral to not dilute the education effect of the other listed risk factors.. Mean score of both classes declined in 12 weeks follow-up. This result implied that education effect faded away with time as expected. same tendency.9. Another study showed the. How to maintain students’ knowledge of stroke was therefore. crucial, otherwise such education attempt was just a waste of time and resources. It seems that we have to take action to reinforce students’ awareness.. Observing the. world of advertising, there appears to be three underlying principles for getting messages out to people, and ensuring messages to be remembered.. They are (1). consistency, (2) simplicity, and (3) repetition.31 In our educational program design, we did arrange and list the key points of risk factors and warning symptoms on the slide to simplify the message.. The trade-off between simple and comprehensive 12.
(20) message came into question.32-33. To evaluate the repetition effect or how long. should the interval be still await further investigation.. Gaps usually exist between knowing and doing.. There were several developed. models about individual health behavior discussing how to stimulate positive behavior changes, such as Health Belief Model (HBM), Theory of Reasoned Action (TRA), and the Transtheoretical Model (TTM).34 Individual perception/awareness precedes their behavioral change.. Our study provides evidence that through such educational. program, we may improve students’ perception/awareness. Based on the finding of this pilot study, we may further apply aforementioned model to enhance behavioral change.. This study has limitations. ones.. We took convenient samples instead of randomized. The results may only be representative for participants with college education. in rural area. Also, due to insufficient samples, we didn’t adjust the results by individual characteristics other than genders to avoid statistical bias.. Care must be. taken to generalize these results to other populations.. In conclusion, there were still gaps of stroke knowledge among college students to fill.. A well-designed educational program, which takes into account the primary. awareness status of the targeted audience, may be an effective way to bridge the gap.. 13.
(21) Therefore, conducting a large scale research to identify the deficiency of stroke knowledge of targeted population for further educational program/campaign design seems worthwhile.. 14.
(22) Reference 1.. 2006 National Health Insurance Annual Statistics Reports. 2006. Available at www.doh.gov.tw/statistic/data/全民健康保險統計年報/95 醫療統計年報 /01/950128.xls/. Assessed Jun 08, 2008.. 2.. Goldstein LB, Adams R, Alberts MJ, Appel LJ, Brass LM, Bushnell CD, Culebras A, Degraba TJ, Gorelick PB, Guyton JR, Hart RG, Howard G, Kelly-Hayes M, Nixon JV, Sacco RL. Primary prevention of ischemic stroke: a guideline from the American Heart Association/American Stroke Association Stroke Council: cosponsored by the Atherosclerotic Peripheral Vascular Disease Interdisciplinary Working Group; Cardiovascular Nursing Council; Clinical Cardiology Council; Nutrition, Physical Activity, and Metabolism Council; and the Quality of Care and Outcomes Research Interdisciplinary Working Group: the American Academy of Neurology affirms the value of this guideline. Stroke. 2006; 37: 1583-633.. 3.. Reeves MJ, Rafferty AP, Aranha AAR, Theisen V. Changes in Knowledge of stroke risk factors and warning signs among Michigan adults. Cerebrovasc Dis. 2008; 25: 385-91.. 4.. Pandian JD, Jaison A, Deepak SS, Kalra G, Shamsher S, Lincoln DJ, Abraham G. Public awareness of warning symptoms, risk factors, and treatment of stroke in. 15.
(23) northwest India. Stroke. 2005; 36: 644-48. 5.. Müller-Nordhorn J, Nolte CH, Rossnagel K, Jungehülsing GJ, Reich A, Roll S, Villringer A, Willich SN. Knowledge about risk factors for stroke: a population-based survey with 28,090 participants. Stroke. 2006; 37: 946-50.. 6.. Gupta A, Thomas P. Knowledge of stroke symptoms and risk factors among at-risk elderly patients in the UK. Int J Clin Pract. 2002; 56: 634-7.. 7.. Sug Yoon S, Heller RF, Levi C, Wiggers J, Fitzgerald PE. Knowledge of stroke risk factors, warning symptoms, and treatment among an Australian urban population. Stroke. 2001; 32:1926-30.. 8.. Kraywindel K, Heidrich J, Heuschmann PU, Wagner M, Berger K. Stroke risk perception among participants of a stroke awareness campaign. BMC Public Health. 2007; 7:39.. 9.. Miller ET, King KA, Miller R, Kleindorfer D. FAST Stroke Prevention Educational Program for Middle School Students: pilot study results. J Neurosci Nurs. 2007; 39: 236-42.. 10. Morgenstern LB, Gonzales NR, Maddox KE, Brown DL, Karim AP, Espinosa N, Moyé LA, Pary JK, Grotta JC, Lisabeth LD, Conley KM. A randomized, controlled trial to teach middle school children to recognize stroke and call 911: the kids identifying and defeating stroke project. Stroke. 2007; 38: 2972-78.. 16.
(24) 11. Yeh BH, Cheng CH, Wang YH, Huang LH, Chan YC, Hu MH, Teng YC, Lin CY, Lin YC, Li CC, Hsu SH. The northern Taiwan stroke center for prevention and treatment project 2004. Taipei: Dept. of health (TW), Bureau of Health Promotion; 2004 Report No.: DOH93-HP-1114. 2004. 12. Stern EB, Berman M, Thomas JJ, Klassen AC. Community education for stroke awareness: An efficacy study. Stroke. 1999; 30: 720-3. 13. Campos-Sousa RN, Soares VY, Almeida KJ, Carvalho LI, Jacobina KS, Athayde Netto AE, Macêdo Ede A, Veloso LA, Knowledge of stroke among a brazilian urban population. Arq Neuropsiquiatr. 2007; 65: 587-91. 14. Billings-Gagliardi S, Mazor KM. Development and validation of the stroke action test. Stroke. 2005; 36: 1035-9. 15. O’Connor A. The Claim: Really? Pricking a stroke victim’s fingers can help delay symptoms. New York Times. 2006 Nov 21; Sect. F:5. 16. Dawson J, Weir C, Wright F, Bryden C, Aslanyan S, Lees K, Bird W, Walters M. Associations between meteorological variables and acute stroke hospital admissions in the west of Scotland. Acta Neurol Scand. 2008; 117: 85-9. 17. Ohshige K,. Hori Y, Tochikubo O, Sugiyama M. Influence of weather on emergency transport events coded as stroke: population-based study in Japan. Int J Biometeorol. 2006; 50: 305–11.. 17.
(25) 18. Oberg AL, Ferguson JA, McIntyre LM, Horner RD. Incidence of stroke and season of the year: evidence of an association. Am J Epidemiol. 2000; 152: 558-64. 19. Feigin VL, Nikitin YP, Bots ML, Vinogradova TE, Grobbee DE. A population-based study of the associations of stroke occurrence with weather parameters in Siberia, Russia (1982-92). Eur J Neurol. 2000; 7: 171-8. 20. Low RB, Bielory L, Qureshi AI, Dunn V, Stuhlmiller DF, Dickey DA. The relation of stroke admissions to recent weather, airborne allergens, air pollution, seasons, upper respiratory infections, and asthma incidence, September 11, 2001, and day of the week. Stroke. 2006; 37: 951-7. 21. Field TS, Hill MD. Weather, Chinook, and stroke occurrence. Stroke. 2002; 33: 1751-7. 22. Truelsen T, Nielsen N, Boysen G, Grønbaek M. Self-reported stress and risk of stroke: the Copenhagen City Heart Study. Stroke. 2003; 34: 856-62. 23. Salaycik KJ, Kelly-Hayes M, Beiser A, Nguyen AH, Brady SM, Kase CS, Wolf PA. Depressive symptoms and risk of stroke: The Framingham study. Stroke. 2007; 38: 16-21. 24. Carod-Artal FJ. Are mood disorders a stroke risk factor? Stroke. 2007; 38: 1-3. 25. Mukamal KJ, Chung H, Jenny NS, Kuller LH, Longstreth WT Jr, Mittleman MA,. 18.
(26) Burke GL, Cushman M, Beauchamp NJ Jr, Siscovick DS. Alcohol use and risk of ischemic stroke among older adults: the cardiovascular health study. Stroke. 2005; 36: 1830-4. 26. Mukamal KJ, Ascherio A, Mittleman MA, Conigrave KM, Camargo CA Jr, Kawachi I, Stampfer MJ, Willett WC, Rimm EB. Alcohol and risk for ischemic stroke in men: the role of drinking patterns and usual beverage. Ann Intern Med. 2005; 142: 11-9. 27. Iso H, Baba S, Mannami T, Sasaki S, Okada K, Konishi M, Tsugane S. Alcohol consumption and risk of stroke among middle-aged men: the JPHC Study Cohort I. Stroke. 2004; 35: 1124-9. 28. Reynolds K, Lewis B, Nolen JD, Kinney GL, Sathya B, He J. Alcohol consumption and risk of stroke: a meta-analysis. JAMA. 2003; 289: 579-88. 29. Kim H, Friedlander Y, Longstreth WT Jr, Edwards KL, Schwartz SM, Siscovick DS. Family history as a risk factor for stroke in young women. Am J Prev Med. 2004; 27: 391-6. 30. Kubota M, Yamaura A, Ono J, Itani T, Tachi N, Ueda K, Nagata I, Sugimoto S. Is family history an independent risk factor for stroke? J Neurol Neurosurg Psychiatry. 1997; 62: 66-70. 31. Hodgson CS. FAST or not to FAST. Stroke. 2007; 38: 2631-2.. 19.
(27) 32. Kleindorfer KO, Miller R, Moomaw CJ, Alwell K, Broderick JP, Khoury J, Woo D, Flaherty ML, Zakaria T, Kissela BM. Designing a Message for Public Education Regarding Stroke: does FAST Capture Enough Stroke? Stroke. 2007; 38: 2864-8. 33. Chiti A, Giorli E, Orlandi G. FAST or Not to FAST: SHOUT-FAST! Stroke. 2008; 39: 40-1. 34. Glanz K, Lewis FM, Rimer BK. Health behavior and health education. 2nd ed. (CA): Jossey-Bass Publishers; 1997. p.37-139.. 20.
(28) Number of students. 138*. Class A (Close-Ended) 70. Before the program. Class B (Open-Ended) 68. 8 Did not attend class 10. Completed pretest. Completed pretest. 62. 58 Educational program. Completed posttest. Completed posttest. 62. 58 12 weeks later 6 Did not attend test 5. Completed 12 weeks follow-up. Completed 12 weeks follow-up. 56. 53. *All the numbers in this figure means number of students. Figure 1.. Flow of Students through the Study.. 21.
(29) Table 1.. Stroke Related Knowledge Named by Students in Class A. (n=56) Frequency (%) Pretest Posttest 12 week follow-up. p value*. I.Where a stroke occurs-brain. 46(82). 56(100). 55(98). 0.47. II Risk factors Cardiopathy Cigarette smoking Hypertension High blood cholesterol level Obesity. 32(57) 19(34) 54(96) 56(100) 52(93). 53(95) 56(100) 56(100) 56(100) 51(91). 48(86) 49(88) 56(100) 55(98) 56(100). 0.39 0.40 0.25 0.13. 29(52) 40(71) 54(96). 54(96) 56(100) 56(100). 51(91) 53(95) 55(98). 0.15 0.10 0.75. 55(98). 56(100). 55(98). 0.42. 28(50) 20(36) 44(79) 42(75) 52(93). 55(98) 56(100) 55(98) 55(98) 56(100). 43(77) 48(86) 55(98) 54(96) 55(98). 0.27 0.94 0.07 0.75 0.45. Diabetes Age History of stroke III Warning signs Numbness or lack of feeling(on one side of the body) Headache Visual impairment Speech impairment Balance problems IV Behavioral intent to call 119. *p value was from comparison of mean score of pretest between male and female participants by χ2 test.. 22.
(30) Table 2.. Comparison of Mean Score by Gender for Class A. (n=56) Mean Score (Standard Deviation) Frequency. 12 weeks Pretest. Gender. Posttest. (%). follow-up. Male. 34(61). 15.0(1.98). 19.2(0.88). 17.5(1.44). Female. 22(39). 14.5(1.57). 19.1(1.17). 17.2(1.37). Total. 56(100). 14.8(1.83). 19.2(0.99). 17.4(1.41). 0.1563. 0.4003. 0.1840. p value*. *Student’s t test results of the equality of mean score between male and female participants.. 23.
(31) Mean Score. Comparison of Mean Score (Class A). male female. 20 19 18 17 16 15 14 13 12 11 10 9 8 pretest. Figure 2.. posttest. 12 week follow-up Evaluation. Comparison of Mean Score for Class A (tested by close-ended questionnaire). 24.
(32) Table 3.. Stroke Related Knowledge Named by Students in Class B. (n=53) Frequency (%) Pretest. Posttest. 12 week follow-up. p value*. I.Where a stroke occurs-brain. 42(80). 53(100). 52(98). 0.75. II Risk factors Cardiopathy Cigarette smoking Hypertension High blood cholesterol level Obesity. 13(25) 6(11) 27(51) 17(32) 14(26). 47(89) 49(92) 53(100) 46(87) 39(74). 37(70) 34(64) 43(81) 20(38) 34(64). 0.47 0.09 0.47 0.55 0.38. Diabetes Age History of stroke. 7(13) 6(11) 2(4). 51(96) 40(74) 46(87). 27(51) 22(42) 21(40). 0.57 0.16 0.44. Weather Family history Genetic Mood Improper diet Body inactivity Stress Alcohol. 3(6) 1(2) 4(8) 5(9) 26(49) 8(15) 4(8) 13(25). 0(0) 1(2) 0(0) 0(0) 17(32) 2(4) 0(0) 1(2). 2(4) 2(4) 7(13) 0(0) 18(34) 6(11) 5(9) 20(38). 0.34 0.06 0.26 0.88 0.94 0.86 0.91 0.12. 21(40). 45(85). 41(77). 0.87. 15(28) 3(6). 51(96) 53(100). 27(51) 39(74). 0.24 0.65. 6(11) 8(15) 4(8) 48(91) 2(4). 49(92) 49(92) 0(0) 53(100) 0(0). 44(83) 31(58) 1(2) 53(100) 0(0). 0.71 0.86 0.26 0.88 0.35. III Warning signs Numbness or a lack of feeling(on one side of the body) Headache Visual impairment Speech impairment Balance problems Coma IV Behavioral intent to call 119 Bloodletting. *p value was from comparison of mean score of pretest between male and female participants by χ2 test.. 25.
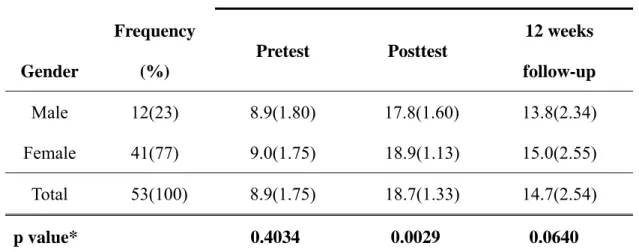
(33) Table 4 Comparison of Mean Score by Gender for class B. (n=53) Mean Score (Standard Deviation) Frequency. 12 weeks Pretest. Posttest. Gender. (%). Male. 12(23). 8.9(1.80). 17.8(1.60). 13.8(2.34). Female. 41(77). 9.0(1.75). 18.9(1.13). 15.0(2.55). Total. 53(100). 8.9(1.75). 18.7(1.33). 14.7(2.54). p value*. follow-up. 0.4034. 0.0029. 0.0640. *Student’s t test results of the equality of mean score between male and female participants.. 26.
(34) Mean Score. Comparison of Mean Score (Class B). 20 19 18 17 16 15 14 13 12 11 10 9 8 pretest. Figure 3.. posttest. 27. female. 12 week follow-up Evaluation. Comparison of Mean Score for Class B (tested by open-ended questionnaire). male.
(35) Appendix 1.. Slides of the Stroke Prevention Educational Program. 何謂中風? • What? • 中風是一種腦血管疾病,對腦實質 (brain parenchyma)造成傷害 • 當腦部血流下降至一個程度,會造成腦神經 功能的喪失,出現身體各種功能的不正常 • 缺血性腦中風(腦梗塞),血管粥狀硬化 • 出血性腦中風. 中風 黃麗蓮 email: [email protected] 1. 2. 腦中風的警訊症狀(前兆) • • • • • •. 腦中風警訊症狀(前兆)的處理. What? 突然單邊身體麻或沒力氣或沒感覺或不能動 突然走路不穩或平衡變差 突發的困惑或說話困難 突然視力模糊 突然不明原因的嚴重頭痛. How? 馬上打119或送醫院急診 Why? 儘速就醫,發病三小時內施打 IV rtPA. • • • •. 3. 4. 預防腦中風. 腦中風的危險因子 • • • • • • • • •. What? 高血壓 高膽固醇 抽菸 糖尿病 心臟病 肥胖 年齡大 曾發生過中風 5. • • • • • • •. How? 不抽菸 每週運動三次(含)以上 每日食用五份以上蔬果 18.5≦BMI<24 治療高血壓、高膽固醇與糖尿病 中風前兆,儘速就醫,發病三小時內施打 IV rtPA. • • • • •. 身體質量指數(Body Mass Index) BMI = 體重(公斤) / 身高2(公尺2) 體重過輕(BMI<18.5) 過重(24≤BMI<27) 肥胖(BMI ≥ 27) 6. 28.
(36) Appendix 2.. Close-ended Questionnaire for Class A. (Pretest). □□大學 96 學年度第 1 學期 科目:認識常見疾病 課堂測驗 2007/10/17 教師: 學號: 學生姓名:. 班級:. 以下題目是想知道妳/你在中風課程前,對中風的認識程度,請妳/你依照自 己的想法回答。 一、請問中風是人體的那一個部位發生病變所引起的(單選)? 答:□1.心臟 □2.手腳 □3.腦 □4.脊椎 □5.以上皆非 二、請問中風的危險因子(可複選)? 答:□1.心臟病 □2.常抽煙 □3.高血壓 □4.高血脂或高膽固醇 □5.肥胖 □6.糖尿病 □7.近視 □8.肝病 □9.年齡大 □10.曾發生過中風 □11.以上皆非 三、請妳/你列出中風的警訊症狀(可複選)? 答:□1.突然單邊身體麻或沒力氣或沒感覺或不能動 □2.呼吸短促 □3.突然不明原因的嚴重頭痛 □4.突然視力模糊 □5.抽筋 □6.突然說話困難 □7.走路不穩或平衡變差 □8.後頸僵硬 □9.以上皆非 四、當妳/你發現家人或朋友可能中風了,應該如何處理(單選)? 答:□1.先休息一下,再看看怎麼樣 □2.馬上打 119 或送醫院急診 □3.找家人或朋友商量 □4.以上皆非 五、請問妳/你過去曾接觸任何關於中風的資訊嗎? 答:□1.有 □2.無 六、請問妳/你的性別? 答:□1.男 □2.女 七、請問妳/你是民國那一年出生? 答:民國____年出生. 29.
(37) Appendix 3.. Open-ended Questionnaire for Class B. (Pretest). □□大學 96 學年度第 1 學期 科目:認識常見疾病 課堂測驗 2007/10/17 教師: 學號: 學生姓名:. 班級:. 以下題目是想知道妳/你在中風課程前,對中風的認識程度,請妳/你依照自己的 想法回答。 一、請問中風是人體的那一個部位發生病變所引起的? 答: 二、請妳/你列出中風的危險因子? 答:. 三、請妳/你列出中風的警訊症狀? 答:. 四、當妳/你發現家人或朋友可能中風了,應該如何處理? 答:. 五、請問妳/你過去曾接觸任何關於中風的資訊嗎? 答:□1.有 □2.無 六、請問妳/你的性別? 答:□1.男 □2.女 七、請問妳/你是民國那一年出生? 答:民國____年出生. 30.
(38) Appendix 4.. Close-ended Questionnaire for Class A. (Posttest and 12 week. follow-up) □□大學 96 學年度第 1 學期 科目:認識常見疾病 課堂測驗 2008/1/9 教師: 學號: 學生姓名:. 班級:. 以下題目是想知道妳/你在中風課程後,對中風的認識程度,請妳/你依照自己的 想法回答。 一、請問中風是人體的那一個部位發生病變所引起的(單選)? 答:□1.心臟 □2.手腳 □3.腦 □4.脊椎 □5.以上皆非 二、請問中風的危險因子(可複選)? 答:□1.心臟病 □2.常抽煙 □3.高血壓 □4.高血脂或高膽固醇 □5.肥胖 □6.糖尿病 □7.近視 □8.肝病 □9.年齡大 □10.曾發生過中風 □11.以上皆非 三、請妳/你列出中風的警訊症狀(可複選)? 答:□1.突然單邊身體麻或沒力氣或沒感覺或不能動 □2.呼吸短促 □3.突然不明原因的嚴重頭痛 □4.突然視力模糊 □5.抽筋 □6.突然說話困難 □7.走路不穩或平衡變差 □8.後頸僵硬 □9.以上皆非 四、當妳/你發現家人或朋友可能中風了,應該如何處理(單選)? 答:□1.先休息一下,再看看怎麼樣 □2.馬上打 119 或送醫院急診 □3.找家人或朋友商量 □4.以上皆非 五、請問妳/你的性別? 答:□1.男 □2.女 六、請問妳/你是民國那一年出生? 答:民國____年出生. 31.
(39) Appendix 5.. Open-ended Questionnaire for Class B. (Posttest and 12 week. follow-up) □□大學 96 學年度第 1 學期 科目:認識常見疾病 課堂測驗 2008/1/9 教師: 學號: 學生姓名:. 班級:. 以下題目是想知道妳/你在中風課程後,對中風的認識程度,請妳/你依照自己的 想法回答。 一、請問中風是人體的那一個部位發生病變所引起的? 答: 二、請妳/你列出中風的危險因子? 答:. 三、請妳/你列出中風的警訊症狀? 答:. 四、當妳/你發現家人或朋友可能中風了,應該如何處理? 答:. 五、請問妳/你的性別? 答:□1.男 □2.女 六、請問妳/你是民國那一年出生? 答:民國____年出生. 32.
(40)
數據

+4
Outline
相關文件
Effectiveness of robot-assisted upper limb training on spasticity, function and muscle activity in chronic stroke patients treated with botulinum toxin: A randomized single-
能預防天然災害(如颱風、水 災…等)對調理場所所發生 的影響及發生災害狀況的緊
MR CLEAN: A Randomized Trial of Intra-arterial Treatment for Acute Ischemic Stroke. • Multicenter Randomized Clinical trial of Endovascular treatment for Acute ischemic stroke in
understanding of what students know, understand, and can do with their knowledge as a result of their educational experiences; the process culminates when assessment results are
220V 50 Hz single phase A.C., variable stroke control, electrical components and cabling conformed to the latest B.S.S., earthing through 3 core supply cable.. and 2,300 r.p.m.,
Sexual Abuse of Children with Autism: Factors that Increase Risk and Interfere with Recognition of Abuse.... ASD –
認為它注重對四大師的研究而忽視支援這些大師布教活動的庶民之信仰的研 究。[13]
When risk factors are high and protective factors are low, proximal risk factors. (or stressors) can interact with a person’s long term or underlying
