行政院國家科學委員會專題研究計畫 成果報告
溫度對鈦與氧化鋯擴散偶介面微觀結構演化的效應
計畫類別: 個別型計畫 計畫編號: NSC94-2216-E-009-011- 執行期間: 94 年 08 月 01 日至 95 年 07 月 31 日 執行單位: 國立交通大學材料科學與工程學系(所) 計畫主持人: 林健正 計畫參與人員: 林昆霖 報告類型: 精簡報告 處理方式: 本計畫可公開查詢中 華 民 國 95 年 6 月 30 日
行政院國家科學委員會補助專題研究計畫 ■ 成 果 報 告 □期中進度報告 溫度對鈦與氧化鋯擴散偶介面微觀結構演化的效應 計畫類別:■ 個別型計畫 □ 整合型計畫 計畫編號:NSC 94-2216-E-009-011 執行期間:2005 年 8 月 1 日至 2006 年 7 月 31 日 計畫主持人:林健正 共同主持人: 計畫參與人員: 成果報告類型(依經費核定清單規定繳交):■精簡報告 □完整報告 本成果報告包括以下應繳交之附件: □赴國外出差或研習心得報告一份 □赴大陸地區出差或研習心得報告一份 □出席國際學術會議心得報告及發表之論文各一份 □國際合作研究計畫國外研究報告書一份 處理方式:除產學合作研究計畫、提升產業技術及人才培育研究計畫、列管計畫及下列情 形者外,得立即公開查詢 □涉及專利或其他智慧財產權,□一年□二年後可公開查詢 執行單位: 中 華 民 國 年 月 日
中文摘要:
本實驗將分析鈦金屬與氧化鋯擴散偶之介面微觀分析研究,將試片分別熱處理於1100°C 到
1550°C,持溫 6 小時且以氬氣當保護氣氛。將進一步利用掃瞄式電子顯微鏡(SEM)及穿 透式電子顯微鏡(TEM)分析介面微觀結構,當中兩者皆搭配成份分析裝置(EDS)。鈦金
屬與氧化鋯經熱處理於1100°C 的條件下,介面反應並不顯著。β'-Ti(Zr, O)反應層及 α-Ti(O)
+ β'-Ti(Zr, O)兩相反應層分別被發現且存在於熱處理條件當為溫度大於 1300ºC 及溫度大於 1400ºC 的條件下。Ti2ZrO + α-Ti(O, Zr) + β'-Ti (O, Zr) 三相反應層被發現存在於 1550°C 的
條件下。溫度大於1300ºC 時,β'-Ti 與 c-ZrO2-x共同存在於靠近介面的陶瓷側,同時其中的
c-ZrO2-x固溶較多的 Y2O3。在遠離介面的氧化鋯側,溫度大於 1300ºC 時,α-Zr 在不穩定
的氧化鋯晶界生成。溫度是1300ºC 時,非常小且緻密分佈的 α-Zr 出現;在 1400ºC 時,α-Zr
沿著氧化鋯晶界變成連續的型態;在1550ºC 時,α-Zr 粗化且在氧化鋯晶界處。氧化鋯晶粒
成長顯著發生在溫度大於 1400ºC 條件下且 lenticular t-ZrO2-x 從 c-ZrO2-x.中析出。最後,
鈦金屬與氧化鋯經不同溫度熱處理條件下的介面微觀結構的演化及擴散路徑將利用 Ti-Zr-O 三元相圖進一步討論。
關鍵詞:鈦金屬、氧化鋯、擴散偶及TEM
英文摘要:
Abstract
The interfacial reaction layers in the Ti/ZrO2 diffusion couples, isothermally annealed in argon at
temperatures between 1100° and 1550°C for 6 hours, were characterized using scanning electron microscopy (SEM) and transmission electron microscopy (TEM), both attached with an energy-dispersive spectrometer (EDS). Very limited reaction occurred between Ti and ZrO2 at
1100°C. A β'-Ti(Zr, O) layer and a two-phase α-Ti(O) + β'-Ti(Zr, O) layer were found in the titanium side after annealing at T≥ 1300ºC and T≥ 1400ºC, respectively. A three-phase layer, consisting of Ti2ZrO + α-Ti(O, Zr) + β'-Ti (O, Zr), was formed after annealing at 1550°C. In the
zirconia side near the original interface, β'-Ti coexisted with fine spherical c-ZrO2-x, which
dissolved a significant amount of Y2O3 in solid solution at T≥ 1300ºC. Further into the ceramic
side, the α-Zr was formed due to the exsolution of Zr out of the metastable ZrO2-x after annealing
at T≥ 1300ºC: the α-Zr was very fine and dense at 1300ºC, continuously distributed along grain boundaries at 1400ºC, and became coarsened at 1550ºC. The zirconia grains grew significantly at T≥ 1400ºC with the lenticular t-ZrO2-x being precipitated in c-ZrO2-x. Finally, the
microstructural development and diffusion paths in the Ti/ZrO2 diffusion couples annealed at
various temperatures were also described by the aid of the Ti-Zr-O ternary phase diagram. Keywords: titanium, zirconia, diffusion couple, and TEM
報告內容:
I. Introduction
The interfacial reactions between titanium and zirconia have been studied in the past several decades.1-3 It is generally accepted that the oxygen of zirconia is readily dissolved into the titanium to form α-Ti(O), resulting in the blackening of oxygen deficient zirconia (ZrO2-x).
Various reaction layers in the interface between titanium and zirconia were found,4-5 however, they were not fully explored because of the limitations of the analytical instruments. Meanwhile, some researchers6-7 indicated that the titanium additive could improve the mechanical properties of zirconia including strength and thermal shock resistance.
Recently, Lin and his coworkers8-13 have thoroughly investigated the diffusional reactions between titanium (or titanium alloys) and zirconia. Using TEM/EDS analyses, they indicated that the ordered titanium suboxide (Ti3O) and the orthorhombic lamellae Ti2ZrO were formed in
the solid solution of α-Ti(O) between zirconia and titanium melt during cooling from 1700°C.9 In addition, the orthorhombic β'-Ti(Zr, O) and an spherical ordered Ti2ZrO phase were also found
in the metal side of the Ti/ZrO2 diffusion couple after annealing at 1550°C.11 The orientation
relations between α-Ti (Zr, O) and lamellae Ti2ZrO were determined to be [0001]α-Ti // [110]Ti2ZrO
and (10 1 0)α-Ti // (1 1 0)Ti2ZrO; meanwhile those between α-Ti(O) and spherical ordered Ti2ZrO
were [0001] α-Ti // [0001]Ti2ZrO and (10 1 0)α-Ti // (10 1 0)Ti2ZrO.11 Furthermore, the acicular α-Ti(O)
was precipitated in the β'-Ti(O, Zr) matrix with two various orientation relations in the metal side.13 One was determined to be [2 1 1 0]α-Ti // [001]β'-Ti and (0001)α-Ti // (100)β'-Ti and the other
[2 1 1 0]α-Ti // [021]β'-Ti and (0001)α-Ti // (1 1 2)β'-Ti.13 In the zirconia side far away from the
interface of Ti/ZrO2, Lin and Lin12 also observed twinned t'-ZrO2-x, lenticular t-ZrO2-x, and/or
ordered c-ZrO2-x as well as the intergranular α-Zr after annealing at 1550oC.
Even though extensive studies were carried out on the interface reactions between titanium and zirconia, the temperature effects on the microstructure evolution have not been elucidated to date. In order to shed light on the temperature effects on the microstructural evolution of the various distinct reaction layers between titanium and zirconia, the Ti/ZrO2 diffusion couples were
isothermally annealed in argon at 1100°, 1300°, 1400°, and 1550°C, respectively, for 6 hours in the present study. Various microstructures were characterized using scanning electron microscopy (SEM) and transmission electron microscopy (TEM), both attached with an energy dispersive spectrometer (EDS). Through the comparison among various microstructures, an attempt was made to propose the microstructural development of the reaction layers between titanium and zirconia at various annealing temperatures, while diffusion paths were depicted in the Ti-Zr-O ternary phase diagram.
II. Experimental Procedures
(1) Sample Preparation
Bulk ZrO2 specimens were prepared from the powder of 3 mol% Y2O3 partially stabilized
zirconia by the hot-press (Model HP50-MTG-7010, Thermal Technology Inc., Santa Rosa, CA). The nominal composition of the zirconia powder was supplied by the vendor (Toyo Soda Mfg. Co., Tokyo, Japan) as follows: > 94 wt% ZrO2 + HfO2 (accounting for approximately 2~3% of
this total), 5.4 wt% Y2O3, < 0.001 wt% Fe2O3, < 0.01 wt% SiO2, < 0.005 wt% Na2O, < 0.005
wt% TiO2, < 0.02 wt% Cl, < 0.005 wt% SO42-. Both as hot-pressed ZrO2 specimens and
commercially available titanium billets (with a nominal composition of 99.31 wt% Ti, 0.25 wt% O, 0.01 wt% H, 0.03 wt% N, 0.10 wt% C, 0.30 wt% Fe; Kobe Steel, Ltd., Tokyo, Japan) were cut and machined to the dimensions of 14 mm x 14 mm x 5 mm. One Ti billet was inserted in between two ZrO2 specimens to form a sandwiched sample, which was then slightly pressed and
annealed at 1100°, 1300°, 1400°, and 1550°C, respectively, for 6 hour at an atmospheric argon. The hot-pressing procedures of both bulk ZrO2 and the sandwiched samples have been described
(2) SEM/EDS analyses
An SEM (Model JSM-6330F, JEOL Ltd., Tokyo, Japan) equipped with an energy-dispersive spectrometer (EDS, Mode ISIS300, Oxford Instrument Inc., London, UK) was used for the microstructural observation on the interface between titanium and zirconia. Both backscattering electron image (BEI) and secondary electron image (SEI) were acquired. Cross-sectional specimens were cut into about 3 mm x 2 mm x 1 mm, and then ground and polished using diamond paste down to 1 µm. The specimens for the SEI observation were etched by the Kroll reagent (10 ml HF + 30 ml HNO3 + 60 ml H2O) for 15 seconds. In order to avoid electric
charging under the electron beam, specimens were coated with a thin layer of platinum.
(3) TEM/EDS analyses
A TEM (Model JEM 2000Fx, JEOL Ltd., Tokyo, Japan) equipped with an energy-dispersive spectrometer (EDS, Mode ISIS300, Oxford Instrument Inc., London, UK) was also employed for characterizing the interfacial microstructure between titanium and zirconia. Cross-sectional TEM specimens perpendicular to the interface of titanium and zirconia were cut, ground, and polished by standard procedures as mentioned previously.11 The TEM specimens were dimpled and ion milled by a precision ion miller (Model 691, Gatan Inc., Pleasanton, CA). The quantitative composition analyses were carried out based on the principle of the Cliff-Lorimer standardless technique.14
III. Results and Discussion
(1) Distinct microstructures at various temperatures
The microstructure of the Ti/ZrO2 interface strongly depended on the annealing temperature.
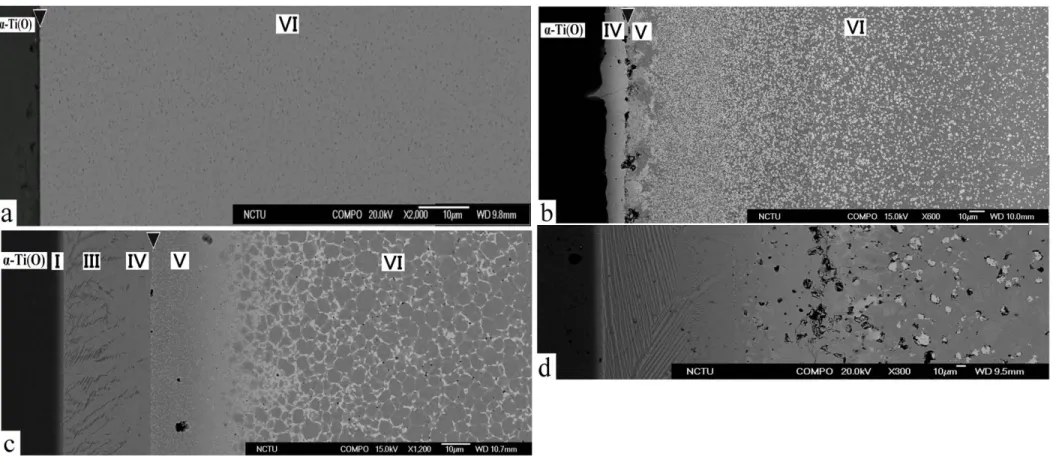
Figures 1(a)-(d) display the backscattered electron images (BEI) of the cross-section normal to the Ti/ZrO2 interface after annealing at 1100°, 1300°, 1400°, and 1550°C for 6 hours,
respectively. Titanium was in the left-hand side, while zirconia was in the other side. The vertical arrows in the upper side of individual figures indicate the original interfaces of Ti and ZrO2. The original interfaces were deliberately located by the results of characteristic Kα x-ray
maps of yttrium (not shown) which was relatively immobile compared with elements Zr, O, and Ti.
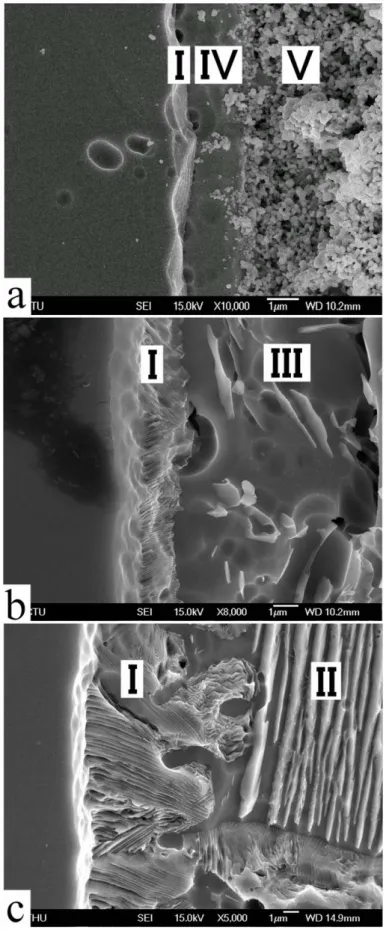
(A) The Reaction Layer “I” of the Ti/ZrO2 interface
A gray thin layer (designated as the reaction layer “I”) was formed in the interface between Ti and ZrO2 at temperatures T≥ 1400oC as shown in Fig. 1(c) and (d). The reaction layers “I” in
Fig. 1(a) and (b) were invisible because of the limited resolution, however, they could be observed using SEM or TEM at a higher magnification [Fig. 2(a) and Fig. 3]. To the left of the reaction layer “I” is the α-Ti with oxygen in solid solution, designated as α-Ti(O) in this study. Figure 2 displays the secondary electron images (SEI) of the lamellar α-Ti (Zr, O) and Ti2ZrO in
the reaction layer “I” etched by Kroll reagent (10 ml HF + 30 ml HNO3 + 60 ml H2O) after
annealing at 1300°, 1400°, and 1550°C, respectively. The thickness of the reaction layer “I” increased with temperature. Figure 2 shows clearly, at a higher magnification, the very different microstructures developed at various anneal temperatures. For example, the sequence of the reaction layers I + IV + …[Fig. 2(a)] was formed after annealing at 1300°C, while the sequence of the reaction layers I + III + … [Fig. 2(b)] and the sequence of the reaction layers I + II +… [Fig. 2(c)] are formed after annealing at 1400° and 1550°C, respectively.
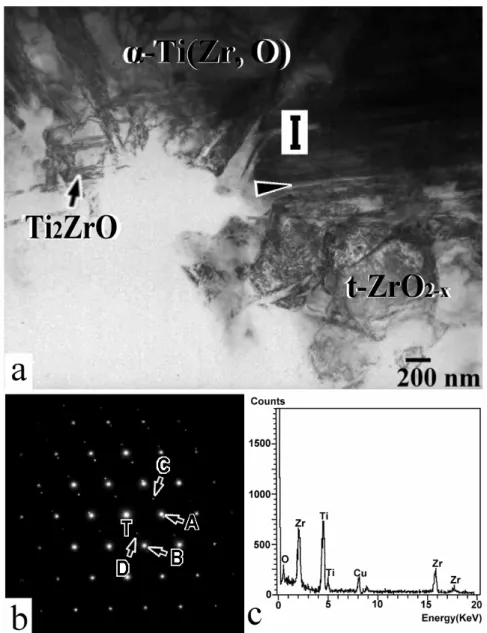
For the benefit of good resolution of TEM, a very thin reaction layer “I” was found in the Ti/ZrO2 interface after annealing at 1100°C for 6 h. Figure 3(a) displays the TEM micrograph
of the cross-section between Ti and ZrO2 after annealing at 1100oC for 6 h. The arrow indicates
the original interface with titanium and zirconia being in the upper and lower sides, respectively. Their morphologies were very different from those results in previous studies after annealing at 1550º or 1700ºC.9, 11 The SADPs as shown in Fig. 3(b) indicates that the lamellar phases were
composed of orthorhombic Ti2ZrO and hexagonal disordered α-Ti(Zr, O). The orientation
relationship of Ti2ZrO and α-Ti(Zr, O) can be expressed as follows: [0001]α-Ti // [110]Ti2ZrO and
(10 1 0)α-Ti // (1 1 0)Ti2ZrO . Figure 3(c) displays the EDS of Ti2ZrO, consisting of 56.1 at% Ti,
22.9 at% Zr, and 21.0 at% O.
(B) The Reaction Layer “II” of the Ti/ZrO2 interface
The lamellar α-Ti(Zr, O) and Ti2ZrO along with β'-Ti(Zr, O) (designated as the reaction layer
“II”), as indicated previously,11 were observed in the Ti/ZrO2 interface after annealing at
1550oC/6 h [Fig. 1(d)]. In contrast, no such a lamellar was found in the samples after annealing between 1100º and 1400ºC.
(C) The Reaction Layer “III” of the Ti/ZrO2 interface
The two-phase acicular α-Ti(Zr, O) + β'-Ti(Zr, O) layers (designated as the reaction layer “III”) after annealing at 1400o and 1550oC are shown in Fig. 1(c) and (d), respectively. The reaction layer “III” appeared as a relatively minor layer at 1550°C compared with the reaction layer “II,” as shown in Fig. 1(d). At a higher magnification, it was seen that the amount of acicular α-Ti(Zr, O) gradually decreased towards the original interface.13 Lin and Lin13 indicated that
the acicular α-Ti was precipitated from β'-Ti matrix by means of the ledge mechanism. In contrast, the reaction layer “III” was not found after annealing at 1100° or 1300°C.
(D) The Reaction Layer “IV” of the Ti/ZrO2 interface
The region to the nearest left of the original interface dissolved a higher concentration of Zr in Ti. No acicular α-Ti(Zr, O) was thus observed in this region since the zirconium was an effective stabilizer of β-Ti. Figures 1(b), (c) and (d) show that a continuous β'-Ti(Zr, O) layer (designated as the reaction layer “IV”) was formed in the metal side abutting the original interface after annealing at temperatures ranging from 1300o to 1550°C. No reaction layer “IV” was observed after annealing at 1100°C since the reaction was quite limited.
(E) The Reaction Layer “V” of the Ti/ZrO2 interface
Figure 1 also demonstrates very distinct microstructures in the ceramic side after annealing at various temperatures. At 1100°C, the anneal temperature was so low that no apparent interfacial reaction was noticeable. At T≥ 1300°C, zirconia was gradually dissolved in titanium so that residual fine spherical c-ZrO2 existed in the matrix of β'-Ti(Zr, O). The spherical
zirconia contained a significant amount of Y2O3, resulting in the stabilization of c-ZrO2-x
(designated as the reaction layer “V”) as shown particularly in Fig. 1(c) and (d). It is believed that, at high temperatures such as 1400° or 1550°C, the chemical reaction enhanced dissolution of ZrO2 into Ti is an important mechanism that dominates in the reaction layer “V.”
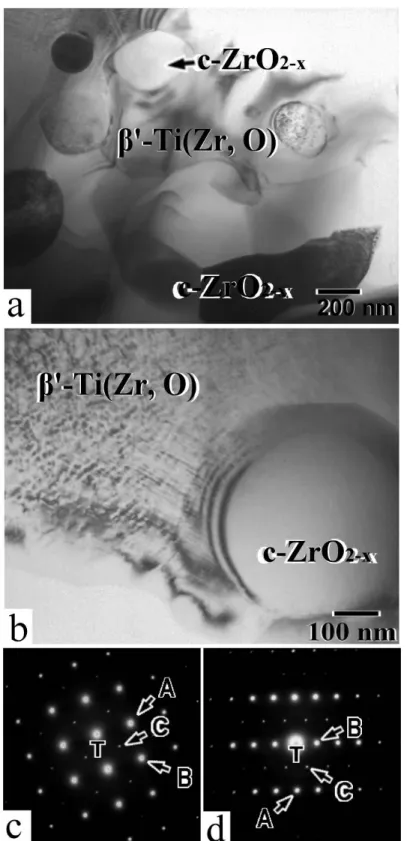
Figure 4(a) shows the bright field image (BFI) of the reaction layer “V” after annealing at 1400oC for 6 h. The reaction layer “V,” in the outermost region of the original zirconia, consisted of β'-Ti(Zr, O) and c-ZrO2-x. In this layer, zirconia was dissolved into titanium and
became rounded in shape, resulting in β-Ti with oxygen and zirconium in solid solution. Since the solubility of yttrium (or the stabilizer of ZrO2 in the present study) in titanium was quite
limited, yttrium was retained in the residual cubic zirconia. It is consistent with the results reported by Zhu et al.,5 who found that yttrium element congregated and remained at the interface to form a high-Y2O3 content of ZrO2, when ZrO2 reacted with molten titanium. After
annealing at 1550°C for 6 h, the β'-Ti(Zr, O) in the reaction layer “V” became an ordered phase during cooling. In Fig. 4(b), the ordered β'-Ti(Zr, O) phase displayed a high strain-field contrast because of the lattice distortion. Figures 4(c) and (d) show the SADPs of β'-Ti(Zr, O) with the incident electron beam along the zone axes of [021] and [ 1 12], respectively. The ordered structure was characterized by the { 1 1 1 } superlattice reflections of β'-Ti(Zr, O). In contrast, the β'-Ti(Zr, O) phase in the layer "V", formed after annealing at 1400°C, did not experienced the order-disorder phase transformation.
(F) The Reaction Layer “VI” of the Ti/ZrO2 interface
At high temperatures, the oxidation-reduction reaction resulted in the formation of metastable oxygen deficient zirconia (ZrO2-x). Then α-Zr would be excluded from this metastable ZrO2-x
onto the grain boundaries of zirconia during the subsequent cooling. In the layer “VI” as shown in Fig. 1(b)-(d), the α-Zr coexisted with tetragonal and/or cubic zirconia. At 1300oC, the negligible grain growth of zirconia resulted in the very fine and dense α-Zr as shown in Fig. 1(b). For the sample after annealing at 1400oC, zirconia grains were delineated by the continuously
distributed intergranular α-Zr [Fig. 1(c)], indicating a significant degree of grain growth. In addition to the apparent grain growth of zirconia, the intergranular α-Zr was coarsened and became isolated, as shown in Fig. 1(d), after annealing at 1550oC.
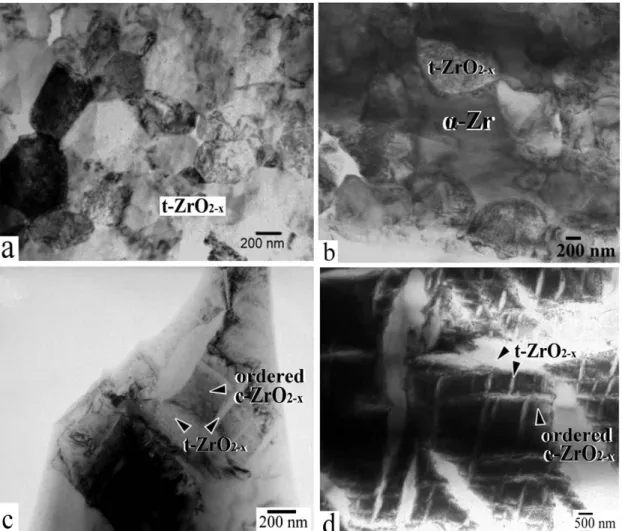
In the reaction layer “VI,” the oxidation-reduction reaction rather than dissolution is the predominant mechanism in the reaction layer “VI.” The dissolution played an insignificant role toward the formation of the reaction layer “VI” since titanium was not detected by EDS in this layer. Figures 5(a)-(d) show the bright field images (BFI) of the reaction layer “VI” after annealing at 1100°, 1300°, 1400°, 1550°C for 6 h, respectively. After annealing at 1100°C/6 h, the limited reaction resulted in t-ZrO2-x, as it was in as hot-pressed samples, with no intergranular
α-Zr and insignificant grain growth of zirconia [Fig. 5(a)]. At 1300°C/6 h, the t-ZrO2-x
remained with a slight grain growth (grain size about 1~ 2 µm), while the dense fine α-Zr was formed by the exsolution of Zr from the metastable t-ZrO2-x [Fig. 5(b)]. After annealing at
1400° or 1550°C, it was found that the lenticular t-ZrO2-x with two variants precipitated in the
ordered c-ZrO2-x [Fig. 5(c) and (d)], which was stabilized by the extensive oxygen vacancies.
The ordered c-ZrO2-x was recognized by the 1/5{113} superlattice reflections. The grain sizes
of zirconia after annealing at 1400º and 1550ºC were about 8-10 µm and 20-30 µm, respectively, indicating rapid grain growth on annealing.
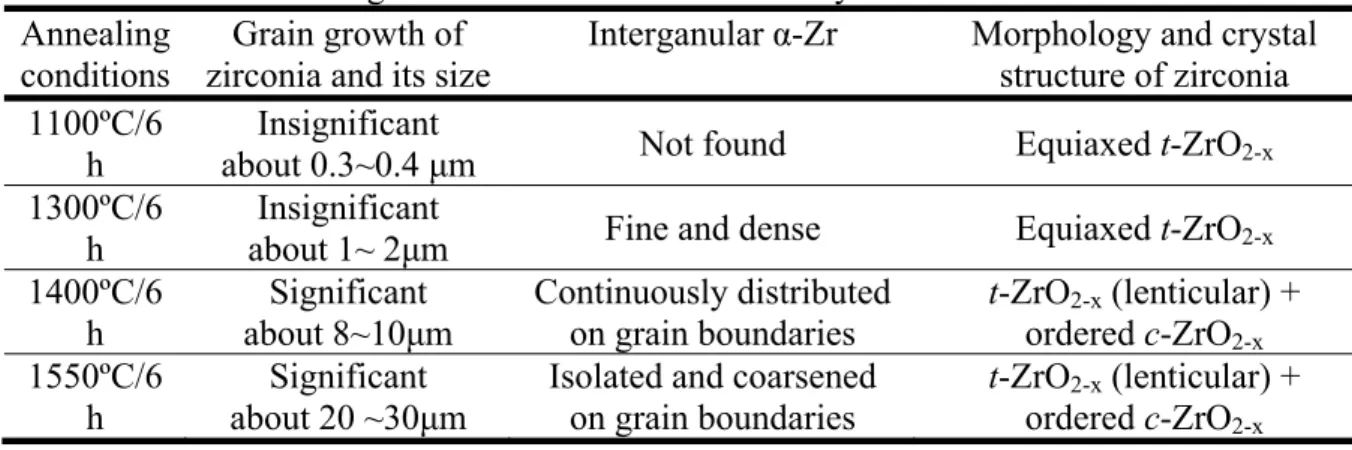
The microstructures of the reaction layer “VI” strongly depend upon annealing temperature in the following respects: (1) the grain growth of zirconia; (2) the exsolution of α-Zr onto the grain boundaries of zirconia; (3) the morphologies and crystal structures of zirconia. The microstructural features of the reaction layer “VI” are summarized in Table I.
It is also note that a large amount of the pores existed in the ceramic side after annealing at T≥ 1300°C. The formation of these pores was attributed to the Kirkendall effect, because zirconium and oxygen diffused to the titanium side much faster than titanium did toward the zirconia side in the opposite direction.
(G) Formation of the Ti3O suboxide in α-Ti(O)
In contrast to a limited diffusion range of zirconium (up to the reaction layer “I”), oxygen showed a relatively long diffusion range (well beyond the reaction layer “I”). Rather than forming a distinct layer with a specific thickness, the oxygen concentration of α-Ti(O) decayed gradually across a wide region. During cooling, the hexagonal phases of ordered titanium suboxides such as Ti2O, Ti3O, and possibly Ti6O might be formed within an extended range, as
shown in the Ti-O phase diagram.15 In this study, only the ordered Ti3O resulted from the
transformation of α-Ti(O) during cooling because of the extended reaction between titanium and zirconia at 1400º or 1550ºC. However, no such a suboxide was found in those samples annealed at 1100° or 1300ºC.
Figure 6 shows Ti3O contained stacking faults and dislocations in α-Ti(O) abutting the reaction
layer “I” after annealing at 1550°C for 6 h. Inset in the upper right corner was the SADP of the hexagonal Ti3O with the electron beam parallel to the zone axis of [1 2 10]. The superlattice
reflections (0002), (1011), and (2021) indicated the cell dimension along the c axis of the superlattice should be twice of the Ti cell, but not three times as proposed by Jostsons and
Malin16 and Lin and Lin.9 The ordered structure of Ti3O observed in this study coincided with
the model proposed by Holmberg17 and Yamaguchi.18 It revealed that the lattice parameters of Ti3O were a = 3 ao and c = 2co, where ao and co were those of the Ti unit cell.
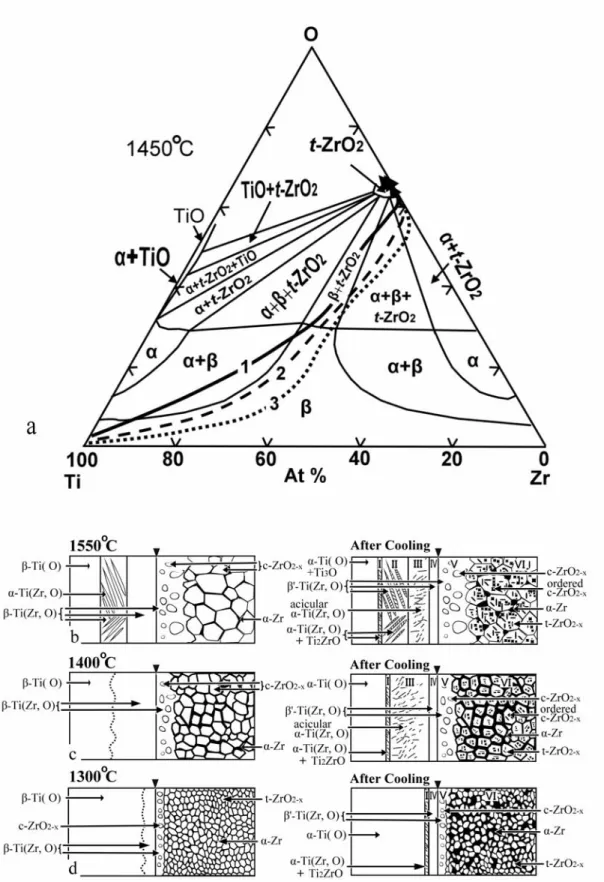
(2) Temperature effect on microstructural development
The microstructural development between titanium and zirconia can be explained by the isothermal Ti-Zr-O ternary phase diagram at 1450ºC, as shown in Fig. 7, because the compositions of the solid phases are approximately constant between 1300° and 1550°C.19 The dot, dash, and solid lines (marked as “1,” “2,” and “3,” respectively) in Fig. 7(a) are the diffusion paths, which connect all gross compositions at various cross sections along the longitudinal direction perpendicular to the interface, of Ti/ZrO2 on annealing at 1300°, 1400°, and 1550°C,
respectively.
The diffusion path at 1300ºC (dot line) crosses the fields of β-Ti, β-Ti + t-ZrO2, α-Zr + β-Ti +
t-ZrO2, and α-Zr + t-ZrO2. It is noted that the region of α-Zr + β-Ti + t-ZrO2 in the Ti-Zr-O
ternary phase diagram corresponds to the interface between the layers of β-Ti + t-ZrO2 and α-Zr
+ t-ZrO2. The reaction layers of β-Ti, β-Ti + t-ZrO2, and α-Zr + t -ZrO2 are in sequence from Ti
to ZrO2 in the Ti/ZrO2 diffusion couple on annealing at 1300°C, as shown in the left of Fig. 7(b).
The final microstructure after cooling from 1300ºC was schematically shown in the right of Fig. 7(b).
The formation of β-Ti on annealing at 1300ºC as well as its transformation during cooling can be described as follows. On annealing at 1300ºC, O and Zr were dissolved into Ti, leading to the formation of β-Ti(Zr, O) in the titanium side. While O diffused deeply into Ti beyond the reaction layers I, resulting in a long range (up to several hundreds of micrometers) of α-Ti(O), very little Zr diffused into Ti beyond the reaction layer I. Since O diffused much faster than Zr in Ti, Zr tended to accumulate in the β-Ti(Zr, O) layer (up to several tens of micrometers), causing relatively rich Zr than O in the β-Ti(Zr, O) layer. On the other respect, O and Zr are the stabilizers of α and β phases, respectively. The β-Ti(Zr, O) with a high concentration (≈ 30 wt% in this study) of Zr remained as a distorted β phase (designated as β') during cooling, but transformed into α phase otherwise. In the fact that the β-Ti(Zr, O) layer was relatively rich with Zr at 1300ºC, as indicated by the diffusion path 3 in Fig. 7(a), the layer IV (β') rather than the layer III (α+β) was observed after cooling.
The reaction layer “III” exists in the interface after annealing at 1400ºC, but not at 1300ºC. The β-Ti(Zr, O) formed on annealing at 1400ºC had relatively rich O than that at 1550ºC, as compared with diffusion paths 2 and 3. Two cases took place to the β-Ti(Zr, O) during cooling from1400ºC: (1) the Zr concentration away from the original interface is low so that the acicular α phase was precipitated along with β' (layer III); (2) the Zr concentration close to the original interface is high enough that the β phase was stabilized and the phase transformation of β → β' occurred (layer IV).
The zirconia in the Ti-Zr-O ternary phase diagram, shown in Fig. 7(a), would be in the cubic phase instead of tetragonal phase when the Ti/ZrO2 diffusion couple was isothermally annealed
at temperatures above 1400°C, because of the existence of yttria. In the ceramic side, t-ZrO2-x,
ordered c-ZrO2-x, and intergranular α-Zr existed in the reaction layer “VI” after annealing at
1400ºC. The microstructures developed on annealing at 1400ºC and after subsequent cooling were schematically shown in Fig. 7(c).
Figure 7(a) reveals that the solid line or the diffusion path at 1550ºC crosses the fields of β-Ti, α-Ti + β-Ti, β-Ti, β-Ti + c-ZrO2, α-Zr + β-Ti + c-ZrO2, and α-Zr + c-ZrO2. The reaction layers
of β-Ti, α-Ti + β-Ti, β-Ti, β-Ti + c-ZrO2, and α-Zr + c -ZrO2 would be observed in the Ti-ZrO2
various diffusion paths, it is worth noting that the two-phase α-Ti(Zr, O) + β-Ti(Zr, O) region, where the diffusion path passes through, is found neither at 1300° nor at 1400ºC. This region is corresponding to the reaction layer “II” in Fig. 1(d), consisting of β'-Ti and the lamellar Ti2ZrO +
α-Ti. The microstructural development on annealing at 1550ºC and after subsequent cooling was described previously11,13 and schematically shown in Fig. 7(d).
According to the foregoing discussion, the reaction layers formed in the interface of titanium and zirconia at various temperatures can be summarized in Table II. In brief, a very limited interfacial reaction took place at temperatures as low as 1100°C, merely leading to the formation of the α-Ti(O) and oxygen deficient zirconia t-ZrO2-x. In the titanium side, a thin α-Ti(O) +
Ti2ZrO layer (or layer I) existed after annealing at T≥ 1100ºC; the β'-Ti(Zr, O) layer (or layer IV)
was formed after annealing at T≥ 1300ºC; a two-phase α-Ti(O) + β'-Ti(Zr, O) layer (or layer III) was observed after annealing at T≥ 1400ºC; and a three-phase Ti2ZrO + α-Ti(O, Zr) + β'-Ti (O,
Zr) layer (or layer II) was found after annealing at 1550°C. In the zirconia side near the original interface (or layer V), β'-Ti coexisted with fine spherical c-ZrO2-x, which dissolved a significant
amount of Y2O3 in solid solution at T≥ 1300ºC. Further into the ceramic side (or layer VI), the
zirconia grains grew significantly with the lenticular t-ZrO2-x being precipitated in the c-ZrO2-x
matrix at T≥ 1400ºC. However, no cubic zirconia was found in the reaction layer “VI” after annealing at 1100º or 1300oC. The exsolution of Zr out of the metastable ZrO2-x led to the
formation of α-Zr, which was very fine and dense after annealing at 1300ºC, continuously distributed along grain boundaries at 1400ºC, and became coarsened at 1550ºC. It is also noted that the suboxide Ti3O was found in the α-Ti(O), to the left of the reaction layer “I,” after
annealing at 1400º and 1550ºC, while an ordered β'-Ti(Zr, O) phase existed in the reaction layer “V” after annealing at 1550ºC.
IV. Conclusions
1. The diffusional reactions between titanium and zirconia were carried out isothermally in argon at temperatures ranging from 1100° to 1550°C for 6 hours. It was found that the microstructure in the Ti/ZrO2 interface strongly depended on the annealing temperature.
2. In the titanium side, a thin α-Ti(O) + Ti2ZrO layer (or layer I) existed after annealing at T≥
1100ºC; the β'-Ti(Zr, O) layer (or layer IV) was formed after annealing at T≥ 1300ºC; a two-phase α-Ti(O) + β'-Ti(Zr, O) layer (or layer III) was observed after annealing at T≥ 1400ºC; and a three-phase Ti2ZrO + α-Ti(O, Zr) + β'-Ti (O, Zr) layer (or layer II) was found
after annealing at 1550°C.
3. In the zirconia side near the original interface, β'-Ti coexisted with fine spherical c-ZrO2-x,
which dissolved a significant amount of Y2O3 in solid solution at temperatures ranging from
1300º to 1550ºC, due to the reaction enhanced dissolution mechanism.
4. Further into the ceramic side, the zirconia grain grew significantly at 1400º and 1550ºC. α-Zr was excluded out of the metastable ZrO2-x after annealing T≥ 1300ºC: α-Zr was densely
distributed along with t-ZrO2-x at 1300ºC, continuously located at 1400ºC, and became
coarsened at 1550ºC. The lenticular t-ZrO2-x was precipitated in c-ZrO2-x after annealing at
1400° and 1550ºC, while the limited reaction resulted in t-ZrO2-x as it was in as-hot pressed
samples after annealing at 1100º or 1300°C.
5. Finally, the microstructural development in the Ti/ZrO2 annealed at various temperatures was
described by the aid of the Ti-Zr-O ternary phase diagram. Acknowledgments
The authors would like to pay their sincere appreciation to Mr. Chi-Ming Wen at Chung-Shan Institute of Science and Technology for preparing the hot-pressed specimens.
References:
1. G. Economos and W. D. Kingery, "Metal-Ceramic Interactions: II, Metal Oxide Interfacial Reactions at Elevated Temperatures," J. Am. Ceram. Soc., 36 [12] 403-9 (1953).
2. B. C. Weber, W. M. Thompson, H. O. Bielstein, and M. A. Schwartz, "Ceramic Crucible for Melting Titanium," J. Am. Ceram. Soc., 40 [11] 363-73 (1957).
3. R. Ruh, "Reaction of Zirconia and Titanium at Elevated Temperatures," J. Am. Ceram. Soc., 46 [7] 301-6 (1963).
4. R. Ruh, N. M. Tallan, and H. A. Lipsitt, "Effect of Metal Additions on the Microstructure of Zirconia," J. Am. Ceram. Soc., 47 [12] 632-5 (1964).
5. J. Zhu , A. Kamiya, T. Yamada, W. Shi, K. Naganuma, and K. Mukai, "Surface Tension, Wettability and Reactivity of Molten Titanium in Ti/Yttria-Stabilized Zirconia System,"
Mater. Sci. Eng. A, A327, 117-27 (2002).
6. B. C. Weber, H. J. Garrett, F. A. Mauer, and M. A. Schwartz, "Observations on the Stabilization of Zirconia," J. Am. Ceram. Soc., 39 [6] 197-207 (1956).
7. C. L. Lin, D. Gan, and P. Shen, "Stabilization of Zirconia Sintered with Titanium," J. Am.
Ceram. Soc., 71 [8] 624-9 (1988).
8. K. F. Lin and C. C. Lin, "Interfacial Reactions between Zirconia and Titanium," Scr. Metall., 39 [10] 1333-8 (1998).
9. K. F. Lin and C. C. Lin, "Transmission Electron Microscope Investigation of the Interface between Titanium and Zirconia," J. Am. Ceram. Soc., 82 [11] 3179-85 (1999).
10. K. F. Lin and C. C. Lin, "Interfacial Reactions between Ti-6Al-4V Alloy and Zirconia Mold During Casting," J. Mater. Sci., 34, 5899-906 (1999).
11. K. L. Lin and C. C. Lin, "Ti2ZrO Phases Formed in the Titanium and Zirconia Interface after
Reaction at 1550°C," J. Am. Ceram. Soc., 88 [5] 1268-72 (2005).
12. K. L. Lin and C. C. Lin, "Zirconia-Related Phases in the Zirconia/Titanium Diffusion Couple after Annealing at 1100° to 1550°C," J. Am. Ceram. Soc., 88 [10] 2928–34 (2005). 13. K. L. Lin and C. C. Lin, "Microstructural Evolution and Formation Mechanism of the
Interface between Zirconia and Titanium Annealed at 1550°C," J. Am. Ceram. Soc., 89 [4] 1400–8 (2006).
14. G. Cliff and G. W. Lorimer, "The Quantitative Analysis of Thin Specimens," J. Microsc., 130 [3] 203-7 (1975).
15. J. L. Murray and H. A. Wriedt, "The Oxygen-Titanium System"; pp. 211-29 in Phase Diagrams of Binary Titanium Alloys. Edited by J. L. Murray. ASM International, Metals Park, OH, 1987.
16. A. Jostsons and A. S. Malin, "The Ordered Structure of Ti3O," Acta Cryst., B24 [4] 211-3
(1968).
17. B. Holmberg, "Disorder and Order in Solid Solution of Oxygen in α-Titanium," Acta Chem.
Scand., 16, 1245-50 (1962).
18. S. Yamaguchi, "Interstitial Order-Disorder Transformation in the Ti-O Solid Solution. I. Ordered Arrangement of Oxygen," J. Phys. Soc. Japan, 27 [1] 155-63 (1969).
19. M. Hoch, R. L. Dean, C. K. Hwu, and S. M. Wolosin,"Zirconium Plus Oxygen Plus Another Metal"; pp. 12 in Phase Diagrams for Zirconium and Zirconia Systems. Edited by H. M. Ondik and H. F. McMurdie. American Ceramic Society, Westerville, OH, 1998.
Table I Zirconia and Intergranular α-Zr in the Reaction Layer “VI” Annealing
conditions zirconia and its size Grain growth of Interganular α-Zr Morphology and crystal structure of zirconia 1100ºC/6
h
Insignificant
about 0.3~0.4 µm Not found Equiaxed t-ZrO2-x 1300ºC/6
h
Insignificant
about 1~ 2µm Fine and dense Equiaxed t-ZrO2-x 1400ºC/6
h about 8~10µm Significant Continuously distributed on grain boundaries t-ZrOordered c-ZrO2-x (lenticular) + 2-x
1550ºC/6
h about 20 ~30µm Significant Isolated and coarsened on grain boundaries t-ZrOordered c-ZrO2-x (lenticular) + 2-x
Table II Reaction Layers Formed in the Interface of Ti/ZrO2 at Various Temperatures
Phases Reaction layers 1100 oC 1300oC 1400oC 1550oC α-Ti(O) ● ● ▲ ▲ α-Ti(Zr, O) + Ti2ZrO I ● ● ● ● α-Ti(Zr, O) + Ti2ZrO + β'-Ti(Zr, O) II x x x ● α-Ti(Zr, O) + β'-Ti(Zr, O) III x x ● ● Metal Side β'-Ti(Zr, O) IV x ● ● ● β'-Ti(Zr, O) + c-ZrO2-x V x ● ● # α-Zr(O) + t-ZrO2-x + c-ZrO2-x VI x † ● ● Ceramic Side t-ZrO2-x ● ● ● ●
●: observed; x: none; ▲: with sparsely distributed Ti3O; #: with ordered β'-Ti(Zr, O); †: no
Fig. 1 SEM micrographs (backscattered electron images) showing the interface of Ti and ZrO2 after annealing for 6 h at (a) 1100o; (b)
1300o; (c) 1400o; and (d) 1550oC. The vertical arrows in the upper side indicated the original interface. The interface reaction layers were designated as the reaction layers “I”, “II”, “III”, “IV”, “V”, and “VI,” respectively.
Fig. 2 SEM micrographs (secondary electron images) showing the variation of the reaction layer “I” after annealing at (a) 1300o; (b) 1400o; and (c) 1550oC, respectively.
Fig. 3 TEM micrograph (bright field image, BFI) showing the reaction layer “I” with the coexistence of α-Ti and Ti2ZrO after
annealing at 1100oC/6 h. (b) selected area diffraction patterns of the α-Ti and Ti2ZrO, indicating that [0001]α-Ti // [110]Ti2ZrO and
(10 1 0)α-Ti // (1 1 0)Ti2ZrO (A = (01 1 0)α-Ti, B = (10 1 0)α-Ti, C =
(00 2 )Ti2ZrO, D = (1 1 0)Ti2ZrO); (c) an energy-dispersive spectrum
Fig. 4 TEM micrograph (bright field image, BFI) of the reaction layer “V” consisting of β'-Ti and c-ZrO2-x after annealing at (a)
1400oC/6 h; (b) at 1550oC/6 h; (c) a selected area diffraction pattern (SADP) of β'-Ti in Fig. 4(b) (Zone axis is [021], A = ( 2 00), B = ( 2 2 2 ), and C = ( 1 1 1 )); (d) an SADP of β'-Ti in Fig. 4(b) (Zone axis is [ 1 12], A = ( 1 3 2 ), B = ( 1 1 0), and C = ( 1 1 1 )).
Fig. 5 TEM micrograph (bright field image, BFI) of the reaction layer “VI” far away from the original interface after annealing at (a) 1100oC, (b) 1300oC, (c) 1400oC, and (d) 1550oC, respectively, for 6h.
Fig. 6 TEM micrograph (bright field image, BFI) of the suboxide Ti3O
near the reaction layer “I” after annealing at 1550oC for 6 h; the inset SADP of Ti3O along the [1 2 10] zone axis. (A = (0004), B = (30 3 0),
Fig. 7 Schematic diagrams showing the microstructural evolution and
diffusion paths of the Ti/ZrO
2diffusion couple annealed at various
temperatures. (a) various diffusion paths in the Ti-Zr-O phase
diagram;
19(b), (c), and (d) the microstructures of Ti/ZrO
2diffusion couple
on annealing at 1300
o, 1400
o, and 1550
oC and after subsequent cooling,
計畫成果自評部份,請就研究內容與原計畫相符程度、達成預期目標況、研究成果 之學術或應用價值、是否適合在學術期刊發表或申請專利、主要發現或其他有關價 值等,作一綜合評估:
本計畫已經按照預期的進度完成實驗。目前已經投稿於美國陶瓷學會期刊(Journal of the American ceramic Society)且已被接受,目前正做細部方面的修改。本實驗室從
事鈦與氧化鋯的介面反應多年,已發表數篇有關於 TEM 分析鈦與氧化鋯介面反應
的文章於美國陶瓷協會期刊及其他學術期刊,將清楚提供鈦與氧化鋯的介面反應機 構。
![Fig. 6 TEM micrograph (bright field image, BFI) of the suboxide Ti 3 O near the reaction layer “I” after annealing at 1550 o C for 6 h; the inset SADP of Ti 3 O along the [1 2 10] zone axis](https://thumb-ap.123doks.com/thumbv2/9libinfo/8584652.189498/17.892.207.719.151.552/micrograph-bright-field-image-suboxide-reaction-layer-annealing.webp)