I
國立交通大學
材料科學與工程學所
碩士論文
微孔洞二氧化鈦薄膜孔洞形貌修飾及其
對染料敏化太陽能電池效率之影響
Tailoring the Pore Morphology of
Mesoporous TiO
2
Films and Its
Influence on Dye-sensitized Solar Cell
Efficiency
研究生 : 徐琬婷
指導教授 : 呂志鵬 博士
I
Tailoring the Pore Morphology of Mesoporous TiO2 Films and Its Influence on
Dye-sensitized Solar Cell Efficiency
Student: Wan-Ting Hsu Advisor: Dr. Jihperng Leu
Department of Materials Science and Engineering National Chiao Tung University
Abstract
Dye sensitized solar cell (DSSC) is one of leading technology to the next generation of solar cells. The porous TiO2 working electrode plays an important key
in DSSCs and affects the conversion efficiency. Specifically, the pore morphology of the TiO2 film affects dye adsorption, electron transport, and electrolyte diffusion. In
this study, in order to modify the pore morphology of TiO2 (pore size, surface area,
and porosity) to improve the DSSC performance, solvents and PEG in different molecular weights and loadings were added to TiO2 paste, in addition to using
different PEG burn out rate after TiO2 films coating. In specific, TiO2 films with
different pore morphology were prepared by coating commercial TiO2 nanoparticles
(P25) and a scattering layer on FTO conducting glass using doctor-blade technique. The surface area, porosity, and pore size of TiO2 films and the photochemical
characteristics of DSSCs with these TiO2 films were examined.
Results showed that PEG addition could separate the TiO2 particles leading to
modify the pore morphology of TiO2. In butanol based solvent, the surface area and
II
PEG, and PEG molecules tend to curl in a poor solvent. Even changed the molecular weights, there was almost no difference of molecule sizes in the TiO2 paste. When the
solvent was changed from butanol to water, the average pore size was increased from 11.8 nm to 22 nm due to the large solubility of PEG leading full PEG chain extension in the TiO2 particle matrix. And the molecular weights adjusting in water solution
increased the pore size from 22 nm for 35k PEG to 30.5 nm for 100k PEG. Because the PEG porogen (pore generator) in good solvent (water) leading the polymer chains of PEG tend to extend well and attach onto TiO2 particles, as the PEG polymer chains
are fully extended in water-based TiO2 paste, higher molecular weight shall lead to
larger polymer coil size.
In addition to using different solvents and molecular weights of PEG, burn out rate is another issue to modify the pore morphology of TiO2. When an additional
isothermal bake at 100oC the average pore size increased due to the expansion of PEG polymer chains and possibly some degree of PEG chain aggregation. In contrast, PEG chains were decomposed readily without enough time for chain extension. This yielded smaller pore size (11.8 nm for 35K PEG in butanol system, or 22.0 nm for 35k PEG in water system) under a fast burn-out rate at 400oC.
For DSSCs application, the conversion efficiency of DSSC increased with increasing pore size by PEG addition because larger pore size leading electrolyte diffuse more easily in the TiO2 films led to faster dye regeneration, and the electron
transport resistance in the TiO2/dye/electrolyte interface (R2) and the resistance (R3)
of Nernstian diffusion decreased. In this study, the best conversion efficiency of DSSC reached 5.13% with open circuit voltage 0.73V and short circuit current density 13.07mA/cm2. TiO2 electrode of this DSSC was prepared by 15% 35k PEG loading
III
微孔洞二氧化鈦薄膜孔洞形貌修飾及其對染料敏化太陽能電池效率之影響
研究生: 徐琬婷 指導教授: 呂志鵬 博士
國立交通大學材料科學與工程學系碩士
摘要
染料敏化太陽能電池(Dye-sensitized solar cell, DSSC)是目前極具發展潛力的 新一代有機太陽能電池。其中,奈米孔洞二氧化鈦電極扮演著重要的角色,是影 響染料敏化太陽能電池轉換效率的關鍵之一。具體來說,奈米孔洞結構二氧化鈦 薄膜的對染料的吸附、電子傳輸、電解質擴散等皆有其影響。在這項研究中,利 用在二氧化鈦漿料中添加不同分子量的聚乙二醇(polyethylene glycol, PEG)及溶 劑,以及不同的聚乙二醇燒除速度修飾二氧化鈦薄膜的孔洞大小和孔隙率。另 外,修飾後的二氧化鈦薄膜將封裝成染料敏化太陽能電池,並進一步量測其光電 轉換效率及電池內電阻。 二氧化鈦漿料在加入聚乙二醇後,其製備成的二氧化鈦薄膜有較大的比表面 積、孔洞大小及孔隙率。若所使用的二氧化鈦漿料為去離子水或以緩慢的速度燒 除聚乙二醇,二氧化鈦薄膜的孔洞大小及孔隙率將成會更大。且在聚乙二醇的添 加後,二氧化鈦薄膜的孔洞大小分佈則是一雙峰分佈。利用上述方式可以控制二 氧化鈦膜的孔洞大小由 8.07 nm 增加至 35.13 nm,而孔隙率由 31.05%增加至 69.81%。 將二氧化鈦多孔薄膜製備成染料敏化太陽能電池之後可以發現,二氧化鈦多 孔電極中具有較大的比表面積可以吸附更多的染料,較大的孔洞大小及孔隙率可
IV
以讓電解液擴散更容易,導致更快的染料再生和高的光電轉換效率。增加二氧化 鈦多孔電極中的孔洞大小及孔隙率後,染料敏化太陽能電池的光電轉換效率從 4.31%上升至 5.13%。電化學阻抗譜(Electrochemical impedance spectrum, EIS)
分析後可得知,在二氧化鈦/染料/電解質介面上的電子傳遞阻力(R2)和電解液的 擴散電阻(R3)的隨孔洞大小及孔隙率增加而增加。此結果可以再次確認從電池效 率分析後所得到的結論。 最佳化的奈米孔洞二氧化鈦電極是由添加了 15%的聚乙二醇(分子量 35,000) 的水系二氧化鈦漿料所製備的,其比表面積為 59.12m2 /g,平均孔洞大小為 22.07nm,孔隙為 50.87%。以此電極所組成的染料敏化太陽能電池能達到 5.13 %的光電轉換效率,而其填充因子為 0.54,開路電壓為 0.73V,短路電流密度則 是 13.07mA/cm2。
V
Acknowledgement
很高興在碩士班期間可以加入呂志鵬教授實驗室這個大家庭,在這裡與大家 一起努力。要先感謝呂志鵬老師在各方面的指導,除了學術研究之外,也學習到 了許多科技寫作與報告呈現的技巧。另外在做人處事及未來在職場上所應具備的 能力,也在這期間曾進不少,十分感謝老師的用心與叮嚀。 實驗室的學長姐也在這些日子裡給予大力的幫助,讓我備感溫馨。要先謝謝 國原學長,在這段期間給予的許多幫助和實驗資源。謝謝幸鈴學姊,在專業的化 學領域給了我很大的幫助,當我遇到困難時,總能幫助我找到最佳的解決方法。 感謝明義學長,在學長的細心帶領下,學會了很多實驗設計及實驗結果的分析討 論方法。還有實驗室的各位學長姐,經常陪我聊天的王智學長,總為我帶來愉快 心情的邱詩雅學姐,有趣可愛的車牧龍學長,風趣幽默的大龜學長還有弘恩學 長。感謝他們親切的帶領我學習研究時所需的各項能力,提供我專業的意見,或 是日成生活中的幫助。 謝謝我的同學伯政和瑜修,在平時跟我討論課業或陪我說話。可以有像他們 這樣的同學可以相互鼓勵學習是很令人開心的事。還有實驗室的學弟妹們,書 豪、沁穎、奎岳、勝翔還有田丞芳,很感謝他們聽我抱怨,在日常生我中也幫了 我一些忙。很感謝大家,讓我在這些時間學習到很多,得到很多,也過得很充實。 最後要感謝我的家人,因為他們的支持,我才能無憂的完成碩士學位,感謝他們 的付出與諒解。VI
Contents
Abstract ... I 摘要... III Acknowledgement ... V Contents ... VI Figure Captions ... VIII Table Captions ... XChapter 1 Introduction ... 1
Chapter 2 Literature Review ... 5
2.1 Dye-sensitized Solar Cell ... 5
2.1-1 DSSC Structure Analysis and Working Principle ... 5
2.1-2 Operation Principles of Dye-sensitized Solar Cells ... 8
2.2 Components of DSSCs ... 10
2.2-1 Substrate ... 10
2.2-2 Nanocrystalline Photo-anode ... 10
2.2-3 The Sensitizer: Organic dye ... 12
2.2-4 Electrolyte ... 15
2.2-5 Counter electrode ... 18
2.2-6 Sealant and Spacer ... 19
2.2-7 Post-treatment/Pretreatments/Underlayer ... 20
2.3 TiO2 morphology control ... 22
2.3-1 Different TiO2 Particle Size ... 22
2.3-2 Muti-Layer of TiO2 Film ... 23
2.3-3 TiO2 Nanotube ... 24
2.3-4 Special TiO2 Nanostructure ... 24
2.3-5 Dispersive Polymer Addition... 26
2.4 Instrument Methodologies ... 28
2.4-1 Brunauer–Emmett–Teller ... 28
2.4-2 Electrochemical Impedance Spectroscopy (EIS) ... 30
Chapter 3 Experimental Section ... 33
3.1 Materials ... 33
3.2 TiO2 Paste Preparation ... 35
3.2-1 TiO2 paste composition ... 35
3.2-2 TiO2 paste mixing process ... 36
3.3 TiO2 film Preparation ... 37
3.4 DSSCs fabrication ... 39
VII
3.5-1 Brunauer–Emmett–Teller (BET) Analysis ... 41
3.5-2 Scanning Electron Microscopy (SEM) ... 41
3.5-3 Uv-Visible Light Spectrum ... 41
3-5-4 Phtocurrent Examination ... 42
3-5-5 Eectrochemical Ipedance Sectroscopy (EIS) ... 42
3.6 Experimental Flow ... 43
Chapter 4 Results and Discussion ... 44
4.1 Characterization of TiO2 films ... 44
4.1-1 Surface morphology and film thickness of TiO2 film... 44
4.1-2 Pore Morphology of TiO2 Film ... 46
4.1-2.1 Effects of PEG Molecular Weight and Loading on Pore Morphology of TiO2 Films ... 49
4.1-2.2 Effect of solvents on Pore Morphology of TiO2 Films ... 52
4.1-2.3 Effect of PEG Burn-out Rate on the Pore Morphology of TiO2 Films ... 58
4.1-3 Dye Adsorption Analysis ... 63
4.2 DSSC performance ... 67
4.2-1 Cell Efficiency ... 67
4.2-2 Impedance inside DSSCs... 72
Chapter 5 Conclusion ... 78
VIII
Figure Captions
Fig. 1- 1 The path length, in units of Air Mass, changes with zenith angle. ... 2
Fig. 2- 1 The structure of DSSC ... 5 Fig. 2- 2 Schematic of operation of DSSC ... 6 Fig. 2- 3 Spectral response curve of the photocurrent for the DSSC sensitized by N3
and the black dye. The chemical structure of N3 dye and black dye. ... 13 Fig. 2- 4 The chemical structure of N719 dye and N749 (black dye). ... 14 Fig. 2- 5 Structure of the ruthenium sensitizers RuL3 (yellow) cis-RuL2(NCS)2 (red)
and RuL (NCS)3 (green) where L) 2,2’-bipyridyl-4,4’-dicarboxylic acid and L)
2,2’,2”-terpyridyl -4,4’,4”-tricarboxylic acid. The lower part of the picture shows nanocrystalline TiO2 films loaded with a monolayer of the respective sensitizer. ... 14 Fig. 2- 6 An Ideal Nyquist Plot ... 31 Fig. 2- 7The equivalent circuit for the DSSCs with liquid type electrolyte ... 32
Fig. 3- 1 Coating process of the TiO2 film. (a) Doctor-blade coating TiO2 film. (b)
TiO2 film sintered at 400℃. (c) Spin-coating scattering layer. (d) TiO2 electrode
sintered at 400℃. ... 38 Fig. 3- 2 The DSSC fabrication process. (a) Sealing the dye-sensitized photoanode
and Pt-coated counter electrode. (b) Electrolyte injection. (c) Sealing the
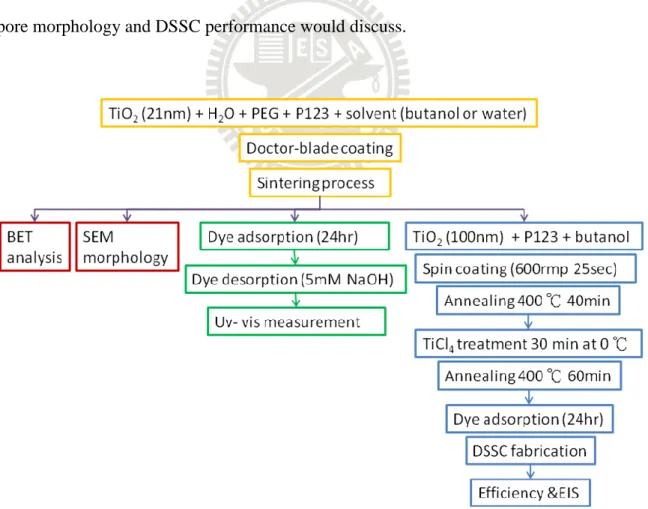
electrolyte injection holes on counter electrode. ... 40 Fig. 3- 3 Experiment Design chart ... 43
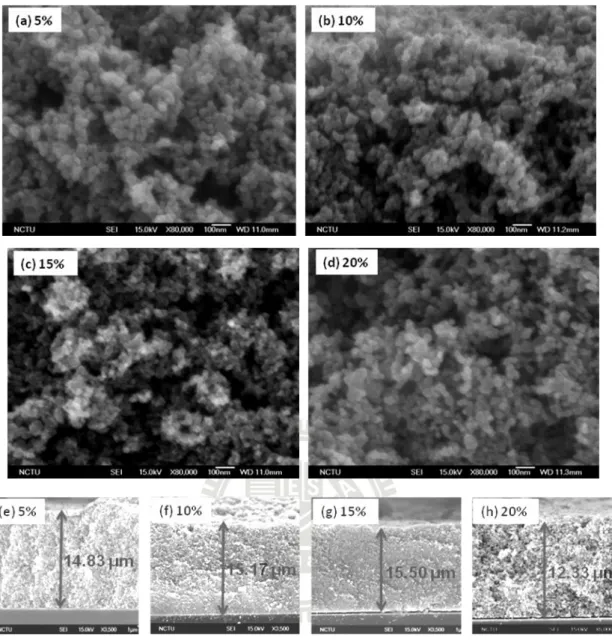
Fig. 4-1 The surface morphology and film thickness of TiO2 electrodes prepared at
various PEG loadings (5, 10, 15, and 20%) (a)-(d): surface morphology; (e)-(h): TiO2 film thickness ... 45
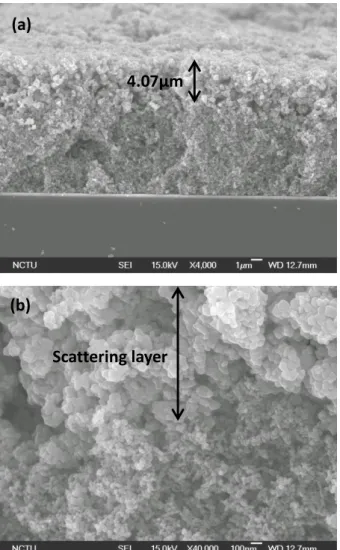
Fig. 4-2 SEM image of (a) scattering layer (100 nm TiO2 particles) coated on TiO2
film (21 nm TiO2 particle) (X4,000) and (b) under large magnification (X40,000).
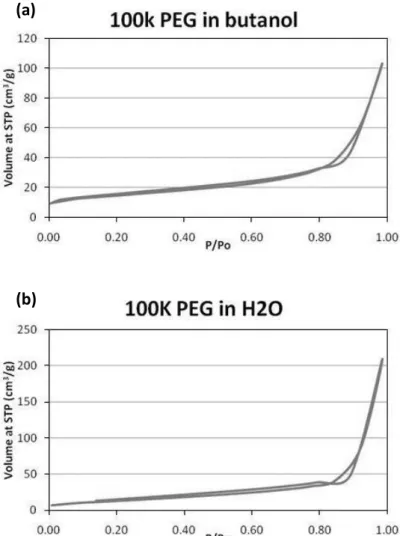
... 46 Fig. 4-3 N2 adsorption-desorption standard isotherms for (a) micro-porous sample, (b)
non-porous sample, (c) macro-porous sample, (d) meso-porous sample, (e) micro-porous or meso-porous sample and (f) sample with pores more than one type. [109] ... 47 Fig. 4-4 The N2 adsorption-desorption isotherms of the TiO2 films prepared by TiO2
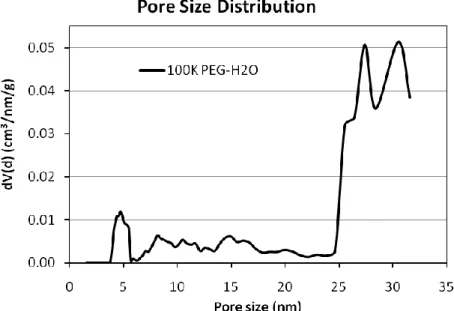
paste in (a) butanol solution and (b) water solution. ... 48 Fig. 4-5 A bimodal pore size dustribution of the TiO2 film prepared by paste using
IX
15% PEG (MW = 100k) loading and H2O solvent ... 49
Fig. 4-6 The pore size distributions of the TiO2 film prodeuced by TiO2 paste with 35k
and 100k PEG addition and in different solvent system. ... 51 Fig. 4-7 The pore size distributions of the TiO2 film prodeuced by TiO2 paste with 35k
PEG in different solvent system. ... 53 Fig. 4-8 Average pore size and porosity of TiO2 films using different solvent systems
... 55 Fig. 4-9 Schematic diagram of PEG working mechanism in TiO2 paste with different
solvent systems. (a) TiO2 film without PEG loading, (b) TiO2 film with PEG
loading in butanol solution, and (c) TiO2 film with PEG loading in water
sollution... 57 Fig. 4-10 Average pore size and porosity of TiO2 films with different PEG molecular
weight ... 58 Fig. 4-11 The pore size distributions of the TiO2 film prepared by different PEG
burn-out rates using water-based pastes. ... 59 Fig. 4-12 (a) Average pore size and porosity of TiO2 films with different PEG
burn-out rates in butanol system (b) in water system ... 60 Fig. 4-13 UV-visible spectra of the reference dye solution and the dye desorption
solution of TiO2 film prepared by TiO2 paste with 35k PEG loading in butanol
system. ... 65 Fig. 4-14 Dye adsorption and surface area of TiO2 films as a function of pore size ... 65
Fig. 4-15 I-V curve of DSSC with TiO2 electrode prepared by PEG (35k, 15% loading)
TiO2 paste in butanol system. ... 68
Fig. 4-16 I-V curves of DSSCs with TiO2 electrode prepared by TiO2 paste with no
PEG loading, 35k PEG 15% loading in water system, and 100k PEG 15%
loading in water system combined with slow PEG burn-out process. ... 69 Fig. 4-17 An EIS spectrum (Nyquist diagram) of DSSC with TiO2 electrode prepared
by PEG (35k, 15% loading)-water paste under illumination ... 73 Fig. 4-18 The equivalent circuit for the DSSC ... 73 Fig. 4-19 EIS spectra of DSSC with TiO2 electrode prepared by TiO2 paste with (1) no
PEG loading, (2) PEG (35k, 15% loading) in water system, and (3) PEG (100k, 15% loading) in water system combined with a slow PEG burn-out process. .... 74 Fig. 4-20 R2, R3 and efficiency of DSSCs with different pore size TiO2 films ... 76
Fig. 4-21 R2, R3 and efficiency of DSSCs with different porosity TiO2 films ... 77
X
Table Captions
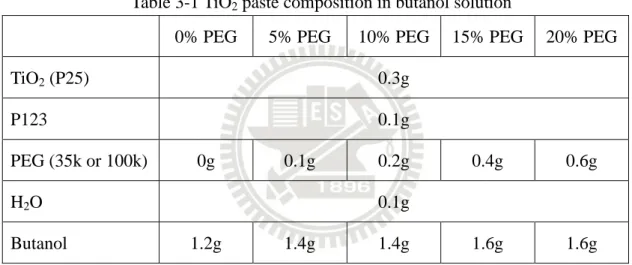
Table 3- 1 TiO2 paste composition in butanol solution ... 35
Table 3- 2 TiO2 paste composition in water solution ... 36
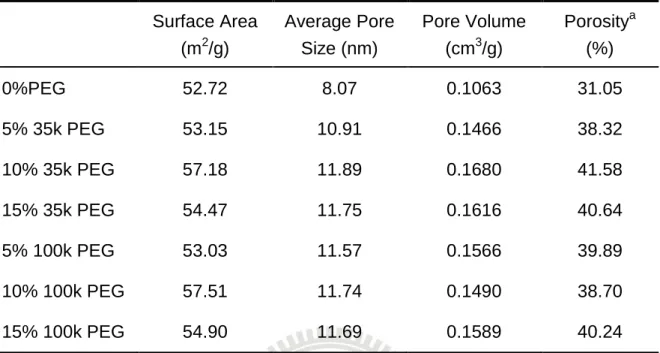
Table 4-1 Pore morphology of TiO2 film prepared by PEG with various molelcular
weights and loadings in butanol system paste. ... 51 Table 4-2 Pore morphology of TiO2 films prepared by PEG (15% loading; MW=35k
or 100k) in different solvents ... 54 Table 4-3 Pore morphology of TiO2 film prepared by PEG with various molecular
weights and loading in butanol and water solvent systems and different PEG burn-out rates ... 62 Table 4-4 Average pore size, UV-visible absorption intensity, dye adsorption, and
specific surface area of various TiO2 films. ... 66
Table 4-5 Photovoltaic characteristics of DSSCs made by different TiO2 electrodes. 71
Table 4- 6 TiO2 film average pore size, porosity, fitted impedance parameters and
1
Chapter 1 Introduction
After industrial revolution, energy consumption sharp increased and each kind of energy was developed one after another especially fossil fuel since 19th century. However, these energy source storages are limited and going to be exhausted this century. Also, the highly usage of fossil fuel caused serious environmental pollution and ecological damage. United Nation Framework Convention on Climate Change (UNFCCC) and Kyoto Protocol clearly emphasize the importance of renewable energy development.
Renewable energy including waterpower, wind power, solar, biologic energy, terrestrial heat, ect. and these energy can transfer into electric power, heat, chemical power and fuel. In all kinds of energy, solar energy is almost inexhaustible and without environment pollution. The supply of energy from the Sun to the Earth is gigantic: 3×1024 joules a year, or about 10,000 times more than the global population currently consumes, which means converting 0.1% of the Earth’s surface with solar cells with an efficiency of 10% would theoretically satisfy our present needs. [1]
Nevertheless, the solar energy from the sun cannot be use efficiently. Part of the sun power would be absorbed by the Earth’s atmosphere or reflected to space. The Air Mass (AM) value is set to describe the spectrum (not necessarily the intensity) of sunlight at particular latitude. It is defined as the distance through the atmosphere that the light from the sun travels in order to reach the solar cell. This is expressed relative to conditions at the equator, where the sun is almost directly overhead, and where the light is therefore described as AM1.0. Thus in space, without atmosphere, the spectrum is referred to as AM0.
2
standard is that of AM1.5 conditions. In addition, we usually also specify the intensity of the light, integrated over the spectrum, as being 100mV/m2 (1 sun). When using solar concentrators, such as the intensity might be increased by a factor of 1000, but the shape of the spectrum would remain AM1.5. [2]
Fig. 1-1 The path length, in units of Air Mass, changes with zenith angle. [3]
Even though the sun energy is hard to be used efficiently, solar power still offers a realistic solution to energy problems and that is the reason solar cells have attracted extensive attention and fast developed. Solar can be transformed to electricity, fuels and heat through varied solar utilization, without noise and it produces no air pollution. Massive solar power conversion would ensure abundant energy and safe clear environment for future generations.
In all kinds of solar cells, silicon (Si) base solar cells are more mature developed and main products on the market. However, the coast of silicon base solar cells is higher than other energy generation method and only be used at specific situation. It is
3
important to development more low coast and high conversion efficiency solar cells for mass energy generation for popular use.
Gratzel et alet al. developed a new kind of solar cell, dye-sensitized solar cell, which has relatively high conversion efficiency, simple fabrication process, low production coast and transparency in 1991. [4] Great conversion efficiencies (above 11%) have been reported based on mesoporous nanocrystalline TiO2 film, ruthenium sensitized dye, triiodide/iodide redox couple in organic solvent as the electrolyte and platinum coated counter electrode. [5, 6] Because its easy production process and transparency can be design to combine with various electronic devise and become portable final products.
The performance and efficiency of the DSSC depend on many factors such as the platinum layer of the counter electrode, the TiO2 layer surface morphology and the
structure, dye molecules, the status and component of the electrolyte and so on. Mesoporous nanocrystalline TiO2 films provide large surface area for dye adsorption,
electrical connection with the redox electrolyte, electron diffusion and transportation. As the pore size and porosity of the TiO2 film increases, the diffusion of electrolyte
becomes easier, but the effective surface area decrease and the amount of dye adsorb less. Therefore, the morphology of the TiO2 film plays a very important role in the
high efficiency DSSC. There is a precise balance between pore size, porosity, effective surface area and thickness of TiO2 film to achieve optimum DSSC
performance.
Different shape and size of TiO2 particles were used to fabricate high efficiency
DSSCs. The use of small TiO2 particles and large pore size was reported to yield good
electron transport and high current efficiency of DSSCs. [7] Recently, TiO2 nanotubes
[8, 9] are introduced to enhance conversion efficiency for DSSCs due to its increased surface area for dye absorption. However, the syntheses of TiO2 nanotubes or special
4
shape TiO2 are time-consuming multistep process, which is difficult to scale up for
production. In contrast, a simple and efficient method to control the TiO2 film
morphology is to add dispersive polymer into TiO2 paste to form larger pores, higher
porosity, and more surface area. [10, 11] Most commonly used dispersive polymers are polyethylene glycol (PEG) and polystyrene. Some reports show the relationship between dispersive polymer addition and their effect on TiO2 characteristic [12-14].
However, there are only few reports talking about the dispersive polymer addition effect on the porosity and pore size in TiO2 films, resistances inside DSSCs and the
cell performance.
In this study, for modifying the pore size and porosity of TiO2, different
molecular weight PEG and solvent were used in TiO2 paste and different PEG burn
out rate were applied after TiO2 films coating. TiO2 films with different pore size and
porosity were prepared by coating commercial TiO2 nanoparticles (P25) on FTO
conducting glass using doctor-blade technique. Appling PEG and different solvents in TiO2 paste is an easy way to control the TiO2 film pore morphologies without change
any process in produce DSSCs. The porosity and pore size of TiO2 films and the
photochemical characteristics of DSSCs with these TiO2 films were investigated. The
correlation between TiO2 film pore morphologies and DSSC performance were
discussed. Finally, the pore morphology of TiO2 film was optimized for the best
5
Chapter 2 Literature Review
2.1 Dye-sensitized Solar Cell
Brin O’Rengan and Michael Gratzel propose a high efficiency photovoltaic cell with TiO2 nanoporouse film as semiconductor electrode, ruthenium (Ru) organometallic compound as light sensitizer and suitable redox couple solution as electrolyte [4]. This solar cell called “dye-sensitized solar cell” which had 7.1% conversion efficiency under sun illumination. A break through at 1999, the cell conversion efficiency reached 10% [15] and the best record of DSSC conversion efficiency is higher than 11.7%.
2.1-1 DSSC Structure Analysis and Working Principle
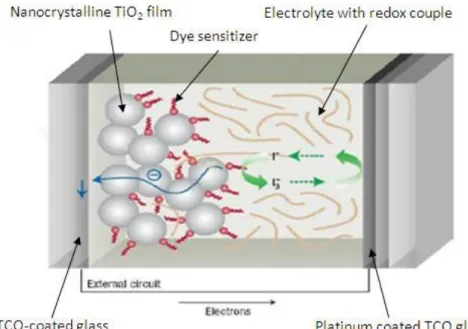
Fig. 2-1 is the structure of DSSC. DSSC is a sandwich structure consist of TCO glass, dye sensitized TiO2 layer, electrolyte and platinum coated counter electrode.
6
Fig. 2-2 demonstrates the schematic structure of DSSC. The photoanode, which is made of mesoporous dye-sensitized semiconductor, receives electrons from the photo-excited dye which is oxidized. The oxidized dye molecules then turn to oxidize the mediator, the redox species in the electrolyte and regenerate dye. The mediator is regenerated by the reduction at the cathode by the electrons circulated through the external.
Fig. 2-2 Schematic of operation of DSSC [1]
1. Photoexcitation on dye molecules to induce charge separation:
Dye + hv → Dye*
(2-1)
2. Charge (electron) injects into conduction band of mesoporous TiO2:
Dye* → Dye+ + e-TiO2 (2-2) 3. Charge passes through outer circuit via electronic load:
e-TiO2 e -
counter (2-3) 4. Dye reduces to ground state by redox couple in the electrolyte:
2Dye+ + 3I- → 2Dye + I3
-
(2-4)
7
5. Redox couple reduces on counter electrode by the charge comes from outlet circuit: I3 - + 2e-counter → 3I - (2-5)
The Total Reaction:
e-(counter) + hv → e-(TiO2 electrode) (2-6)
The TiO2 mesoporous electrode does not work as the main light absorption
character, but used a carrier transport host material inside DSSC systems. The synthesized organic dye attached to TiO2 absorbs almost the visible light and made
carrier injected from excited dye molecules then quickly transport to the current collector and then the outer circuit. It avoids the direct charge recombination, which is the energy-favored process after charge separation. The electrons and holes run different routes back to their ground state; this important property contributes to the unusual charge separation efficiency inside DSSC systems.
There are also some reasons make low DSSC conversion efficiency, such as electron/hole recombination inside DSSC, resistance of the materials and impedance at each material interface. The main recombinations are at TiO2/dye interface and
TiO2/electrolyte interface, which might cause photocurrent loss.
Equation of recombination at TiO2/dye interface:
Dye+ + e-TiO2 → Dye (2-7) Equation of recombination at TiO2/electrolyte interface:
3I- + 2e-TiO2 → I3 -
(2-8)
The resistance of row materials are decided when the material was chosen, but the impedance at each interface can be reduced by surface modification and post-treatment to improve the connection of each materials.
8
2.1-2 Operation Principles of Dye-sensitized Solar Cells 1. Open Current Voltage (VOC) Characteristics
When photovoltaic devices are under illumination, the open circuit voltage can be calculated from the diode equation. [5]
(2-9)
Where n is the ideality factor whose value is between 1and 2 for DSSC, and i0 is the
reverse saturation current, which can be measured in reasonably large reverse voltage. The two main characteristic quantities, the open circuit voltage VOC which represents
the voltage produce in the absence of any current, and short circuit current ISC which
stands for the current with no voltage across the cell.
When photovoltaic device are in dark, they should obey the ideal diode equation:
(2-10)
which indicates a positive applied voltage can make an easy current flow.
2. Incident Photons to Current Conversion Efficiency (IPCE)
IPCE is an important parameter when determining the performance of a photovoltaic device. IPCE is defined as the number of electrons flowing through the external circuit over the number of photons incident on the cell surface at a particular wavelength, which means IPCE the ratio of the observed photocurrent over the incident photon flux.
3. Cell Efficiency (η)
We called VOC as the maximum voltage at photovoltaic device, and ISC as the
maximum short circuit current under illumination. The IV-curve yielding the maximum power is called PMAX. In addition, another important parameter of cell
9
performance is the Fill Factor (FF), which is defined as follows:
(2-11)
FF is an efficiency factor, used for checking whether the PMAX is ideally equal to
VOC × ISC or not, because there are many impedances, including the contact resistance,
electrolyte resistance, charge transfer resistance, ect. inside the cell to cause potential drop.
The overall energy conversion efficiency (η) is defined to be the maximum power generated by DSSC under illumination:
(2-12)
Equation (2-10) indicates high open circuit voltage and short circuit current are necessary for high overall efficiency, but the conversion efficiency will still be low without high fill factor (FF).
10
2.2 Components of DSSCs
2.2-1 Substrate
The most used substrates for DSSC are transparent conducting oxide (TOC), the coated glass substrates. The choice of TCO coated glass is usually a compromise between transmittance and conductance. Fluorine-doped tin oxide, the SenO2.F or FTO and indium tin oxide, or ITO are the most commonly used TCOs for thin film photovoltaic cells.[17] The reason choosing TCO coated glass substrates is for the procedure of TiO2 electrode including sintering and deposited film at 400- 500℃. FTO coated glass is the best choice for such high temperature process, although ITO can be more easily produced and is more inexpensive.
For meeting the trend of consumer electronic devices, recently a new focus of DSSC technology is directed to the realization of lightweight plastic film-type cells. For this purpose, replacement of TCO coated solid glass substrates with flexible plastic substrates has been the subject of intense study. The use of flexible substrates also brings about a significant merit for drastic cost reduction by manufacturing the entire cell through roll-to roll assembling. [18]
2.2-2 Nanocrystalline Photo-anode
For adsorption more dye molecules to increase the cell efficiency, high surface mesoporous semiconductor for DSSC become very important. Titanium dioxide is the fundamental semiconductor for DSSC because of its non-toxic properties, easy produce process, high stability and low coast. The surface is composed of 15-20nm-sized particles, and about 100 times the geometric area occupied for each micrometer of thickness. A roughness factor, defined as the ratio of the real surface area to the projected area, is at least 1000 to ensure efficient solar light harvesting by
11
the currently used sensitizers.[19] The thickness of TiO2 film is typically 5-20μm and
analysis of the layer morphology shows the porosity to be ~50-65%.
There are two main ways to prepare TiO2 photoanode. One is the “sol-gel
method”[20, 21], by which TiO2is prepared from hydrolysis of Ti-alkoxides and
addition of binder. Narrow particle size distribution and fine-ordered crystal structure can be obtained by carefully controlling every preparing step. However, this method is limited to small scale for laboratory only although these properties are desired in standard electrode. The other one is “paste-coating method”[22, 23], by which commercial TiO2 nanoparticles such as Degussa P25 and the binder are to maintain
the dispersion, which could be the convenient way producing TiO2 photoelectrodes.
The morphology control of TiO2 film is also important for photoanode which is
reviewed in next section.
The above two well-mixed paste is applied to TCO substrate by (1) Doctor Blade Method, (2) Screen Printing and (3) Spin Coating techniques. After coating and air-drying, the film is then sintered at 450-500 ℃ for 30 minutes in order to decompose organic binders and surfactants and to improve electrical contact between adjacent TiO2 particles in the porous layer as well as between the TiO2 particles and
substrate at the same time.
There are still other ways for preparing nanostructured TiO2 electrodes, including
electrodeposition [24-26], evaporation [27], sputter deposition[28-32], chemical vapor deposition [33, 34], ect. Other methods use highly-ordered TiO2 nanotube arrays [35]
and mixture of TiO2 nanowires and nanoparticles [36] as photoelectrode. Both
front-side and back-side illumination were applied when using the TiO2 nanotube
arrays electrode, indicating that electron transport in the nanotube is faster than between nanopaticles.
12
2.2-3 The Sensitizer: Organic dye
As mentioned before, the organic dye becomes a sensitizer which absorbs most of the incident light and increases the cell efficiency. Organic dye used in photoelectrochemical cells should meet the follow needs:
1. Absorption: With good absorption in visible light region up to wavelength 920nm, almost the incident light from sun.
2. Energetic: With sufficient electrons on excited state providing the driving force to make electrons inject to conduction band of TiO2 thin film. Organic dye should
also have relative low ground state for reduction by the redox couple in electrolyte.
3. Kinetics: The rate of electron injection should be high, and the lifetime of excited electrons should be long enough.
4. Stability: The organic dye can be operated under normal environment for more than 108 times of the redox cycle reaction and can be operated for more 20 years. 5. Interfacial Properties: It can attach on TiO2 surface and not easily desorption from
TIO2 electrode.
A breakthrough of organic sensitized dye is accomplished by Gratzel’s group at EPFL in Switzerland by using metallo-organic ruthenium complex as the “dye” along with nanostructured TiO2 electrode.[4] The dye have the general structure ML2(X)2,
where L stands for 2,2’-bipyridyl-4,4’-dicarboxylic acid, M for ruthenium or osimium and X for halide, cyanide, thiocyanate. The cis-RuL2 (NSC)2, also called N3 dye has
shown impressive performance and has been wide used in DSSC research. Fig. 2-3 compares the spectral response of the photocurrent observed with two sensitizers. The incident photo to current conversion efficiency (IPCE) of DSSC is plotted as a function of excitation wavelength. Both chromophores show high IPCE values in the
13
visible range. However, the response of the black dye extends 100nm further into the IR than of N3. The photocurrent onset is close to 920nm, i.e. near the optimal threshold for single junction converters. Recently there is a credible challenger identified to the “black dye” (tri(isothiocyanate)-2,2’,2”-terpyridyl-4,4’4” -tricarboxylate)Ru (Ⅱ).
Fig. 2-3 Spectral response curve of the photocurrent for the DSSC sensitized by N3 and the black dye. The chemical structure of N3 dye and black dye. [17]
Lately several studies showed up by modifying the function groups to improve excitation lifetime and increase the open circuit voltage of the cell which are called N719, N749 (black dye)…ect. (Fig.2-4). Recent work has focused on the molecular engineering of suitable ruthenium compounds, which are known for their excellent stability. Cis-Di-(thiocyanato)bis(2,2’-bipyridyl-4,4’-dicarboxylate)ruthenium( Ⅱ ),
14
coded as N3 or N719 dye depending on whether it contains four or two protons, was found to be an outstanding solar light absorber and charge-transfer sensitizer. Fig. 2-5 shows the structures of three ruthenium complexes with different colors that have been widely employed as sensitizers for the DSSC. This feature can be applied to design multicolor DSSC in art and architecture.
Fig. 2-4 The chemical structure of N719 dye and N749 (black dye). [37]
Fig. 2-5 Structure of the ruthenium sensitizers RuL3 (yellow) cis-RuL2(NCS)2 (red)
and RuL (NCS)3 (green) where L) 2,2’-bipyridyl-4,4’-dicarboxylic acid and L)
2,2’,2”-terpyridyl -4,4’,4”-tricarboxylic acid. The lower part of the picture shows nanocrystalline TiO2 films loaded with a monolayer of the respective sensitizer. [38]
15
Another important issue being raised up lately is the dye adsorption process, in which the sintered TiO2 electrode is immersed into a dye solution, usually 2×10⁻⁴M in
solvent traditionally. The dye adsorption should be done immediately after high temperature sintered process for TiO2 electrode for not letting water content in the
pores of electrode react with the exciting dye molecules and affects the long-term stability. In practice, we keep the photoelectrode in anhydrous condition before and after dye adsorption. The overall dye adsorption process should be stored in a moisture-free environment.
2.2-4 Electrolyte
Electrolyte systems consist of redox couple and solvent, which works as reductant providing electrons to redox the oxidized dye molecules at photoelectrode and as oxidant receiving from counter electrode.
Redox Couples
Requirements and properties of redox couple in electrolyte should be defined: 1. Redox potential
The redox couple reversible potential has to be equal to the negative of dye reversible potential. The more negative the potential, the large the thermodynamic driving force for the dye regeneration. However the potential request should make the balance between the driving and the open circuit potential hence the cell performance in order to avoid unnecessary loss of usable energy.
2. High solubility
To make sure sufficient supply of the redox mediator and to minimize the possibility of diffusion-limited situations, an adequate concentration of redox couple is needed. Because diffusion-limited would result in an undesirable lifetime of the oxidized dye and consequently would increase the possibility of
16
dye decomposition. Concentration are commonly used at 0.1-0.5M 3. High diffusion coefficient
A high diffusion coefficient is needed because the mass transport of the redox couple in a solar cell (through solution and TiO2 network) occurs solely by
diffusion.
4. No significant spectral characteristics in the visible region
In order to prevent the situation of less light being available for the light-to-electricity conversion and thus low energy conversion, the redox couples should not able to have absorbance in the visible light region.
5. High stability of both the reduced and oxidized forms of couple
For efficient redox “shuttling” in solar cells, both the oxidized and reduced forms of the couple need to be present in solution and both forms must have high stability. In the case of iodide/triiodide system, the reduce form is in excess. [39, 40]
6. Highly reversible couple
The oxidation of the reduce form and reduction of the oxidized form of the redox couple must be electrochemically and chemically reversible to ensure the fast electron transfer and avoid unwanted side reactions.
7. Chemically inert system
The components of the redox couple system must be chemically inert to avoid the side reaction, e.g., no chemical reactivity with TiO2, no surface activity,
ect.
Based on the requirements listed above, many redox couples have been tested for DSSC systems. Now the I-/I3- redox couple still remains the best choice because of its kinetics and suitable redox potential for TiO2 electrode.
17
salt such as KI, LiI, alkyl methylmidazolium iodide, ect. to form I-/I3- couple. The triiodide would form instantaneously when iodide is added into iodide via this equation:
I-+ I2 → I3
-
(2-13)
Ionic liquid utilizing iodide as anion like DMPII (diemethyl-propyldazium iodide) has also been introduced to be iodide source in DSSC systems. It is believed that those “liquid-like” salts have higher dissociation rate than tradition iodide salt.
Solvents used for electrolyte
Some criteria are made for a suitable solvent for liquid-type electrolytes as below:
1. The solvents must be liquid and have low volatility at the operation temperature (usually 40-80℃) to avoid freezing or expansion of the electrolyte which would damage the whole cells.
2. They have low viscosity for rapid diffusion of carriers.
3. The chosen redox couple should have high dielectric constant to promote dissolution in solvent.
4. The solvent should not make desorption or dissolution of sensitized dye. 5. The solvent should not decompose under illumination or after long time use. 6. The solvent should better be low coast for large scale production, and have low
toxicity.
Typical liquid solvents are acetonitrile (ACN) [41], methoxyactonitrile, 3-methoxypropionitrile (3-MPN), ethylene carbonate (EC) [42], propylene carbonate[37], ect. and their mixture[43-46]. ACN has performed the best among these solvents, but it is still unwelcoming due to two reasons: (1) highly volatile with low boiling point (82℃) and (2) it is a carcinogenic chemical.
18
There are also new conceptions for the electrolyte of DSSC: Quasi-solid state polymer electrolyte, using ionic liquid as solvent for electrolytes containing an I-/I3
-
redox couple.[47] The request for long-operation stability of DSSC is a driving force of to substitute liquid electrolyte by solid or quasi-solid state electrolyte.[48-52] However, the mass transport of the triiodide has been considered as a limiting factor for ionic liquids due to their low diffusion coefficient and lower concentration in these electrolytes versus iodide. A high concentration of redox couple is needed to achieve a domination of the exchange-reaction based fast charge transport process between I- and I3
-
in viscous electrolytes. On the other hand, the absorption in visible light by I- competes with the absorption of the dye and high concentration of I- promotes thr back electron transfer from conduction band of the photoanode to the triiodide[53].
2.2-5 Counter electrode
The reaction on counter electrode is rtiiodide reduction:
I3
-
+ 2e- → I- (2-14)
This reaction plays an important role in the overall DSSC system because it is responsible for the regeneration of oxidized dye molecules. The conversion efficiency of DSSC might be lowered if the speed of dye regeneration is lower than the dye oxidization by photo injection.
Science the ITO or FTO shows slow kinetics of triiodide reduction in organic solvents [54 55], catalytic material is coated in order to accelerate the reduction reaction. Platinum (Pt) has been almost exclusively as the catalytic material. However, different methods preparing thin Pt film lead to different efficiency and coast. Fang et
al. used sputtered Pt layer and they found out that the sputtered Pt layers on different
type of substrates (steel sheet, nickel sheet, polyester film, and conducting plastic film) have slightly different cell efficiencies in comparison with that based on a conducting
19
glass. [56] In recent reports, Kim et al. have demonstrated the preparation of a new counter electrode consisting of Pt nanosized phase in NiO or TiO2 porous phase using
a RF co-sputtering system. They indicated that by applying Pt in a metal oxide biphase electrode, the short circuit current density and cell efficiency were increased due to the increased active surface area of the nanosixed Pt.
Nonetheless, sputtering system is not proper for mass production considering the coast and the environment request of ultra-high vacuum. Papageorgiou et al. [57] developed a method called “thermal cluster platinum catalyst” (TCP). Counter electrode made by this method has low Pt loading (around 2-10g/cm3), superior kinetic performance, and mechanical stability comparing with other deposition methods like sputtering, spin coating, thermal[5, 58], and electrochemical deposition.
Wei et al. [59, 60] developed a simple technique called “two-step dip coating” for preparing a Pt nanoclusters counter electrode for DSSC system. With an appropriate surface conditioner, the adhesion of PVP-capped Pt nanoclusters on ITO glass becomes satisfactory. Electrodes employing this method exhibit not only ultra low Pt usage but also good catalytic performance.
There are still other materials used for counter electrode, such as conducting polymer [61, 62], nanocarbon [63], carbon black [64, 65] and carbon nanotubes [66], some of them even use polymer-catalyst composites[67-69]. These new material used as counter electrode usually requires porous film on the substrate to obtain acceptable catalytic reduction efficiency.
2.2-6 Sealant and Spacer
Sealing is a very important process in DSSC system to avoid the humid environment and to prevent the decomposition of dye molecules. The thickness of spacer is also having dilemma between making lower IR drop and the risk of short
20
circuit.
Surlyn, a thermoplastic resin which has good toughness, becomes a good sealant used in DSSC. It is inert to electrolyte and shows great tightness. However, there are still other types of resin which also used in DSSC system, and optimal one is not decided.
2.2-7 Post-treatment/Pretreatments/Underlayer
Recent paper [70] revealed that a post-treatment of the TiO2 film can efficiently
improve the performance of DSSC based on the fact that an extra layer of TiO2 is
grown onto the TiO2 nanoparticles constituting the film. There are many hypotheses
concerning the following aspects: (1) Surface area[20]
(2) Electron transport[20] (3) Light scattering[71] (4) TiO2 purity[22]
(5) Dye anchoring[72]
These post-treatments have been carried out by TiCl3 electrodeposition,
Ti-isopropoxide and, the best, titanium tetrachloride (TiCl4) post-treatment [70]. The
effect of these post-treatment is believed to increase the dye loading making more efficient photon-current conversion which affect the short circuit current density (JSC),
and the current conversion efficiency (IPCE). It is also important to note that the TiCl4
treatment would not be beneficial if a given TiO2 nanoparticle film is already at the
correct potential to reach the maximum efficiency of the electron injection, which depends on the history and source of TiO2 to be made.
In addition, another report indicates that the TiCl4 pretreatment to ITO or FTO
21
enlarge the surface area of the mesoscopic film leading the improvement of JSC [73].
Xia et al. also present a new FTO/TiOX/mesoscopic TiO2 electrode which can be
applied to be the blocking layer of DSSC [74]. According to their study, the blocking layer improved reduction of the electron loss at the FTO/mesoscopic TiO2 and
FTO/electrolyte interface by a TiO2 compact layer between the FTO and mesoscopic
TiO2 layer which made by RF sputtering system. This is also another discovery
finding out a layer made by TiO2 can improve the total performance of DSSC due to
22
2.3 TiO
2morphology control
Mesoporous nanocrystalline TiO2 films provide large surface area for dye
adsorption, electrical connection with the redox electrolyte, electron diffusion and transportation. As the pore size and porosity of the TiO2 film increases, the diffusion
of electrolyte becomes easier, but the effective surface area decrease and the amount of dye adsorb less. Therefore, the morphology of the TiO2 film plays a very important
role in the high efficiency DSSC. There is a precise balance between pore size, porosity, effective surface area and thickness of TiO2 film to achieve optimum DSSC
performance. There are many different methods to modify the morphology of TiO2
films are reviewed below.
2.3-1 Different TiO2 Particle Size
Mixing different size of TiO2 particles can control the TiO2 film morphology
easily. Small size TiO2 particles have high surface area for dye adsorption, and large
size TiO2 particles can contribute larger pore for electrolyte diffusion. Thus, mixing
both large and small size of TiO2 can optimize the TiO2 film to reach higher
photocurrent.
In the research bring up by T. Miyasaka et al. [75] mixing different size of TiO2
particles can increase almost 50% of the cell efficiency. In their study, the best cell efficiency increase to 4.5% if the TiO2 average particle size is 60nm. The efficiency
increase not only because there were good electrolyte diffusion and high surface area for dye adsorption, but large size TiO2 particle in the TiO2 film could act as
light-scattering particles to efficient the light absorption.
The more specific study were reported by S. H. Kang et al. [76] They mixed large size (70 to 100nm) TiO2 particles into TiO2 film, and changed the mixing ratio to
23
light scattering particles (large size TiO2 particles) showed enhanced performance
(28%), compared with standard nanocrystalline TiO2 films.
2.3-2 Muti-Layer of TiO2 Film
Reaches brought up that using muti-layer instead of sing- layer for TiO2 film can
increase the cell conversion efficiency. The compact TiO2 layer was added between
original TiO2 film and TCO glass called blocking layer. [77, 78] This blocking layer is
usually made by dense TiO2 particles or thin TiO2 bock film, which can reduce
electron recombination at TCO glass and electrolyte interface efficiently. Also, the blacking layer can improve the adherence of TiO2 to TCO glass surface; provide
larger contact area for electron transfer from TiO2 film to TCO glass. Blocking layer
can increase both short circuit current density and open current voltage to reach higher conversion efficiency. In the reports, the addition of blocking layer increased almost 30% of cell efficiency.
One more layer on the original TiO2 layer with larger TiO2 particle size is called
light-scattering layer. [79] With this addition layer, light-scattering layer on the TiO2
film, the photocurrent of DSSC device was increased nearly40%, compared with the device without the light-scattering layer. It is because the scattering property of this TiO2 film had the light captured inside the device. In the study of B.F. Huang et al.
[80], larger particle size can have better light scattering property. They achieved a high efficiency 8.84% with light scattering layer particle radius 600-800nm.
Combine all these layers to form a muti-layer TiO2 film would be the best for
DSSCs. L. Hu et al. [81] produce a three layer TiO2 photoelectrode, included layers of
small particle size film, large particle size film and light-scattering particle film for DSSC. To decrease the contact interface between TCO glass and electrolyte and increase the electron transfer from TiO2 to electrode, smaller size particles, lower
24
porosity and more compact layer should be innermost layer. To efficient the diffusion of electrolyte to regenerate dye, the larger size TiO2 particle should deposit next and
the light scattering layer should be on the most top of the TiO2 film.
2.3-3 TiO2 Nanotube
Recently, TiO2 nanotube is also introduced to DSSCs using in TiO2 layers. The
TiO2 can be produce by electrophoretic deposition (EPD) [82], template replica
process [83-87], sol-gel method [88], hydrothermal method and anode oxidization ect. Changing the charge transport to one dimension in TiO2 nanotube can reduce the
power loss when charge transfer between TiO2 particles.
In the study of L. Zhoa et al. [83], high order TiO2 nanotube was made by
electrophoretic deposition and introduce to DSSC. The DSSCs with TiO2 nanotube
shows higher efficiency than the cells made from commercial-grade Degussa P25 TiO2 nanoparticles. One dimension structure of ordered TiO2 nanotube films provided
a high rate electron transfer along the TiO2 nanotube and expected to enhance the
diffusion of electrolyte in DSSCs.
Lee et al. [89] mixed TiO2 nanotube and TiO2 nanoparticle for TiO2 films for
DSSCs with a new type sensitizer (FL). TiO2 nanoparticles have high surface area for
dye adsorption, and TiO2 nanotube have higher electron transport rate. By mixing
both kinds of TiO2, better TiO2 films were made and introduced to DSSCs. In their
study, the TiO2 film containing 5wt% TiO2 nanotube has respectable cell conversion
efficiency 7.8%.
2.3-4 Special TiO2 Nanostructure
There are many special TiO2 nanostructures were introduced to DSSC’s TiO2
25
special TiO2 nanostructures. J. Yu et al. [90] synthesized the hollow TiO2 sphere by a
chemical introduce self-transformation strategy using urea as a base catalyst, whose walls are composed of anatase nanocrystals and exhibit hierarchical porosity. J. H. Park et al. [91] used paste method with polymer templates also can synthesize hollow TiO2 sphere successfully. TiO2 hollow structured materials not only have low density,
high specific surface area and hierarchical porous structure, but also exhibit high light-collection efficiency and fast motion of charge carriers. The DSSC with TiO2
hollow structured film has better cell efficiency than DSSC with TiO2 film
constructed by noaoparticle.
Y. J. Kim et al. [92] provided another kind of TiO2 spheres for DSSCs. The
nanoporous TiO2 sphere with a diameter about 250nm is prepared by a specially
designed solvothermal treatment. These TiO2 spheres consisted of 12-13nm TiO2
grains with ultrahigh surface area and well-developed nanopore structure. The large external pores formed among the spheres will work as a “highway” for electrolyte diffusion through thick TiO2 film and minimized the diffusion distance of electrolyte
in TiO2 nanpgrains to 125nm (half of the sphere). The TiO2 sphere structure also offer
a considerable scattering effect in long-wavelength region. Because of these advantages, the DSSC efficiency reached 8.44%, with 15% increase.
Cauliflower like TiO2 spheres was synthesized by L. Tang et al. [105], and using
as scattering center in TiO2 film of DSSC. Cauliflower-like TiO2 rough sphereswith
size about 200nm greatly enhanced the light harvesting efficiency and energy conversion efficiency of DSSC due to their high light scattering effect and large surface area compare to smooth spheres. By adding 25wt% of cauliflower like TiO2
26
2.3-5 Dispersive Polymer Addition
A more easy way to control the morphology of TiO2 film is adding dispersive
polymer into TiO2 paste before film coating, which can change the film surface area,
pore size and porosity. Poly(ethylene glycol) (PEG) [94,95], poly(methylmethacrylate) (PMMA) [96, 97] and polystyrene (PS) [14] are three common polymers used in TiO2
coating paste as addition.
Control the dispersive polymer loading in the TiO2 paste can easily change the
porosity of the TiO2 film, and increase the DSSC conversion efficiency. But there are
an optimized loading for these polymers. Overloading might cause damage of TiO2
films and decrease the cell conversion efficiency. Suitable addition of dispersive polymer improve the cell efficiency because increase the porosity of TiO2 electrode
can facilitate the electrolyte to penetrating more deeply into dye-sensitized TiO2 film,
and speed up the dye regeneration especially in gel-type electrolyte case. The pore inside TiO2 film also can act as light-scattering center for investing higher
photocurrent.[98, 99]
In the study of Y. Saito et al. [12], the PEG addition was not only affecting the porosity but also the roughness factor (rf) of TiO2 film. Increase of PEG addition the
porosity increase and the roughness factor decrease. Smaller porosity would prevent effective penetration and adsorption of dye molecules on TiO2 film and slow the
electrolyte diffusion. Higher roughness factor of TiO2 meant there was longer distance
from the dye to the TCO glass electrode and also increased electron recombination. There was an optimized loading amount of PEG (10%) which achieved 5.65% cell conversion efficiency.
Adding different molecular weight of PEG into TiO2 paste would change the
surface area and pore size of TiO2 film. [106] Larger molecular weight PEG
27
was in the contrast. Larger pores may allow more redox species diffusing inside the pore, which can reduce the resistance at TiO2/dye/electrolyte interface. However,
larger surface can make more dye adsorption to increase the photocurrent. In this study, they combine these two different TiO2 films to become a muti-layer TiO2
electrode which have high surface and larger pore size; and reach 9.04% DSSC conversion efficiency.
28
2.4 Instrument Methodologies
2.4-1 Brunauer–Emmett–TellerBrunauer–Emmett–Teller (BET) theory aims to explain the physical adsorption of gas molecules on a solid surface and serves as the basis for an important analysis technique for the measurement of the specific surface area of a material. [98]
The concept of the theory is an extension of the Langmuir theory, which is a theory for monolayer molecular adsorption, to multilayer adsorption with the following hypotheses: (a) gas molecules physically adsorb on a solid in layers infinitely; (b) there is no interaction between each adsorption layer; and (c) the Langmuir theory can be applied to each layer. The resulting BET equation is expressed by (2-15):
(2-15)
P and P0 are the equilibrium and the saturation pressure of adsorbates at the
temperature of adsorption, n is the adsorbed gas quantity (for example, in volume units), and nm is the monolayer adsorbed gas quantity. c is the BET constant, which is
expressed by (2-16):
(2-16)
E1 is the heat of adsorption for the first layer, and EL is that for the second and
higher layers and is equal to the heat of liquefaction.
Equation (2-15) is an adsorption isotherm and can be plotted as a straight line with 1/n[(P0/P) − 1] on the y-axis and φ = P/P0 on the x-axis according to
experimental results. This plot is called a BET plot. The linear relationship of this equation is maintained only in the range of 0.05 < P/P0 < 0.35. The value of the slope
29
(A) and the y-intercept (I) of the line are used to calculate the monolayer adsorbed gas quantity nm and the BET constant c. The following equations can be used:
(2-17)
(2-18)
The BET method is widely used in surface science for the calculation of surface areas of solids by physical adsorption of gas molecules. A total surface area Stotal and
a specific surface area SBET are evaluated by the following equations:
(2-19)
(2-20)
where nm is in units of volume which are also the units of the molar volume of
the adsorbent gas, N is the Avogadro's number, s is the adsorption cross section of the adsorbing species, V is the molar volume of adsorbent gas and a is the mass of adsorbent (g)
Average Pore Diameter
There are two useful equations for estimating the average pore diameter, the first one is
where d is the raverage pore diameter, VL is the volume of adsorbate necessary
to fill pores computed as normal liquid which can be the pore volume in BET analysis and A the surface area. And another one is
30
where d is the raverage pore diameter, M and ρ the molecular weight and density of adsorbate, respectively, and a the cross-sectional area of the adsorbate molecule.
By these two equations, the average pore diameter can be calculated by data we gate from BET analysis. [99]
Pore Size Distribution
Numbers of method were developed for the pore size distribution analysis. Since the development of the pore size distribution calculation method based on the
so-called Non Local Density Functional Theory (NLDFT), the methods based on this approach became widely used for the characterization of pore structure of activated carbons and other porous materials.
Detailed description of the DFT approach to the pore size analysis had been studied. Briefly, the evaluation of pore size distribution is based on the theoretical isotherms calculated for individual pores of a given adsorbate-adsorbent system. These isotherms are generated using the NLDFT where the fundamental molecular parameters characterizing the gas–gas and gas–solid interactions of the adsorption system are utilized. Mathematical procedure used to calculate pore size distribution can be described as fitting a combination of the theoretical isotherms to the experimental data. The obtained pore size distribution represents volumetric contributions of pores with different sizes whose theoretical isotherms best fit the experimental data. [100]
2.4-2 Electrochemical Impedance Spectroscopy (EIS)
31
measures the dielectric properties of a medium as a function of frequency. It is also an experimental method of characterizing electrochemical systems. This technique measures the impedance of a system over a range of frequencies, and therefore the frequency response of the system, including the energy storage and dissipation properties, is revealed. Often, data obtained by EIS is expressed graphically in a Bode plot or a Nyquist plot.
Impedance is the opposition to the flow of alternating current (AC) in a complex system. A passive complex electrical system comprises both energy dissipater (resistor) and energy storage (capacitor) elements. This technique has grown tremendously in stature over the past few years and is now being widely employed in a wide variety of scientific fields such as fuel cell testing, biomolecular interaction, and microstructural characterization. [101-104]
32
Often, EIS reveals information about the reaction mechanism of an electrochemical process: different reaction steps will dominate at certain frequencies, and the frequency response shown by EIS can help identify the rate limiting step.
Fig. 2-6 is an ideal Nyquist Plot, and there are three parts in this plot, high frequency kinetic control regime, mid-frequency diffusion control regime and low frequency charge saturation regime. The kinetic control regime shows a semi-circle impedance spectrum, which is determined by charge transfer ability when redox reation. The diffusion control regime shows a 45° line, which is affected by charge diffusion in electrodes. The charge saturation regime shows a vertical line, which is affected by electrode thickness and saturated charge diffusion.
By the EIS can come out with an equivalent circuit by simulation. And from this equivalent circuit, the further information of electrochemical properties can be studied. For DSSCs, the equivalent circuit is usually the same. The equivalent circuit of DSSCs with liquid type electrolyte shows below.
33
Chapter 3 Experimental Section
3.1 Materials
Materials for TiO2 paste
1. Titanium dioxide Degussa P25 powder
2. Poly(ethylene glycol)-block- Poly(propylene glycol)-block- Poly(ethylene glycol) (P123) from Aldrich as a binder in TiO2 paste and the chemical
structure is :
3. Polyethylene glycol (PEG) with molecular weight 35,000 and 100,000 from Aldrich as a morphology controller in TiO2 paste and the chemical structure is:
4. N-butanol (C4H9OH) from ECHO as the solvent for TiO2 paste:
5. Titanium dioxide 100nm nanoparticles from ISK for light-scattering layer
Materials for DSSCs
1. Titanium tetrachloride (TiCl4) from SHOWA for post-treatment of TiO2 film
2. Fluorine-doped tin oxide (FTO) conducting glass (8Ω/sq) from Hartford Glass 3. Ethanol (C2H5OH) from ECHO as a solvent for dye solution and the chemical
34
4. Surlyn® (SX1170-60) from SOLARONIX as the spacer and sealing material 5. N719 dye from UniRegion Bio-Tech and the chemical structure is:
Materials for electrolyte
1. Lithium iodide (LiI) from MERCK 2. Iodine (I2) from SHOWA
3. 1-methylbenzimidazole from Alfa Aesar and the chemical structure is:
4. Guanidine thiocyanate from Alfa Aesar and the chemical structure is:
5. 1-Methoxypropionitrile from Alfa Aesar as a solvent for the electrolyte and the chemical structure is:
35
3.2 TiO
2Paste Preparation
3.2-1 TiO2 paste composition
The TiO2 paste consist of commercial TiO2 nanoparticles (P25 powder, Degussa),
poly(ethylene glycol)-block-Poly(propylene glycol)-block-Poly(ethylene glycol) (P123) as binder, and polyethylene glycol (PEG) as porogen with butanol or water as solvent. In this study, we change the loading amount of PEG and different solution to control the pore morphology of TiO2 film. The composition of varies TiO2 pastes are
shown below:
Table 3-1 TiO2 paste composition in butanol solution
0% PEG 5% PEG 10% PEG 15% PEG 20% PEG
TiO2 (P25) 0.3g
P123 0.1g
PEG (35k or 100k) 0g 0.1g 0.2g 0.4g 0.6g
H2O 0.1g
Butanol 1.2g 1.4g 1.4g 1.6g 1.6g
Table 3-1 shows TiO2 paste composition in butanol solution. The water addition
is for PEG dissolution because PEG is hardly dissolved in butanol. The difference of butanol amount is for adjusting the paste viscosity to control the TiO2 film thickness
at coating process. The PEG loading is set to 0%, 5%, 10%, 15% and 20% with two different molecular weights of PEG, 35,000 and 100,000. Table 3-2 shows TiO2 paste
composition in water solution. TiO2 pastes with both kinds of PEGs. And the paste of
TiO2 scattering layer was composed of 0.3g 100nm TiO2 powder and 0.3g P123 in
36
Table 3-2 TiO2 paste composition in water solution
TiO2 (P25) P123 PEG (35k or 100k) H2O
15% PEG (35k) 0.3g 0.1g 0.4g 1.5g
15% PEG (100k) 0.3g 0.1g 0.4g 1.5g
3.2-2 TiO2 paste mixing process
The uniform TiO2 paste is important. The TiO2 nanoparticles might aggregate to
form large particles which would lose their high surface area and cause TiO2 film
crack after film coating. The mixing procedures of the paste are:
1. Mixing PEG, P123 and the solution (butanol and water) and ultrasonic disperse to the mixture mixed well.
2. Mixing TiO2 and the mixture made at first step with stirring stick in the
sample bottle.
3. Ultrasonic dispersing for 2 hours through room temperature water to prevent the solvent evaporation.
4. Stirring the sample by stirring or stirrer bar for 10 minutes.
5. Ultrasonic dispersing for 10 hours through room temperature water. 6. Settling for 1 hour but no longer than 2 hours before use.
37
3.3 TiO
2film Preparation
FTO (fluorine-doped tin oxide) conducting glass (8Ω/sq) was cleaned by ultrasonic sieving for 20 min. The TiO2 paste was coated to film on FTO glass by
doctor-blade method. The TiO2 film thickness and active area (0.28 cm2) was
controlled by adhesive tape with thickness 110 nm. After coating, the TiO2 film was
dried at room temperature in the air for one minute and removed the adhesive tape. Then, the TiO2 anode was sintered at 400℃ for 40 minutes and also for removing the
organic loads. Here, we change the PEG burn-out rate which could also control the TiO2 film morphology. The two different burn-out rates show below:
1. Burn out PEG loading in TiO2 film directly at 400℃ for 40minutes.
2. The TiO2 film was baked at 100℃ for 30 minutes and the temperature was
raised to 400℃ in 15 minutes then burned out PEG loading and sintered for 40min at 400℃.
Backing the TiO2 electrode at 100 ℃ for 30min could let PEG have time and
energy to aggregate and form larger size pores after being burned out. After cooling down, the adhesive tape was applied again to define the same area for the scattering TiO2 layer coating. The scattering TiO2 layer was deposited by spin-coating with 600
rpm spin speed for 25 seconds and the TiO2 anode was also sintered at 400℃ for
30minutes after remove the adhesive tape. Figure 3-1 shows the schematic diagram of coating process.
![Fig. 1-1 The path length, in units of Air Mass, changes with zenith angle. [3]](https://thumb-ap.123doks.com/thumbv2/9libinfo/8447910.182302/13.892.192.727.318.716/fig-path-length-units-mass-changes-zenith-angle.webp)