THEORY AND METHODS
Development and validation of an instrument to measure
perceived neighbourhood quality in Taiwan
M-J Yang, M-S Yang, C-H Shih, I Kawachi
. . . . J Epidemiol Community Health 2002;56:492–496
Study objectives:Social epidemiologists have hypothesised that neighbourhood quality may exert an important contextual influence on mental and physical health. However, validated instruments do not exist for measuring neighbourhood quality in Taiwan. A self reported instrument to measure perceived neighbourhood quality in Taiwan was developed and tested.
Design:Community survey.
Setting:Southern Taiwan, including the metropolitan Kaohsiung area and eight surrounding commu-nities, representing urban, suburban, and rural districts.
Participants:A total of 1084 residents, aged 18 to 75, were surveyed during 1999 to 2000. Main results: Using factor analysis with varimax rotation, three subscales explained 54.8% of the variance in our 15 item Neighbourhood Quality Index: perceived social capital (Cronbachα=0.84), perceived security (α=0.78), and adequacy of services and facilities (α=0.67). Lower perceived neigh-bourhood social capital (odds ratio, OR, 1.26; 95% CI: 1.21 to 1.32), lower neighneigh-bourhood security (OR 1.37; 95% CI: 1.26 to 1.48), and inadequate neighbourhood services and facilities (OR 1.17; 95% CI: 1.06 to 1.28) were all related to higher residential dissatisfaction.
Conclusions:A Neighbourhood Quality Index was developed for use in Taiwan with good internal consistency and test-retest reliability, as well as convergent validity. Future studies will examine the association between this index and measures of individual mental and physical health.
I
t has long been hypothesised that residential environment exerts a contextual effect on mental health.1–3In other words, mental health is the product not just of individual level attributes, but also the social context in which people lead their daily lives. For instance, in their classic study of Chi-cago neighbourhoods, Faris and Dunham4
found increasing rates of admission for schizophrenia the closer residents lived near the inner city. Their interpretation was that social isolation and disorganisation in the inner city housing areas produced higher rates of psychiatric disorder. Similarly, Ross5
found that the residents of poor, neighbourhoods with higher concentrations of single female headed households exhibited higher levels of depression than residents of more advantaged neighbourhoods. More recent multilevel studies have shown an independent contextual influence of neighbourhood qual-ity on individual psychiatric symptoms and levels of psycho-logical distress.6 7Despite burgeoning research in this area, few
studies have attempted to describe contextual variation in mental health within Asian societies. The Taiwan Psychiatric Epidemiological Project reported that psychosomatic disorder and generalised anxiety disorder were more prevalent among residents of townships compared with those in the metropolis and village. It was postulated that social changes associated with rapid industrialisation and greater population mobility explained this phenomenon.8 9In southern Taiwan, Cheng9
found that minor mental disorders were more prevalent among rural young women. He attributed this finding to social selection—that is, those who were mentally ill were less likely to move to urban areas. The results of a recent pilot study on neighbourhood environment and mental health by Yang 10
disclosed that community socioeconomic condition and perceived social support from neighbours were significantly associated with individual mental health status. Yet despite these clues about the existence of contextual variation in mental health, research has been hampered by the lack of a validated instrument to assess neighbourhood quality. Inves-tigators have relied on existing measurements, often derived
from the population census, to capture relevant aspects of neighbourhood quality, for example, through variables such as the proportion of households living below the poverty thresh-old, or the percentage of single female headed households.2 3
With notable exceptions,11
few attempts have been made to directly measure residents’ perceptions of their neighbour-hood quality. Nor is there general agreement about which
aspects of neighbourhood environment may be relevant to
mental health. Neighbourhood quality is likely to be a multi-dimensional construct.2 3
Accordingly, we set out in this study to develop and validate an instrument, for use in Taiwanese society, to capture residents’ perceptions of neighbourhood quality. The resulting Neighbourhood Quality Index has broad utility in terms of use in future aetiological studies, as well as for the planning of neighbourhood level interventions to pro-mote mental health.
METHODS
Subjects and survey implementation
We used a multilevel sampling strategy to recruit residents from the Metropolitan Kaohsiung area in southern Taiwan. Residents were sampled from the following communities to represent urban, suburban, and rural areas: SanMin District, Kaohsiung City and Feng Shang city Kaohsiung County (urban); JenWu, ALien, ZiGuan, and TianLiao Hsiang, Kaohsi-ung County (suburban); and SanMin Hsiang, TaoYuan Hsiang, and MaoLin Hsiang, Kaohsiung County (rural). By a random sampling procedure proportional to the population structure, 1500 residents aged 18 to 75 were recruited during 1999–2000 for this interview study. Thirty subjects were selected for test-retest reliability. The questionnaire was self completed. Research assistants distributed the surveys in person and col-lected them. For respondents who were illiterate, the research assistants administered the questionnaire through face to face interview. The overall response rate to our survey was 73.1%. We excluded surveys with insufficient data, leaving 1084 valid
See end of article for authors’ affiliations . . . . Correspondence to: Dr I Kawachi, Department of Health and Social Behavior, Harvard School of Public Health, 677 Huntington Avenue, Boston MA 02115, USA; Ichiro.Kawachi @channing.harvard.edu Accepted for publication 7 November 2001 . . . .
forms. Although we do not have information on non-respondents, comparison of the sociodemographic character-istics of our respondents (for example, household income and educational attainment) with data from the Department of Statistics, Ministry of the Interior, Republic of China, showed that our survey sample did not substantially differ from the national sample.
Questionnaire
We selected the items on our Neighbourhood Quality Index based on prior literature1–3 11 12
as well as the responses from focus groups carried out in a previously reported pilot study.10 13
The index, comprised initially of 16 items, focused on multiple dimensions of neighbourhood experience, including residents’ perceptions of neighbourhood security, community participation, community social control and collective efficacy, satisfaction with the physical environment (quietness, spa-ciousness, and adequacy of facilities and services), weak ties among neighbours, and social support. A 4 point Likert style response scale was used to gauge how residents perceived their experience within their residential neighbourhoods, from total agreement to total disagreement. The translated English version of our Neighbourhood Quality Index is included in the appendix. Residential satisfaction was assessed with a single item (satisfied/not satisfied).
Statistics
Frequency distributions and percentages were used for variable description. Pearson’s correlation was used for
test-retest reliability. Factor analysis with varimax rotation was used to examine the construct of Neighbourhood Quality. The internal consistency reliability of each resulting factor was assessed by Cronbach’s α. The overall neighbourhood quality score was derived by linear summation of responses to each item (1 for “strongly agree”, 4 for “strongly disagree”). Thus, the higher the score, the poorer the respondent’s perception of their neighbourhood quality. Logistic regression was used to examine the associations between each subscale of the Neighbourhood Quality Index and residential satisfac-tion (satisfied versus not satisfied). Each subscale was dichot-omised at the median cut off point, for example, “low security” versus “high” security.
RESULTS
Of the 1084 respondents, 50.4% were women and 49.6% were men. Their average age was 40.9 (SD 13.7), ranging from 18 to 75. Most of them were married (71.5%) and from urban or suburban communities (90.8%); 9.2% resided in aboriginal villages. Excluding non-respondents, 47.7% of the surveyed residents reported earning a monthly income of more than US $1000. Though the majority of respondents (50.9%) reported 7 to 12 years of education or more, a substantial pro-portion (31.3%) had less than six years of formal education (including illiterate respondents). More than 50% of the respondents had resided in their present neighbourhood for more than 16 years; 73.3% reported that they were satisfied with their present neighbourhood (table 1). The test-retest Table 1 Characteristics of survey respondents and their mean (SD) score* on neighbourhood quality index
N (%) Perceived socialcapital Perceived security Perceived adequacy of facilities Sex Male 537 (49.6) 18.18 (5.40) 9.27 (2.80) 6.56 (2.09) Female 545 (50.4) 17.78 (5.69) 9.15 (3.03) 6.32 (2.26) Neighbourhood characteristics
Urban: FengShan City and SanMin District 441 (40.7) 18.67 (5.76) 9.96 (2.95) 5.88 (2.14) Suburban: JenWu Hsiang, ALien Hsiang, TianLiao Hsiang, and
ZiGuan Hsiang 543 (50.1) 18.14 (5.25) 8.92 (2.78) 6.78 (2.14) Rural: SanMin Hsiang, TaoYuan Hsiang, and MaoLin Hsiang 100 (9.2) 14.07 (4.58) 7.40 (2.49) 6.99 (2.10)
Age means (SD) 40.94 (13.72) Educational level <7 years or illiterate 337 (31.3) 17.30 (5.25) 8.70 (2.94) 6.34 (2.22) 7–12 years 548 (50.9) 17.96 (5.84) 9.43 (2.94) 6.45 (2.17) >12 years 192 (17.8) 19.28 (4.98) 9.41 (2.82) 6.55 (2.16) Religion Christian 126 (11.7) 15.25 (5.01) 7.98 (2.63) 7.01 (2.14) Buddhism, Taoism, and Folk Religion 832 (77.3) 18.17 (5.50) 9.35 (2.90) 6.36 (2.19) Other or none 118 (11.0) 19.66 (5.56) 9.53 (3.17) 6.32 (2.10) Occupation
Home maker 223 (20.7) 16.81 (5.22) 8.68 (2.83) 5.92 (2.16) Farmer and factory worker 306 (28.4) 18.12 (5.53) 8.99 (2.58) 6.77 (1.96) Governmental worker 130 (12.1) 18.74 (5.42) 9.45 (3.01) 6.64 (2.32) Professional and merchant 264 (24.5) 18.75 (5.89) 9.97 (3.08) 6.60 (2.22) Unemployed 154 (14.3) 17.71 (5.19) 8.92 (3.09) 6.11 (2.25) Marital status
Married 762 (71.5) 17.81 (5.67) 9.18 (2.97) 18.85 (5.14) Single 229 (21.5) 9.48 (2.81) 6.84 (2.11) 17.27 (5.44) Other 75 (7.0) 17.27 (5.44) 8.56 (2.76) 5.85 (2.09) Monthly income (US $)
< $1000 264 (24.5) 17.57 (6.34) 8.84 (3.08) 6.61 (2.30) $1000 or more 513 (47.7) 18.48 (5.14) 9.58 (2.85) 6.36 (2.07) Missing 299 (27.8) 17.48 (5.38) 8.88 (2.82) 6.42 (2.24) Duration of residence in present neighbourhood (y)
<6 151 (14.0) 19.20 (6.10) 9.41 (3.17) 6.54 (2.22) 6–10 151 (14.0) 19.28 (6.22) 9.87 (2.74) 6.77 (2.56) 11–15 186 (17.3) 18.42 (5.35) 9.25 (2.84) 6.60 (2.20) >15 588 (54.7) 17.24 (5.14) 8.98 (2.91) 6.27 (2.15) Whether or not dissatisfied with neighbourhood
Satisfied 795 (73.3) 16.19 (4.85) 8.32 (2.57) 5.95 (1.99) Dissatisfied 289 (26.7) 22.91 (4.21) 11.63 (2.43) 7.77 (2.14) *A higher score denotes lower satisfaction with neighbourhood quality.
reliability of our instrument was 0.80. Factor analysis with varimax rotation was performed, dropping those items with eigenvalue less than 1 and factor loading less than 0.40. The resulting index, with 15 items, could be further extracted into three factors: perceived neighbourhood social capital, per-ceived neighbourhood security, and perper-ceived adequacy of services and facilities, with Cronbach’sαof 0.85, 0.78, and 0.67, respectively. In total, 54.8% of the variance in responses to our index could be explained by these three factors (table 2).
FACTOR 1.
Perceived neighbourhood social capital
The eight items included: participating in activities with neighbours; greeting each other during encounters; having mutual concern for each other; providing assistance during emergencies; being able to find somebody to talk with during need; maintaining public hygiene in the neighbourhood; solv-ing problems together; and feelsolv-ing good about this neighbour-hood.
FACTOR 2.
Perceived neighbourhood security
The four items included: sense of quiet and peace in the neighbourhood environment; sense of a spacious and roomy neighbourhood; sense of order and being secure in this neigh-bourhood; and sense of being safe in this neighbourhood.
FACTOR 3.
Perceived adequacy of services and facilities
The three items in this factor included: adequate and conven-ient lighting; convenconven-ient transportation; and public facilities. Perceived neighbourhood quality varied with respondent’s income, marital status, and duration of residence. Those who were single tended to perceive a higher degree of neighbour-hood social capital and security. Duration of residence in one’s neighbourhood was associated with higher perceptions of neighbourhood quality. Higher incomes were associated with more negative perceptions of neighbourhood quality (table 1). Discriminatory analysis showed that the overall neighbour-hood quality score had a predictive value of 80.4% in terms of
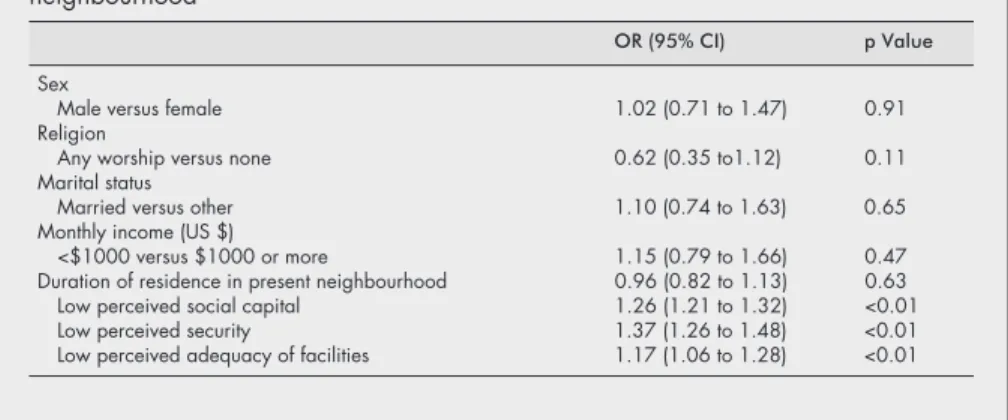
distinguishing residents who were dissatisfied with their resi-dential situation. After controlling for sex, religion, marital status, income, and duration of residence, backward stepwise logistic regression indicated that all three subscales were each associated with neighbourhood dissatisfaction. The odds ratios for being dissatisfied were 1.26 (95% confidence intervals (CI): 1.21 to 1.32) for lower perceived neighbourhood social capital, 1.37 (95% CI: 1.26 to 1.48) for lower neighbour-hood security, and 1.17 (95% CI: 1.06 to 1.28) for lower adequacy of services and amenities (table 3).
DISCUSSION
We have developed for the first time a reliable and validated instrument to measure neighbourhood quality in the Taiwan-ese setting. Our factor analysis confirmed that neighbourhood quality is a multidimensional construct, with three factors encompassing perceived neighbourhood social capital, neigh-bourhood security, and adequacy of services and amenities. Fifty four per cent of the total variance in responses to our index could be explained by these three factors. However, it is possible that we missed other aspects of the neighbourhood Table 2 Factor analysis of neighbourhood quality index
Mean (SD) Factorloading Varianceexplained (%) Cronbachα Factor 1: Perceived social capital 17.98 (5.55)* 38.3 0.84
Participating in activities together 2.66 (1.00) 0.58
Greeting each other 1.88 (1.47) 0.47
Mutual concern for each other 2.00 (0.87) 0.78 Providing assistance during an emergency 2.13 (0.92) 0.79 Being able to find somebody to talk with when in need 2.61 (0.97) 0.72 Maintaining public hygiene in the neighbourhood 2.33 (0.91) 0.64 Solving problems altogether 2.33 (0.92) 0.71 Feeling happy with the neighbourhood 2.10 (0.83) 0.54
Factor 2: Perceived security 9.20 (2.92)* 9.4 0.78
Quiet and peaceful environment 2.26 (0.97) 0.70 Spacious and roomy environment 2.25 (0.92) 0.68 Order and good public security in this neighbourhood 2.41 (0.94) 074 Feeling safe in this neighbourhood 2.31 (0.91) 0.70
Factor 3: Adequacy of services and facilities 6.44 (2.18)* 7.1 0.67
Adequate lighting 2.14 (0.91) 0.67
Convenient transportation 2.04 (0.91) 0.79 Adequate public facilities 2.27 (1.00) 0.65
Overall score 33.58 (8.82)*
(median 33, range 15–57)
Variance explained (%) 54.8
*Higher scores indicate lower perceived neighbourhood quality (see text).
Key points
• Social epidemiologists have hypothesised that neighbour-hood quality may exert an important contextual influence on mental and physical health.
• Validated instruments do not exist for measuring neighbour-hood quality in Taiwan. We developed and tested a 15 item self reported instrument to measure perceived neighbourhood quality among 1084 residents of nine com-munities in southern Taiwan.
• Based on factor analysis with varimax rotation, three subscales explained 54.8% of the variance in reported neighbourhood quality: perceived social capital (Cron-bach’s α=0.84), perceived security (α=0.78), and ad-equacy of services and facilities (α=0.67).
• All three subscales were significantly associated with residential satisfaction.
• Further studies are needed to examine the association between our Neighbourhood Quality Index and mental and physical health outcomes.
environment that might be relevant to mental health outcomes. A longer list might include aspects of the physical environment (for example, crowded and dilapidated housing, overcrowding, noise, pollution, traffic), economic power relations, individual autonomy, as well as less tangible exposures such as “incivilities” (abandoned lots, graffiti, and other forms of vandalism), and the overall reputation of a neighbourhood.1–3
In contrast with previous attempts to capture neighbourhood quality through census derived prox-ies (for example, percentage households in poverty), our index directly asked residents about their perceptions of the service environment, security, and quality of social interactions. The main limitation of census derived measures of neighbourhood quality is that they do not investigate the potential mechanisms through which residential context might influence health. Measures such as “percentage households in poverty” are themselves markers for other exposures, such as inadequate services and amenities, or perceptions of crime and disorder. Furthermore, census derived measures typically do not tackle aspects of social interaction, such as neighbourhood social cohesion or social capital. Our index therefore represents a potential addition to the range of variables routinely extracted from the population census that has characterised much of the existing literature on neighbourhoods and health. In con-ceptual terms, our approach to characterising neighbourhood quality is analogous to Pearlin’s theory of the stress process as it relates to mental health outcomes.14
Lack of neighbourhood security and inadequacy of facilities could be considered to be ambient stressors, while neighbourhood social capital could be considered to be moderating resources. It is probably the balance of stressors and resources in a neighbourhood that determines health outcomes, over and above individual attributes. The major limitation of our approach is that reliance on self reports of neighbourhood quality is susceptible to bias and contamination by general subjective wellbeing. For example, it is possible that people with depressive symptoms are less likely to rate their neighbourhood favorably, and to report overall dissatisfaction with their residential environ-ment. The cross sectional nature of our study makes it difficult to drawn causal inferences. It remains to be determined whether our Neighbourhood Quality Index is associated with individual health outcomes, net of individual characteristics, including negative affectivity. Although studies have not yet reported an association between social capital and health at the neighbourhood level, aggregate measures of social capital have been found to correlate with state level mortality, self rated health,15–17
and crime in the United States.18
Consid-erable interest and debate has surrounded the importation of the concept of social capital in community health.19–21
Researchers have pointed out the limitations of the concept in accounting for variations in population health status,
includ-ing the observation that an overly cohesive community or society may actually have detrimental effects on individual health.22 23An exclusive focus on social cohesion may also risk
overlooking economic power differentials within and across neighbourhoods, resulting in a truncated diagnosis of why some communities are healthy and others are not.20
ACKNOWLEDGEMENTS
The authors would like to acknowledge Ms Penelope Chen for her help with preparation of this manuscript.
APPENDIX
Translated items from the Neighbourhood Quality Index 1 Neighbours are willing to obey community regulations 2 Neighbourhood is quiet and peaceful
3 Neighbourhood is spacious and roomy 4 Neighbourhood has adequate lighting 5 Neighbourhood has convenient transportation 6 Neighbourhood has adequate public facilities 7 Neighbourhood is safe
8 Neighbourhood is orderly with good public security 9 Neighbours enjoy participating in community activities
together
10 Neighbours chat and greet each other
11 Neighbours are mutually concerned for each other 12 Neighbours are willing to provide assistance when I am in
need
13 Being able to find someone to talk with in my neighbour-hood when in distress
14 Neighbours are willing to maintain public hygiene in the neighbourhood
15 Neighbours are willing to solve problems together 16 Feeling happy with my neighbourhood
. . . . Authors’ affiliations
M-J Yang, C-H Shih,Department of Psychiatry, College of Medicine, National Cheng Kung University, Taiwan
M-S Yang,School of Nursing, Kaohsiung Medical University, Taiwan I Kawachi,Department of Health and Social Behavior, Harvard School of Public Health, USA
Funding: the research was supported by grant (NSC 87-2413-H037-004 and NSC 89-2413-H-182–0030SSS) from National Science Council. Dr Kawachi is supported in part by the MacArthur Foundation Network on SES and Health.
Conflicts of interests: none.
Table 3 Backward stepwise logistic regression of dissatisfaction with neighbourhood
OR (95% CI) p Value Sex
Male versus female 1.02 (0.71 to 1.47) 0.91 Religion
Any worship versus none 0.62 (0.35 to1.12) 0.11 Marital status
Married versus other 1.10 (0.74 to 1.63) 0.65 Monthly income (US $)
<$1000 versus $1000 or more 1.15 (0.79 to 1.66) 0.47 Duration of residence in present neighbourhood 0.96 (0.82 to 1.13) 0.63 Low perceived social capital 1.26 (1.21 to 1.32) <0.01 Low perceived security 1.37 (1.26 to 1.48) <0.01 Low perceived adequacy of facilities 1.17 (1.06 to 1.28) <0.01
REFERENCES
1 Macintyre S, Ellaway A. Ecological approaches: rediscovering the role of the physical and social environment. In: Berkman LF and Kawachi I, eds.Social epidemiology. New York: Oxford University Press, 2000:332–48.
2 Macintyre S, Maciver S, Sooman A. Area, class and health; should we be focusing on places or people?Journal of Social Policy
1993;22:213–34.
3 Macintyre S, Ellaway A. Neighborhoods and health: overview. In: Kawachi I, Berkman LF, eds.Neighborhoods and health. New York: Oxford University Press (in press).
4 Faris RH, Dunham HW.Mental disorders in urban areas. Chicago, IL: University of Chicago Press, 1939
5 Ross CE. Neighborhood disadvantage and adult depression.J Health Social Behav 2000;41:177–87.
6 Aneshensel CS, Sucoff CA. The neighborhood context of adolescent mental health.J Health Social Behav 1996;37:293–310.
7 Yen IH, Kaplan GA. Poverty area residence and changes in depression and perceived health status: evidence from the Alameda County Study. Int J Epidemiol 1999;28:90–4.
8 Cheng TA. A community study of minor psychiatric morbidity in Taiwan. Psychol Med 1988;18:953–68.
9 Yeh EK, Hwu HG, Lin TY. Mental disorder in Taiwan: epidemiological studies of community population. In: Lin TY, Tseng WS, Yeh EK, eds. Chinese societies and mental health. London: Oxford University Press, 1995.
10 Yang MJ. Neighborhood experience and mental health. [In Chinese]. Chang Gung Med J 2000;23:747–54.
11 Sampson RJ, Raudenbush SW, Earls F. Neighborhoods and violent crime: a multilevel study of collective efficacy. Science
1997;277:918–24.
12 Lochner K, Kawachi I, Kennedy BP. Social capital: a guide to its measurements.Health & Place 1999;5:259–70.
13 Yang MJ, Shih CH, Zheng SF. Community effects on individual mental health. [In Chinese].Community Development Journal 1997;78: 134–40
14 Pearlin LI, Skaff MM. Stressors and adaptation in late life. In: Gatz M, ed.Emerging issues in mental health and aging. Washington DC: American Psychiatric Association Press, 1995.
15 Kawachi I, Kennedy BP, Lochner K,et al. Social capital, income inequality, and mortality.Am J Public Health 1997;87:1491–8. 16 Kawachi I, Kennedy BP, Glass R. Social capital and self-rated health: a
contextual analysis.Am J Public Health 1999;89:1187–93. 17 Kawachi I. Social capital and community effects on population and
individual health.Ann NY Acad Sci 1999;896:120–30.
18 Kawachi I, Kennedy BP, Wilkinson RG. Crime: social disorganization and relative deprivation.Soc Sci Med 1999;48:719–31.
19 Baum FE, Bush RA, Modra CC,et al. Epidemiology of participation: an Australian community study.J Epidemiol Community Health
2000;54:414–23.
20 Lynch J, Due P, Muntaner C,et al. Social capital—is it a good investment strategy for public health?J Epidemiol Community Health 2000;54:404–8.
21 Kawachi I, Berkman LF. Social cohesion, social capital, and health. In: Berkman LF, Kawachi I, eds.Social epidemiology. New York: Oxford University Press, 2000:174–90.
22 Belle D.Lives in stress: women and depression. Beverly Hills: Sage, 1982.
23 Kawachi I, Berkman LF. Social ties and mental health.J Urban Health 2001;78:458–67.