Development of Digital Image Correlation Method to Analyze
Crack Variations of Masonry Wall
Shih-Heng Tung1,*, Ming-Hsiang Shih2, Wen-Pei Sung3 1
Department of Civil and Environmental Engineering, National University of Kaohsiung, Kaohsiung, Taiwan
2
Department of Construction Engineering,
National Kaohsiung First University of Science and Technology, Kaohsiung, Taiwan
3
Department of Landscape Design and Management, National Chin-Yi University of Technology, Taichung, Taiwan
Abstract
The detection of crack development in a masonry wall is an important task for investigating the earthquake resistant capability of the masonry structures. Traditionally, inspecting the structure and documenting the findings are done manually. The procedures are time-consuming, and the results are sometimes inaccurate. Therefore, the digital image correlation (DIC) technique is developed to identify the strain and crack variations. This technique is non-destructive for inspecting the whole displacement and strain field. Tests on two masonry wall samples were performed to verify the performance of the digital image correlation method. The phenomena of micro cracks, which have not been found during previous manual inspection, strain concentration situation and non-uniform deformation distribution are successfully identified using DIC. The crack formation tendencies on masonry wall can be observed at an earlier stage by this proposed method. These results show a great application potential of the DIC technique for various situations such as inspecting shrinkage induced cracks in fresh concrete, masonry and reinforced concrete structures, and safety of bridges.
Keywords: digital image correlation technology, crack observation, masonry structure, deformation measurement.
1. Introduction
Measuring and analyzing the strain distribution is an important task in some civil engineering and mechanical engineering related research fields, especially for solving problems related to anisotropic materials or stress concentration. The digital image correlation (DIC) method is a new optical measurement technique to offer low-cost strain distribution with high precision. Chu et al. (Chu et al., 1985) developed a measurement technique in 1985 by combining deformation theory and
1,*
Author to whom all correspondence should be addressed. Phone: +886-7-591-9223, Fax: +886-7-
digital image correlation method, and applying the interpolation theory to expand its applications with successful referenced examples. In 1991, Sutton et al. (Sutton et
al., 1991) noted noise in the measured data and proposed a method of reducing the
noise to less than 0.01 pixels.
Many ancient European buildings were built with stone and mortar. French scholars Raffard et al. (Raffard et al., 2001) studied the mechanical behaviour of some of these buildings in 2001 by applying the DIC method to measure the deformation of mortar for providing a further insight into the mechanics of mortar. Dost et al. (Dost et al., 2003; Dost et al., 1999) acquired images of nano scale objects using an atomic force microscope that helps them to not only observe the nano materials, but also analyze nano-displacement by using the DIC technique for detecting nano-cracks.
The seismic resistance capability of a structure is influenced significantly by the amount of wall. According to the survey report for 921 Chi-chi Earthquake (Shiao et
al., 1999), most arcade row houses collapsed almost in parallel with the street
because of relatively low wall amount along the street. Therefore, how to identify the minimum wall amount to resist earthquake loading with consideration of space planning in the buildings is an important research topic. The wall deficiency is very difficult to detect in practical experiments because crack formation and development cannot be measured accurately. Therefore, the digital image correlation method is proposed in this research to observe the surface deformation of brick wall; the feasibility of applying this method for crack observation of non-homogeneous materials is also studied.
2. Basis Theory of Strain Analysis using the Digital Image
Correlation Method
Before test the so-called “structural speckle” (Tung et al., 2005) will be established on the specimen surface. It makes the non-uniform distribution of grey scale. This gray scale distribution characteristic will be used in the DIC method to compare the deformed and un-deformed images in order to obtain the relative positions. Thus, displacement vectors of various image points are calculated, whereas other physical values, such as normal strains, shear strain and von Mises strain field, can also be inferred.
2.1 Two-Dimensional Digital Image Correlation Method
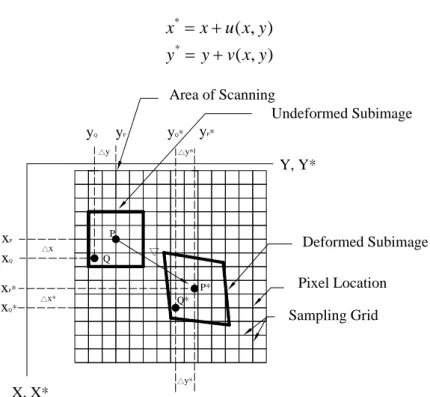
The digital image correlation method is widely applied in the field of image identification technique. By comparing the local correlation of two images, the relationship between deformed and un-deformed images can be identified. As shown in Fig. 1, the central point prior to deformation is point P; it is changed to point P* after deformation. The functional relationship is expressed as:
) , ( * y x u x x (1a) ) , ( * y x v y y (1b) Y, Y* X, X* △y* △y* △x △x* P Q Q* P* △y yQ yP yQ* yP* xP xQ xP* xQ* ▽ Area of Scanning Undeformed Subimage Deformed Subimage Pixel Location Sampling Grid
Fig. 1: Schematic drawing of relative location of sub-images of deformed and un-deformed images on surface. (Chu et al., 1985)
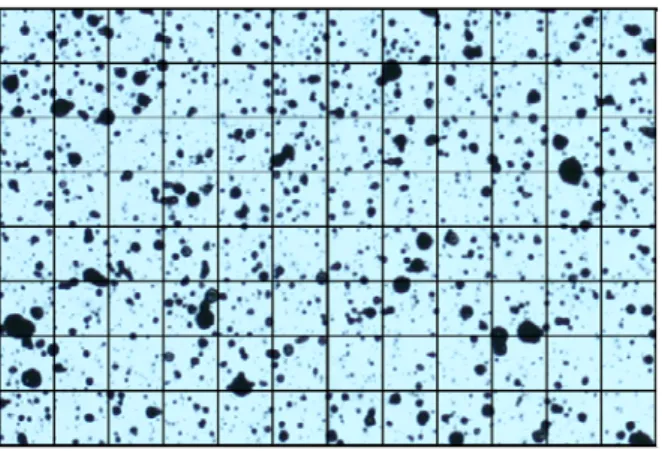
For un-deformed images, finite element method (FEM) is used to divide the images into several sub-images as shown in Figure 2. Assuming the un-deformed sub-image is A and deformed sub-image is B, the correlation coefficient (Equation 2) (Chu et al., 1985) is used to define the relationship between sub-images A and B. The correlation coefficient will be equal to 1 when the sub-image B is exactly the sub-image A after deformation.
2 2 ~ ~ ij ij ij ij g g g g COF (2) Where, g and ij gij
~ are grey scale of image A on coordinate (i, j) and image B on
coordinate (i, j ), respectively. And coordinate (i, j ) of image B corresponds to coordinate (i,j) of image A.
Fig. 2 Schematic Drawing of Sub-images (Grids) on Surface (Tung et al., 2005)
If optimal function parameters for every sub-image are recognized, the corresponding coordinates of every deformed or un-deformed sub-image can be obtained. Accordingly, the displacement and strain field can be computed individually.
2.2 Calculation of Strain Field Green-Lagrange’s tensor E is defined as:
1
1 2
T
E F F (3)
Where, F is gradient tensor of displacement field, and I is unit matrix. Tensor E is rewritten into the function of displacement field as follows: (Chu et al., 1985)
, ,
, ,1 1
2 2
ij i j j i k i k j
E u u u u (4)
Where,i,j,k(x,y), and ui j, ui j. Strain is computed below: 2 2 1 2 y x x xx u u u x x x (5a) 2 2 1 2 y x y yy u u u y y y (5b) 1 1 2 2 y y y x x x xy u u u u u u y x x y x y (5c)
2 2 2
1 3 1 3 2 3 vM (5d)WherevM is the von Mises strain (Mendelson, 1983), 1 and 3 are the major and minor principle stresses respectively.
3. Masonry Wall Test
Since brick and cement mortar are brittle, the crack developing process may provide a basis of destruction pattern unless this process can be accurately observed. The feasibility of crack observation using the digital image correlation method was carried out following the method as described in the following sections.
3.1 Design of Test Block and Loading Method
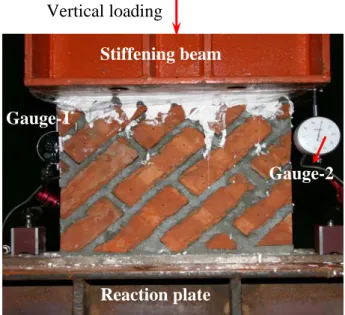
A 45°-brick wall prepared according to DIN EN 1052-1 was used (Fig. 3). The brick wall has an external width of 40 cm, and height of 30cm consisting of 19.5×8.7×5cm (L×B×T) bricks jointed together with shrink-free mortar. The specimen was placed under a stiffening beam to be compressed using the displacement-controlled test method using a 1000-kN MTS hydraulic jack at a speed of 1mm/min until the bearing force began to decrease.
3.2 Test Results
(1) No obvious destruction is visualized for the test block subject to loadings of less than 182 kN. When 182 kN is reached, cracks start to develop obviously as indicated by the dial gauge readings and the audible breaking noise. Extremely fine cracks can be seen at the lower left corner of Fig. 3.
(2) In the loading reaches 200 kN, the load cell shows no further increase in the force reading indicating that the strength of the test block is 200 kN. At this time, the crack width increases by about 1mm, and gypsum shedding is found
Gauge-1
Stiffening beam
Fig. 3: Brick wall and test settings Vertical loading
Gauge-2
at the upper part of the test block.
(3) As the loading proceeds to 112 kN, no more loading capacity can be added, and this test is completed whereas block-like shedding of mortar begins to occur.
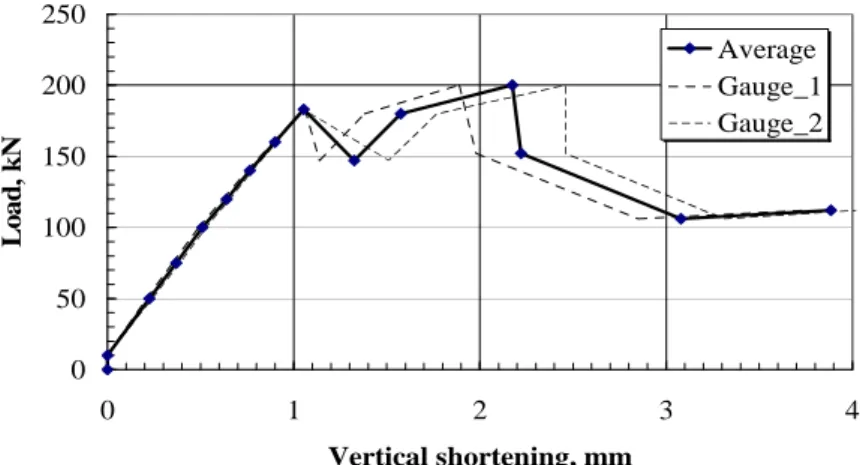
The relationship between load and deformation based on the vertical shortening of the test block recorded on dial gauge and the loading capacity recorded on load cell is shown in Fig. 4. It reveals that when the load is added up to 182 kN, the deformation of brick wall increases sharply whereas the recorded force reduces suddenly that corresponds to the occurrence of cracks. When the brick is continuously loaded to exceed the previous maximum value, the cracks do not pass through the whole test block. When the load reaches 200 kN, similar observation as for 182 kN is observed, and the load can no longer increase. These observations are possibly caused by the fact that existing cracks extend and pass through the whole test block or new cracks start to develop. At last the load is increased from 106 kN to 112 kN, the brick wall is compressed by 1 mm, which indicates the level of destruction.
As shown in Fig. 4, the measured displacement prior to crack formation in gauge-1 is the same as that in gauge-2, but differs markedly when the load reaches gauge-182 kN. Hence, the test block is prone to rotate clockwise, leading to different displacements at both sides of brick wall.
4 Image Acquisition and Analysis 4.1 Equipment
A Canon EOS 300D DSLR camera with a Canon EF-S 18-55mm f/3.5-5.6 zoom lens (focal length of 55 mm is used in the test), which has the field view to cover the entire test block, is mounted in front of the test block. The camera using a forced flash is controlled with a remote-controller to shoot high quality images for avoiding vibrations caused by manual operation of the camera, and this will reduce the analyzing errors. The maximum resolution is 3072×2048, and the image is stored in JPEG format.
Fig. 4: Relationship bearing force and deformation 0 50 100 150 200 250 0 1 2 3 4 Vertical shortening, mm Lo a d , k N Average Gauge_1 Gauge_2
4.2 Image Analysis
All analytical procedures are proceeded according to the principle listed in Section 2.1 of this paper. The size of sub-images, which influences the resolution of strain analyses were first determined. Larger sub-images offer higher level of displacement accuracy but fail to show local strain variations. In this paper, the sub-image size is fixed at 32 pixels; the actual length of a pixel is 0.19 mm based on the calibration results obtained from previously measured photos. The analytical accuracy of this procedure is about 0.01 pixels, and the actual displacement resolution is about 0.0019mm.
5. Analytical Results of Digital Images
The distribution of displacement fields and strain fields in different loading phases is obtained from the analytical results.
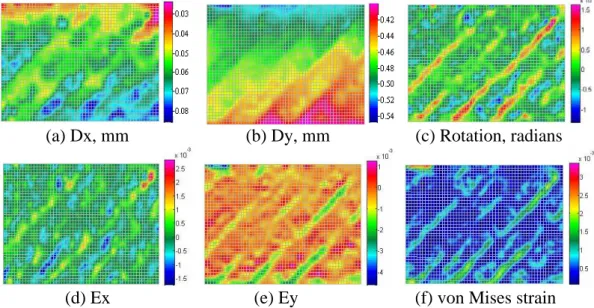
Fig. 5 and Fig. 6, which depict displacement and strain fields at two stages of the test, show horizontal displacement (Dx), vertical displacement (Dy), counter clockwise rotation, horizontal strain (Ex), vertical strain (Ey) and von Mises strain.
(a) Dx, mm (b) Dy, mm (c) Rotation, radians
(d) Ex (e) Ey (f) von Mises strain Fig. 5: Displacement and strain field by loading = 50 kN; grid size 32 pixels
(d) Ex (e) Ey (f) von Mises strain Fig. 6: Displacement and strain field by loading = 182 kN; grid size 32 pixels The following key considerations are induced from the observed results shown in Fig. 5 and Fig. 6.
(1) Inhomogeneous brick-mortar composite leads to non-uniform deformation: Fig. 5 and 6 represent the non-uniform displacement and strain distribution. Because the 45°-trend non-uniform distribution matches the laying direction of brick wall, the validity of image analysis procedure can be proved. The result, which shows larger strains exist in the mortar agrees with the fact that brick has a higher stiffness than mortar. And, the non-uniform displacement is clearly found even when the brick is subject to 50-kN loading. Thus, the analytical procedure developed by the authors has a high level of accuracy. Although the cement mortar is a very brittle material and only tiny deformation can take place in it, all deformations can also be clearly identified using this procedure.
(2) Crack identification according to displacement field: As shown in Fig. 5(b), a region is considered to be a complete block if its colour of displacement distribution changes gently. Although the change of colour scale can be obviously found from the y-displacement field in Fig. 5(b) (up to down), this region is considered a complete object because of the small variation gradient. At the lower left corner of Fig. 6(a), two 45° boundary lines are found on the left side of x-displacement field. The variation gradient is not proportional to the nearby region. If an unusual boundary line for variation gradient is found in a certain region of the displacement field distribution figure, the region is not a complete block, and its boundary line is probably the location of crack.
As shown in Fig. 6, different displacements on both sides of the two boundary lines, which extend at 45° from lower left corner of the displacement field, are about 0.8 and 1.0mm; the upper boundary line will continue to extend upward to reach the top after two deflections nearby the top. This phenomenon indicates that the crack has passed over the test block. According to the log of test process (Section 3.2), cracks of brick wall are audible and visible. In the right section, the lower boundary line turns leftward by 90°at 1/3 height of the test block, and then turns rightward. The displacement distribution figures can be used to judge the movement type of the cracks. As shown in Figure 6 there are two cracks at the lower left corner of the specimen. The relative displacements of both sides of the upper crack in x- and y-direction are almost the same. The direction of the
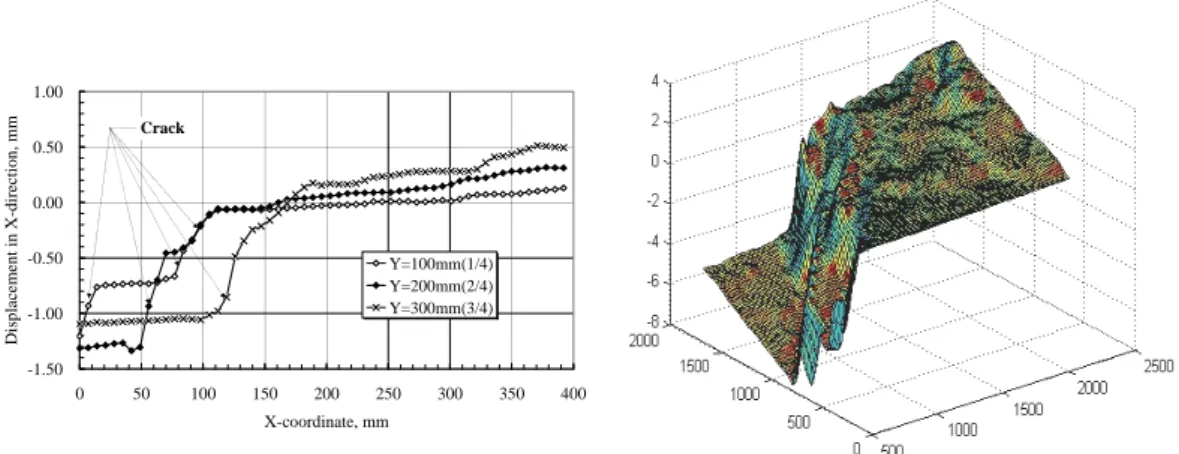
relative movement and the crack are parallel, which reveals a crack of sliding mode. For the lower crack, the relative displacement in x-direction is obviously larger than the relative displacement in y-direction. Since the direction of relative displacement and crack are inclined, the crack is of combined mode of sliding and opening. Fig. 7 depicts a profile scanning pattern of the x-displacement at 1/4, 2/4 and 3/4 height of the test block, whereas Fig. 8 shows a three-dimensional representation. There are two discontinuous changes of displacements on the profiles of 1/4 and 2/4 shown in Fig. 8, and a suspected crack on profile 3/4. Only one crack on profile 1/4 can be seen in the y-displacement field (Fig. 6(b)) because the second crack is caused by combining sliding and opening whereas the first crack is a pure sliding crack.
(3) Crack identification according to strain field: When 50 kN is applied, slight strain occurs in the mortar as shown in Fig. 5(d) ~ (f) but there is still no visual crack. The strain in most bricks around mortar is still nearly null. When the load increases to 182 kN as shown in Fig. 6(d) ~ (f), the situation of strain concentration is obvious along the mortar with two strip zones of tensile strain concentration as shown in Fig. 6(d). The strain is larger than 0.5%, which far exceeds the allowable strain of brick and mortar, and can be identified as crack. The von Mises strain is usually applied to evaluate the occurrence of yield in ductile material. But the strain concentration situation is highly related to the crack formation in this test; hence the von Mises strain is also useful in observing the crack occurrence.
In Fig. 6(f), the position of strain concentration coincides with the position of crack whereas in Fig. 9, the potential of crack formation by applying 100 kN can be observed. Therefore, the position of strain concentration at the beginning of the test and the development of the strain concentration have very close relation to the position of crack formation. By applying the strain field analysis, the possible position of crack formation can be determined at an early stage such that a proper retrofit can be carried out.
-1.50 -1.00 -0.50 0.00 0.50 1.00 0 50 100 150 200 250 300 350 400 X-coordinate, mm Di sp lacement i n X-directi on, mm Y=100mm(1/4) Y=200mm(2/4) Y=300mm(3/4) Crack
Fig. 7: Profile Scanning Pattern of x-Displacement by 182 kN
Fig. 8: 3D representation of x-directional displacement by 182 kN.
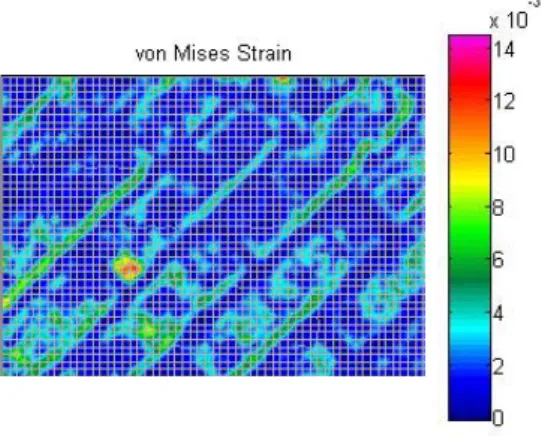
(4) Influence of the grid size on strain field: By comparing Fig. 6(f) with Fig. 10, all positions of strain concentration are seen to be almost identical but the strain concentration strips have obviously different widths. The grid size in Fig. 10 is half of the grid size in Fig. 6(f) whereas the width of the strain concentration strip is only half. The strain at the strain concentration strip in Fig. 10 is about double of that in Fig. 6(f). Theoretically the value of the real strain concentration will not change as the grid size changes, but the value of the strain concentration induced by crack is inverse proportional to the grid size. This situation can be found in the comparison of Fig. 6(f) and Fig. 10. Therefore, the strain concentration positions in Fig. 10 reveal that these positions are cracks. The advantages of changing the grid size to observe crack formation in bricks have been demonstrated.
Fig. 11: cracks depicted by strain field and visual investigation by
200 kN
cracks between brick and mortar cracks in brick cracks found by carefully visual inspection direction of displacement Fig. 9: von Mises Strain field by
100 kN; grid size 32 pixels
Fig. 10: von Mises Strain field by 182kN, grid size 16 pixels
The positions of light blue lines, red lines and green lines in Fig. 11 depict the position of cracks by carefully inspecting the photos exactly coincide with the positions of strain concentration in Fig. 10. Actually, all micro-crack on masonry wall, hardly inspected by naked eyes, are easily identified on Fig. 10 by the proposed DIC method. Therefore, instead of visual observation, the digital image correlation method can be used to observe the crack formation, and visualize the crack development.
6. Application of DIC to the Test of Steel-Framed Brick Wall
When subject to loadings, a steel-framed brick wall will interact with the steel frame to raise its tenacity and earthquake-resisting capacity. Fig. 12 shows the schematic diagram for carrying out the test; the specimen is subject to repetitive reciprocal loadings of increasing intensity to force displacement until the wall bearing capacity ceases to increase. In this test, when the lateral displacement reaches 100 mm, the wall bearing capacity does not decrease indicating that the steel-framed brick wall displays a greater tenacity. This observation can be explained by the appearance of the multiple dispersed cracking lines on the wall. As seen in Fig. 13, the horizontal displacement field and the von Mises strain field reveal that when subject to a leftward action, the wall displays lower left to upper right cracks. The dispersed crack field is thus beneficial to increasing the earthquake-resisting capacity of the brick wall.
Fig.12 Specimen of infilled masonry wall 150cm 12 0cm Plat e 2 00x 20 H300x200x8x12 H300x200x8x12
(a) Displacement field, Dx
(b) Strain field, von Mises Fig.13 Displacement and strain
7. Conclusions
Tests on a brick-mortar wall and a steel-framed brick wall are conducted in this research using a digital image correlation method to analyse the deformation field of the wall surface. The key point for identifying crack formation is the high deformation concentration. The following conclusions can be drawn according to the observations:
1. The initial crack can be identified through the displacement and strain field obtained from the digital image correlation method. The strain concentration situation in the von Mises strain field can better define the position of crack formation.
2. The brick wall demonstrates non-uniform deformation distribution because it consists of materials of different characteristics. The non-uniform distribution can be detected using the digital image correlation method.
3. The crack formation tendencies can be observed at an earlier stage from strain concentration situation. The earlier detection of cracks will make it possible to reinforce the wall before it is damaged beyond repair.
4. The grid size has big influence on the evaluation of crack formation in brick walls; small grid size is better for the method proposed in this study.
Acknowledgement
This work has been supported by the National Science Council of Taiwan, ROC through grant no. NSC94-2625-Z-327-005. This support is gratefully acknowledged.
References
Chu T C, Ranson W F, Sutton M A and Peters WH, 1985, “Application of Digital-Image-Correlation Techniques to Experimental Mechanics”, Experimental
Mechanics, Vol. 25, pp.232-244.
Dost M, Vogel D, Winkler T, Vogel J, Erb R. and Kieselstein E, 2003, “How to detect Edgar Allan Poe’s ‘purloined letter’ - or: Cross correlation algorithms in digitised video images for object identification, movement evaluation and deformation analysis”, in Proceedings of SPIE Vol. 5048, Nondestructive
Detection and Measurement for Homeland Security (SPIE, Bellingham, WA,
USA)
Dost M, Rümmler N, Kieselstein E, Erb R, Hillmann V, and Großer V, 1999, “Correlation Analysis at Grey Scale Patterns in an in-situ Measuring Module for Microsystem Technology”, Materials Mechanics – Fracture Mechanics –
Micromechanics, Eds. T. Winkler, A. Schubert, pp. 259-266, Berlin/ Chemnitz.
Mendelson A, 1983. Plasticity: Theory and Application. Krieger Publishing company Malabar, Florida, USA.
Raffard D, Ienny P. and Henry J P, 2001, “Displacement and Strain Fields at a Stone/Mortar Interface by Digital Image Processing”, Journal of Testing and
Evaluation, Vol. 29, No. 2, pp.115-122.
Sutton M A, Turner J L, Bruck H A and Chae T A, 1991, “Full-field Representation of Discretely Sampled Surface Deformation for Displacement and Strain Analysis”, Experimental Mechanics, Vol. 31, pp.168-177.
Shiao J B, 1999, “Report on the Investigation of the Damages due to 921 Chichi Earthquake – Buildings”, Taiwan, National Center for Research on Earthquake
Engineering, report no.: NCREE-99-054,
Tung S H, Kuo J C and Shih M H, 2005, “Strain Distribution Analysis Using Digital-Image-Correlation Techniques”, Proceedings of the Eighteenth KKCNN