雙纖衣摻鉻釔鋁石榴石晶體光纖之螢光光譜研究
135
0
0
全文
(2)
(3)
(4)
(5) 致謝 踏入中山已歷經了十一個寒暑,從一個懵懂無知十九歲的少年,到現在邁入 堂堂三十而立之際,心中感觸著實良多。在這漫長的求學期間,首先要感謝物理 系的老師們,培養我在理論與邏輯思考的能力,使我在研究上面對問題時,能夠 很快的抓住重點,並做適當的解決。在碩士求學期間,很高興能在高甫仁老師身 上學得許多光學顯微的量測技術,使我往後不論投身於光電產業或生物醫學領 域,都是不可多得的一項專長。此外,高老師在實驗研究上,時常會有許多絕妙 的好點子,這些經驗也讓我學得如何在實驗上做出突破與創新。在博士求學期 間,很感謝指導教授黃升龍老師四年來的悉心指導與關懷。在實驗研究上總是能 給我許多寶貴的建議與方向,並且提供了豐富的資源與設備,讓我能依自己的興 趣去發展。最重要的是黃老師積極認真與謙卑有禮的處事態度,更是值得我學習 的地方,心中對黃老師只有無上的感激。另外特別感謝張道源老師、沈博彥老師 與林彥勝老師在研究上的指導,開啟了我在材料領域的另一視野。. 在實驗方面,要感謝羅家堯學長與黃光瑤學弟提供了許多需要耗費相當功夫 生長的晶體光纖樣品;感謝易瑞昀學妹與盧盟仁學弟在光學元件的設計與鍍膜; 感謝蔡政男學長與林晏聖學弟在晶體光纖側鍍與退火實驗的研究;感謝賴建智學 弟在微結構的量測與分析;感謝蘇偉智、施仁親與陳紹璿學弟在樣品準備的幫 忙,因為你們的鼎力相助,使得本論文能夠順利的完成。另外,在生活方面,感 謝李立民學長在投資理財觀念的啟發;感謝陳平夷學長在網球場上的指導;感謝 蔡漢鍾老師在生活上給予的關懷及照顧;更感謝蔡政男老師帶領我們在壘球界創 造出不敗的神話,還有感謝彭昕、盟仁、立宣、孟璋、德峰和松屏等碩班的學弟 妹們,有著你們的相伴,使得我的博士班生活除了研究外,更充滿了色彩與歡笑。. 最後謹將本論文獻給我最親愛的父母、外婆及哥哥弟弟,感謝你們默默地 支持,讓我無憂地順利完成博士學業,特以本文表達由衷的感謝。. 陳建誠 謹誌于 超快雷射實驗室 2006 年 07 月 12 日.
(6) 中文摘要 摻鉻釔鋁石榴石晶體光纖在光通訊波段可應用於自發輻射放大光源與光放大器。在 本文中,我們成功地利用雷射掃瞄式共焦顯微術,分別對晶體光纖中正三價與正四價的 鉻離子做螢光檢測;其量測的靈敏度分別可達1.6×10¹⁷/cm3與7.5×1015/cm3。當塊材晶體 長成為66 μm直徑的晶體光纖後,正三價與正四價鉻離子的濃度降低了約10倍。因此我 們也藉由電子槍側鍍氧化鉻、氧化鈣與氧化鎂的薄膜,來增加正四價鉻離子在晶體光纖 的濃度。此外,經由氧化還原環境下作退火處理,發現低電荷補償效率是由氧空缺存在 釔鋁石榴石晶體中所造成。 在雙纖衣晶體光纖的研究上,正三價鉻離子在纖心所顯現的是689 nm的窄頻螢光光 譜,而在內層纖衣中則為650 nm到950 nm的寬頻波段。正四價鉻離子在纖心為1.2 μm到 1.6 μm的寬頻螢光波段,其中心波長在1.38 μm。然而在內層纖衣,則顯露出1.15 μm到 1.55 μm的藍位移現象,其中心波長也改變至1.22 μm。藉由不同成分的顯微光譜分析, 可以得到螢光強度在高能場位置與低能場位置的比例。其結果發現當二氧化矽的成分從 重量百分比為26.9%增加至43.0%時,正三價鉻離子在高能場位置與低能場位置的比例 由20%增加至29%,而正四價鉻離子則由7.1%增加至11.3%。可知在玻璃材料中,增加 二氧化矽的成分會導致晶體場強度的增加。因此藉由不同成份的選擇當基材,可以調整 寬頻光源在近紅外光的發光波段。 另外,控制生長條件使得二氧化矽完全滲入釔鋁石榴石晶體光纖後,摻正四價鉻離 子的玻璃光纖可以被製造出,其所量測得到的傳輸損耗小於0.08 dB/cm。當激發波長在 900 nm時,正三價與正四價鉻離子可同時被激發而產生超過400 nm的頻寬,且所量得的 自發輻射放大光源可超過12 μW。此元件具有相當大的潛力作為高解析光學斷層掃描技 術的光源。. i.
(7) Abstract Cr4+:YAG crystal fiber has been studied as amplified spontaneous emission (ASE) light source and optical amplifier in optical communication band. In this study, we have demonstrated the use of laser scanning confocal microscopy in mapping of Cr3+ and Cr4+ fluorescence images within the Cr4+:YAG crystal fibers. The measured sensitivities of 1.6×10¹⁷/cm3 and 7.5×10¹⁵/cm3 have been achieved for Cr3+ and Cr4+ ions, respectively. After growing from bulk crystal to 66-μm-diameter crystal fiber, the concentrations of Cr3+ and Cr4+ ions are decreased about 10-fold. Therefore, the side deposition with Cr2O3, CaO, and MgO thin film layers by E-gun was used to increase the concentration of Cr4+ ions in crystal fiber. In addition, by annealing treatment in reduction and oxidation atmospheres, the lower efficiency of charge compensation was found to be the existence of oxygen vacancy in YAG matrix. In the study of double-clad Cr4+:YAG crystal fiber, the Cr3+ emission spectrum in core shows the sharp R-line at 689 nm, while that in inner cladding shows broadband emission from 650 nm to 950 nm. The Cr4+ spectrum shows the representative broadband emission from 1.2 to 1.6 μm with center at 1.38 μm, while that in inner cladding shows a blue shift from 1.15 to 1.55 μm with a peak around 1.22 μm. With the analysis of composition dependence of micro-spectroscopy, the emission intensity ratio of high-field site to low-field site was found. It is increased from 20% to 29% for Cr3+ and from 7.1% to 11.3% for Cr4+ upon increasing the concentration of SiO2 from 26.9 wt.% to 43.0 wt.%. The increase of concentration of SiO2 leads to the increase of crystal-field strength in glass, which may be useful by choosing the different compositions as host for application to the super wideband light source in different NIR emission ranges. Furthermore, the Cr4+-doped glass fiber was fabricated by controlling the growth condition to make the silica entirely diffusing into Cr4+:YAG crystal fiber. The corresponding propagation loss is measured less than 0.08 dB/cm. By pumping wavelength at 900 nm, both Cr3+ and Cr4+ emission bands can be excited to generate more than 400 nm broad emission band with amplified spontaneous emission power more than 12 μW. It may be a candidate as light source for high resolution optical coherence tomography.. ii.
(8) Table of Contents 中文摘要……………………………………………………………………….. i Abstract ……………………………………………………………………….. Table of Contents ……………………………………………………………... List of Tables…………………………………….…………………………….. List of Figures…………………………………………………………….……. ii iii v vi. Chapter 1 Introduction……………………………………………………….. 1 Chapter 2 Properties of Cr:YAG crystal fiber….…..……………………… 2.1 General introduction for transition ions…………………………………. 2.1.1 Coordination and crystal field…………………………………….….. 2.1.2 Crystal field effect on Cr3+ energy level……………………………… 2.1.3 Crystal field effect on Cr4+ energy level……………………………… 2.2 Properties of Cr:YAG crystal…………………………………………..... 2.3 Fabrication and measurement for Cr:YAG crystal fiber………………… 2.3.1 LHPG system and fabrication processes.……………………………... 2.3.2 Sample preparation……………...…………………………………... 2.3.3 Refractive index measurement…...…………………………………... 2.3.4 Laser scanning confocal microscopy………...….…………………….. 2.3.5 Fluorescence lifetime measurement…………………………………... 3 3 5 7 10 14 18 18 21 23 24 27. Chapter 3 Oxidation states of Cr in YAG crystal fibers……..……………... 3.1 Charge compensation for generation of Cr4+ ion…………………….….. 3.2 Composition and structure analysis……………………………………... 3.3 Oxidation states in Cr:YAG single crystal fiber………………………..... 3.3.1 Doping concentrations in single crystal fiber…..……………………... 3.3.2 Fluorescence mappings of Cr3+ and Cr4+ ions in single crystal fiber…..... 3.3.3 The dependency between normalized Cr4+ and Ca2+…….…………...... 3.4 Oxidation states in Cr:YAG double-clad fiber…..……………………..... 3.4.1 Growth of double-clad fiber……………………..…………………... 3.4.2 Composition analysis and refractive index profile……………….…..... 3.4.3 Fluorescence mappings of Cr3+ and Cr4+ ions in double-clad fiber …...... 3.5 Cr4+ fluorescence lifetime and low temperature spectrum…………..….... 29 29 34 38 38 41 46 48 48 50 52 58. Chapter 4 Cr4+ enhancement by side deposition and annealing treatment.. 64 4.1 Side deposition by E-beam coater………………………...………...…… 64 4.1.1 Side deposition of Cr2O3………………….…..…………………..…. 67. iii.
(9) 4.1.2 Side deposition of CaO……..…………….…..…………………….... 4.2 Effects of annealing temperature and atmosphere………..…………..….. 69 74 78. Chapter 5 Cr ions in YAG-silica interdiffusion layer……..…………….….. 5.1 The nanocrystal in YAG-silica interdiffusion layer……………...…..….. 5.2 Compositional dependence Cr3+ and Cr4+ fluorescence spectra……..….. 5.3 400-nm-broadband emission from a Cr-doped glass fiber………………. 5.3.1 Fabrication process and composition analysis…….………………..…. 5.3.2 Propagation loss and absorption spectrum.…..……………………….. 5.3.3 Emission spectrum and amplified spontaneous emission power…….….. 84 84 87 94 94 96 98. 4.1.3 Side deposition of MgO…….…………….…..…………………..….. Chapter 6 Conclusions…………...………..………………………………..… 103 References ………………………………………………..……………………. 106 Biography ………………………………………………..…………………….. 114 Publication List……………………………………………..………………….. 115. iv.
(10) List of Tables Table 2.1. Crystal field parameters for Cr3+ ion in several laser host crystals…. Table 2.2. 4+. The spectral characteristics of Cr -doped crystals.…...…….……... 13. Table 2.3. Criteria for laser materials……………………….…………………. 14. Table 2.4. Physical and optical properties of Cr4+:YAG crystal………..……… 17. Table 2.5. SiC grit size (USA)…………………………………………………. Table 2.6. The mechanical preparation of crystal fiber samples………………. 22. Table 3.1. Comparison of ionic radii mismatch between dopant and host cations………………………………………………………………. 32. Table 3.2. Fluorescence characteristics of Cr:YAG and Cr,Ca:YAG crystal fibers………………………………………………………………... 33. Table 3.3. Physical properties of fused-silica glass…………………..………... 48. Table 3.4. The comparisons of lattice constant, zero phonon (λzp), and phonon (λp) lines in bulk crystal, 70-μm crystal fiber, and core of DCF…… 63. Table 4.1. The dopant concentrations of 66-μm crystal fiber made from 2000 μm and 500 μm source materials…………………………………... 65. Table 4.2. The functional dependence between Ca and Cr concentration……... 70. Table 4.3. The functional dependence between Mg and Cr concentration…….. 76. Table 4.4. The brightness intensity of dark field image with as grown and annealing crystal fibers……………………………………………... 77. Table 4.5. The comparison of lattice mismatch between host ions and charge compensators……………………………………………………….. 77. Table 4.6. The relation between Cr, Cro3+ , Cro4+ , and Crt4+ ions………...…. 82. Table 4.7. The relation between Ca, Cro4+ , Crt4+ , and VO• 2- ions………….... Table 5.1. Multi-peak Gaussian fittings of absorption spectra………………… 97. Table 5.2. Fluorescence spectra in different positions of core of Cr4+-doped glass fiber…………………………………………………………... 102. v. 9. 21. 83.
(11) List of Figures Fig. 2.1. Crystal field parameters for Cr3+ ion in several laser host crystals…. Fig. 2.2. Single configuration coordinate diagram of a transition-metal ion coupled to a vibrating lattice……………………………………….. 6. Fig. 2.3. Configuration coordinated diagram of the ground state 4A2 and excited states 2E and 4T2 of Cr3+-doped solids……………………... 7. Fig. 2.4. Energy-level diagram as a function of the crystal field strength in units of Racah parameter B for the octahedrally coordinated d3 system (such as Cr3+)……………………………………………….. 8. Fig. 2.5. Fluorescence spectra for Cr3+ ion in several laser host crystals…….. Fig. 2.6. Energy-level diagram as a function of the crystal field strength in units of Racah parameter B for the octahedrally coordinated d2 system (such as Cr4+)……………………………………………….. 11. Fig. 2.7. Electronic energy levels of Cr4+ ion in Td symmetry, showing the splittings introduced by a D2d distortion and spin-orbital coupling... 11. Fig. 2.8. 10K absorption spectrum of Cr4+:YAG. The inset shows an enlargement of the lowest-energy transition……………………….. 12. Fig. 2.9. The garnet structure………………………………………………… 15. Fig. 2.10. (a) Absorption and (b) fluorescence spectra of Cr4+:YAG. Fluorescence spectrum was taken under Nd:YAG laser with wavelength at 1.06 μm……………………………………………... 16. Fig. 2.11. Energy level diagram of the Cr4+:YAG crystal……………………... 17. Fig. 2.12. The LHPG system…………………………………………………... 19. Fig. 2.13. Growth chamber…………………………………………………….. 19. Fig. 2.14. Illustration of single crystal growth by LHPG method……………... 20. Fig. 2.15. Photography of a 70-μm-diameter crystal fiber of Cr4+:YAG……… 20. Fig. 2.16. The revolution of surface quality after grinding and polishing…….. 22. Fig. 2.17. Refractive index measurement setup……………………………….. 23. Fig. 2.18. The fluorescence spectra of (a) Cr3+ and (b) Cr4+ in YAG………….. 24. Fig. 2.19. Laser scanning confocal microscope setup…………………………. 26. 3+. 4. 9. 4+. Fig. 2.20. The transmittance spectra of (a) Cr and (b) Cr dichroic beam splitters……………………………………………………………... 26. Fig. 2.21. Measurement setup for Cr4+ fluorescence lifetime…………………. 27. Fig. 2.22. The modulated laser power at 3 kHz……………………………….. 28. Fig. 2.23. The fall time of system response…………………………………… 28. Fig. 3.1. Configuration of the Cr ions in YAG structure……………………... Fig. 3.2. 3+. 4+. 30. The Cr and Cr absorption spectra in YAG……………………… 31 vi.
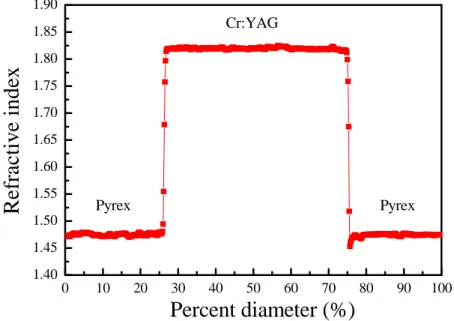
(12) Fig. 3.3. (a) Photograph of line scanning marks on the cross section of crystal fiber. (b) The distribution of Y2O3 and Al2O3 in YAG crystal fiber………………………………………………………………… 34. Fig. 3.4. Refractive index profile of crystal fiber with Pyrex glass cladding.... Fig. 3.5. The power fluctuation of DFB laser………………………………... 36. Fig. 3.6. The normalized X-ray diffraction patterns of Cr4+:YAG crystal grown by CZ and LHPG methods………………………………….. 37. Fig. 3.7. Doping profiles of (a) Cr2O3 and (b) CaO in different diameter crystal fibers with different diameters……………………………… 39. Fig. 3.8. The average concentrations of Cr2O3 and CaO in fiber with various diameters…………………………………………………………… 40. Fig. 3.9. (a) Side view of Cr:YAG crystal fiber. (b) The micron-sized particles formed at the surface of crystal fiber……………………... 40. Fig. 3.10. SEM side view SEI and EDX mappings of Cr:YAG crystal fiber showing wide distribution of micron-sized Cr-rich particles on the surface……………………………………………………………… 40. Fig. 3.11. The Cr3+ and Cr4+ fluorescence mappings of crystal fibers with various diameters…………………………………………………… 41. Fig. 3.12. Comparison between LSCM and EPMA measurements for (a) 920 μm and (b) 300 μm crystal fibers…………………………………... 42. Fig. 3.13. The absorption spectrum of Cr4+:YAG with α of 4.5 cm-1 at 1064 nm…………………………………………………………………... 43. Fig. 3.14. The distributions of (a) Cr3+ and (b) Cr4+ with various diameter crystal fibers measured by LSCM………………………………….. 44. Fig. 3.15. The concentrations of Cr3+ and Cr4+ ions in various diameter crystal fibers………………………………………………………... 45. Fig. 3.16. The distributions of Cr4+, Cr2O3, and CaO concentrations in (a) 920-μm- diameter and (b) 66-μm-diameter crystal fibers………….. 46. Fig. 3.17. The dependence between normalized Cr4+ and Ca2+ concentrations.. 47. Fig. 3.18. Left: Schematic diagram of the molten zone during growth, right: photograph of the side view of the grown double-clad Cr4+:YAG fiber………………………………………………………………… 49. Fig. 3.19. The SEM image of double-clad fiber end view…………………….. Fig. 3.20. Compositions of double-clad fiber and its refractive index profile… 51. Fig. 3.21. Cr3+ fluorescence intensity mapping………………………………... 35. 50 52. 3+. Fig. 3.22. Distribution of Cr2O3 concentration and Cr fluorescence intensity. 53. Fig. 3.23. Cr3+ fluorescence spectra at DCF core and inner cladding…………. Fig. 3.24 Fig. 3.25. 4+. Cr fluorescence intensity mapping……………………………….. 4+. 53 54. Distribution of CaO concentration and Cr fluorescence intensity... 54 vii.
(13) Fig. 3.26. Cr4+ fluorescence spectra at DCF core and inner cladding…………. 55. Fig. 3.27. The end view of DCF by Al and Cu diffusion to inner cladding….... 56. Fig. 3.28. The compositions of DCF by Al and Cu diffusion to inner cladding. 56. Fig. 3.29. The end views of DCF by Al and Cu diffusion into core…………... 56. Fig. 3.30. The Cr3+ and Cr4+ fluorescence intensity of DCF by Al and Cu 57 diffusion into (a) inner cladding and (b) core……………………….. Fig. 3.31. The measured fall times of (a) bulk crystal, (b) 70-μm crystal fiber, and (c) core of DCF………………………………………………… 59. Fig. 3.32. (a) Appearance of hot and cold stage and (b) the cold zone of the stage where a Cr:YAG crystal is inside…………………………… 60. Fig. 3.33. The Cr4+ fluorescence spectra with temperature from 300K to 88K.. Fig. 3.34 Fig. 3.35. 61. 4+. The Cr fluorescence spectra of bulk crystal, 70-μm crystal fiber, and core of DCF with temperature at 88K…………………………. 62 HRTEM images and diffraction patterns of (a) bulk crystal and (b) core of DCF………………………………………………………… 62. Fig. 4.1. The relation of ASE power with Cr4+ concentration and fiber length 64. Fig. 4.2. Schemes of side deposition by E-beam coater, and the LHPG growth thereafter…………………………………………………… 66. Fig. 4.3. The relation between Cr2O3 deposition time and thickness……….... Fig. 4.4. The relation between Cr2O3 deposition thickness on the source material and concentration of the crystal fiber with 66 μm in diameter…………………………………………………………….. 68. Fig. 4.5. The relation between CaO deposition time and thickness………….. Fig. 4.6. The relation between CaO deposition thickness and concentration on crystal fiber with 66 μm in diameter……………………………. 70. Fig. 4.7. The functional dependence between normalized Cr4+ and Ca2+ concentration……………………………………………………….. 71. Fig. 4.8. The (a) bright field and (b) dark field images of the crystal fiber….. 71. Fig. 4.9. Environment furnace………………………………………………... 72. Fig. 4.10. Annealing sequences………………………………………………... 72. Fig. 4.11. The (a) bright field and (b) dark field images of crystal fiber after annealing at 1350oC under oxygen atmosphere……………………. 73. Fig. 4.12. The functional dependence between normalized Cr4+ and Ca2+ concentrations after annealing at 1350oC under oxygen atmosphere. 73. Fig. 4.13. The dependence between MgO deposition time and thickness…….. 74. Fig. 4.14. The relation between MgO deposition thickness and concentration on crystal fiber with 66 μm in diameter……………………………. 74. Fig. 4.15. The functional dependence between normalized Cr4+ and Mg2+….... viii. 67. 70. 76.
(14) Fig. 4.16. The bright (upper row) and dark (lower row) field images of MgO side deposition crystal fiber………………………………………… 76. Fig. 4.17. The bright (upper row) and dark (lower row) field images of MgO side deposition crystal fibers after 1350oC annealing under oxygen atmosphere…………………………………………………………. 77. Fig. 4.18. The Cr4+ fluorescence intensity with different annealing temperatures under nitrogen and oxygen atmospheres with 4 hours annealing time……………………………………………………… 78. Fig. 4.19. The simplified Cr4+ fluorescence intensity diagram with different annealing temperatures under nitrogen and oxygen atmospheres….. 79. Fig. 4.20. The Cr3+ fluorescence intensity with different annealing temperatures under nitrogen and oxygen atmospheres with 4 hours annealing time……………………………………………………… 80. Fig. 4.21. The simplified Cr3+ fluorescence intensity diagram with different annealing temperatures under nitrogen and oxygen atmospheres….. 80. Fig. 5.1. The TEM image in inner cladding and outer cladding interface…... The TEM image in inner cladding…………………………………. The HRTEM image of crystalline nano-structures………………… The SAED pattern showing hkl diffractions, as indexed………….... Fig. 5.2 Fig. 5.3 Fig. 5.4. 85 85 86 86. 3+. Fig. 5.5. Cr fluorescence spectrum at DCF inner cladding, which is fitted by Gaussian profiles………………………………………………... 88. Fig. 5.6. Cr3+ fluorescence spectra associated with different positions in inner cladding, corresponding to various concentrations of SiO2….. 89. Fig. 5.7. Five Gaussian-peak-fitted curves for Cr3+ fluorescence spectra with various concentrations of SiO2……………………………………... 89. Fig. 5.8. The emission intensity ratio of Cr3+ in HFS to LFS with different SiO2 concentration………………………………………………….. 90. Fig. 5.9. Cr4+ fluorescence spectrum at DCF inner cladding, which is fitted by Gaussian profiles……………………………………………….. 91. Fig. 5.10. Cr4+ fluorescence spectra associated with different positions in inner cladding, corresponding to various concentrations of SiO2….. 92. Fig. 5.11. Seven Gaussian-peak-fitted curves for Cr4+ fluorescence spectra with various concentrations of SiO2………………………………... 92. Fig. 5.12. The emission intensity ratio of Cr3+ in HFS to LFS with different SiO2 concentration………………………………………………….. 93. Fig. 5.13. The end view of Cr4+-doped glass fiber…………………………….. 95. Fig. 5.14. The distributions of host compositions by EPMA measurement….... 95. ix.
(15) Fig. 5.15. (a) The absorption spectra of samples 1, 2, and 3. (b), (c), and (d) show the multi-peak Gaussian fitting of samples 1, 2, and 3, respectively………………………………………………………… 97. Fig. 5.16. The emission spectra of (a) sample 1, (b) sample 2, and (c) sample 3 under the pumping wavelengths from 750 nm to 1000 nm………. 99. Fig. 5.17. Pumping wavelength dependence of emission peaks and bandwidths in the sample 2………………………………………… 100. Fig. 5.18. Curve fitting for 406-nm-bandwidth emission……………………... 100. Fig. 5.19. Fig. 5.19 Fluorescence spectra in (a) center-, (b) middle-, and (c) edge-positions of core of Cr4+-doped glass fiber…………………… 101. Fig. 5.20. The measured ASE output power of sample 2. The inset is the fluorescence spectrum by 900-nm pumping wavelength with a 950 nm long-wavelength-pass filter to block the pump beam………….. 102. x.
(16) Chapter 1 Introduction. The rapid growth of the internet and data traffic in optical communication networks in recent years has strongly stimulated the research and development of wavelength-division-multiplexing. (WDM). network. system.. The. number. of. transmission channels in WDM system depends on the gain bandwidth of optical amplifiers and the laser sources. Due to the technology break through in dry fiber fabrication, it opens the possibility for fiber bandwidth all the way from 1.3 μm to 1.6 μm. Consequently, the corresponding wideband light sources and fiber amplifiers in 1.3 μm to 1.6 μm region are urgent need. There are several types of fiber amplifiers that are in wide use to produce optical gains for different communication bands, such as erbium-, thulium-, and praseodymium-doped fiber amplifiers for C, L, S, and O bands [1.1-1.4]. However, the rare-earth doped fiber amplifiers cannot fully cover the whole 1.3-1.6 µm range due to its narrow gain bandwidth. It is well known that the C4+-doped materials have wideband emission in the 1.2-1.6 μm range. Therefore, the Cr4+-doped crystals and glasses have drawn significant attention in the development of light sources in the super wideband optical communication systems and as a gain medium for a solid state laser. As host matrices for impurities, glass materials are much easier and more economical to be fabricated into large-size fibers than crystals. However, Cr ions are likely to exist in the stable form of 3+ oxidation state and hardly found in the tetravalent state in normal glasses [1.5]. Although aluminate, alumino-silicate, and gallate glasses have been found to achieve stable 4+ oxidation formation of chromium [1.5-1.7], the glass hosts still suffer from lower emission efficiency as compared to Cr4+-doped crystals [1.5,1.8,1.9]. For this reason, a laser heated pedestal growth (LHPG) method has been developed to pull Cr4+:YAG crystal fiber with 66 μm in diameter for generating greater than milliwatts of amplified spontaneous emission [1.10]. In addition, the first Cr4+-doped fiber amplifier with double-clad fiber (DCF) structure was also demonstrated with up to 16-dB gross gain at 1.47 μm [1.11]. The DCF is grown by a 66-µm Cr:YAG crystal fiber, which is inserted into a fused silica capillary with 76 and 320 µm inner and outer diameters. With proper control of the growth conditions, the fused silica would partially diffuse 1.
(17) into Cr4+:YAG crystal fiber to form the three-layer DCF structures, which are denoted as core, inner cladding, and outer cladding. Therefore, the optical properties of Cr4+:YAG crystal fiber and DCF after growth is necessary to be examined for optimizing the growth conditions. This dissertation contains four main chapters. In chapter 2, the properties of Cr4+:YAG was introduced, and the fabrication processes and optical measurement for Cr4+:YAG devices were described. In chapter 3, the laser scanning confocal microscopy (LSCM) was used to measure the concentrations and distributions of Cr3+ and Cr4+ ions in Cr4+:YAG crystal fiber and DCF. Due to the concentration of Cr4+ ions in 66-µm Cr4+:YAG crystal fiber is 10-fold decreased than that in bulk crystal. The efforts for increasing Cr4+ concentration in crystal fiber were discussed in chapter 4. The way is side deposition with thin film layers of Cr2O3, CaO, and MgO on crystal fiber by E-gun. In addition, the annealed treatment under the reduction and oxidation atmospheres was used to estimate the efficiency of charge compensation. In chapter 5, the structure of inner cladding was studied by transmission electron microscopy (TEM), and it is found that YAG-silica diffusion layer consists of γ-Al2O3 crystalline nanostructure surrounded by the SiO2 amorphous matrix. Due to the gradient distributions of Al2O3 and SiO2 in inner cladding, the compositional dependence of emission spectra was measured by micro-spectroscopy. By the analysis of multi-peak Gaussian fitting for emission spectra, the emission properties of Cr3+ and Cr4+ were found to be dependent on the composition. That may be useful by choosing the different compositions as host for application to the wideband light source in different NIR emission ranges. Furthermore, as the same growth process for double-clad Cr4+:YAG crystal fiber, the Cr4+-doped glass fiber was fabricated when it makes the silica entirely diffusing into Cr4+:YAG crystal fiber. The measured absorption spectra were used to identify the absorption bands of Cr3+ and Cr4+ ions. The corresponding emission spectra were measured by Ti:sapphire laser with wavelength of 750-1000 nm. With appropriated pumping wavelength and doping concentrations, both Cr3+ and Cr4+ emission bands can be excited to generate more than 400-nm broad emission band in Cr-doped glass fiber. It may be a candidate as light source for high resolution optical coherence tomography.. 2.
(18) Chapter 2 Properties of Cr:YAG crystal fiber Tunable solid-state lasers have been widely used in applications for scientific research, medicine, ultra-fast laser pulse, and optical communication system. The most of tunable laser gain media based on 3d↔3d transitions of transition-metal ions, such as Ti3+, V2+, Cr2+, Cr3+, Cr4+, Co2+, and Ni2+, cover the spectral range between 700 nm to 2800 nm. In this chapter, we focused on the optical characteristic of Cr ion, and the effect of crystal field strength on Cr3+ and Cr4+ ions. In our study, due to the Cr4+:YAG crystal can generate broadband emission from 1200 to 1600 nm, which can be utilized as fiber amplifier for super wideband optical communication systems, the detailed introduction on the properties of Cr:YAG crystal was given. In the last section, the Cr:YAG crystal was grown to 66-μm-diameter crystal fiber by laser-heated pedestal growth method for having the superior performance in amplified spontaneous emission (ASE). The fabrication process and some measurement for examining the quality of crystal fiber are described.. 2.1 General introduction for transition ions Depending on the spectral characteristics of the laser output, solid-state lasers are categorized into two groups. In the rare-earth ion doped laser crystals, such as Nd3+, Ho3+, Tm3+, Er3+, and Yb3+, the laser active 4f electron is shielded by the higher lying electrons which form a closed xenon shell with the 5s25p6 configuration. This screening effect greatly reduces electron-phonon coupling resulting in a very weak interaction between the ion and the surrounding lattice. As a result, these lasers posses narrow emission line widths and the therefore emit coherent radiation at very specific wavelengths. The best known member of this group is the Nd:YAG laser which can operate at wavelengths in the near-infrared (NIR) including 946, 1064, and 1319 nm [2.1]. The spectral range of these lasers can be extended by using non-linear optical elements in two ways: the first one is the frequency conversion technique such as second harmonic generation (SHG) or third harmonic generation (THG), while the second one is frequency shifting like optical parametric oscillation (OPO) or stimulated Raman scattering. Both methods require complex optical and mechanical. 3.
(19) systems as well as high peak power density at the non-linear optical element. In the other group of solid-state lasers, also known as tunable solid-state lasers, the host media is doped with transition-metal ions such as Ti3+, V2+, Cr2+, Cr3+, Cr4+, Co2+, and Ni2+. Here, lasing occurs as a result of the transitions between the electronic levels of the 3d electrons which are not shielded from the outer electron shell. It results in the strong coupling between the vibrational energy states of the host media and electronic energy states of the active ions, giving rise to broad emission spectra. In Fig. 2.1, it shows the wavelength tuning ranges of some of these tunable solid-state lasers, which covers the near-infrared and mid-infrared spectral ranges, such as Cr3+:BeAl2O4 (alexandrite) (701-818 nm) [2.2], Cr3+:LiCaAlF6 (LCAF) (720-840 nm) [2.3], Ti3+:Al2O3 (sapphire) (670-1100 nm) [2.4], V2+:MgF2 (1070-1150 nm) [2.5], Cr4+:Mg2SiO4 (forsterite) (1170-1370 nm) [2.6], Cr4+:Y3Al5O12 (YAG) (1309-1596 nm) [2.7], Ni2+:MgF2 (1620-1800 nm) [2.8], Co2+:MgF2 (1800-2450 nm) [2.9], and Cr2+:ZnSe (2138-2780 nm) [2.10].. 3+. Cr :BeAl2O4 3+. Cr :LiCaAlF6 3+. Ti :Al2O3 2+. V :MgF2 4+. Cr :Mg2SiO4 4+. Cr :Y3Al5O12 2+. Ni :MgF2. 2+. Co :MgF2 2+. Cr :ZnSe. 600 800 1000 1200 1400 1600 1800 2000 2200 2400 2600 2800. Wavelength (nm) Fig. 2.1 Tuning ranges of some of the tunable solid-state lasers.. 4.
(20) 2.1.1 Coordination and crystal field The broad emission spectra of transition-metal ions is result form the strong coupling between the vibrational energy states of the host media and electronic energy states of the active ions. The emission wavelength and bandwidth are affected by two main factors: the appropriate site coordination and the crystal field [2.11]. The width of the optical transitions results from the types of orbitals that participate in the optical transition and the coordination of the transition-metal ions. If in the excited state, some of the d orbitals point directly to the surrounding atoms of host (ligands), inter-electronic repulsion will occur, and therefore the excited state will be shifted relative to the equilibrium position of ground state. Here, it is necessary to introduce the single configuration coordinate model (SCCM) [2.12] for understanding the interaction between the electronic center and the vibrating crystalline environment. The energies of the coupled electron-phonon system are described by: 1⎞ ⎛ ET (Q) = Ee + E L (Q) = Ee + hυ L ⎜ n + ⎟ 2⎠ ⎝. (2.1). where ET is total energy, Ee is the energy of the pure electronic level, E L is the energy due to electron-phonon coupling. The energy of electron-phonon coupling can be expressed by harmonic oscillator. n corresponds to the number of lattice quanta of energy (also known as phonons), h is Planck’s constant, and υ L is the classical frequency of the ionic vibration mode. υ L is also referred to the phonon frequency. The total energy of ion-lattice system is the electronic energy level which superimposed a manifold of equally spaced energy levels due to the lattice vibrations. Electron-phonon coupling is shown by using the well known “configuration coordinate diagram” [2.12]. An example of a single configuration coordinate diagram of an ion coupled to a vibrating lattice is shown in Fig. 2.2 [2.13]. The configuration coordinate Q refers to the distance between the central active ion and the neighboring ion. The equilibrium distance is Q01 when the electronic eigenenergy of the static lattice is Ee1 . Here, the lowest eigenenergy of the lattice-ion system is Ee1 + 1 / 2hυ L . Upon excitation to the excited electronic state with static eigenenergy Ee 2 , the amount of ion-lattice coupling also changes, resulting in a new equilibrium position at Q = Q02. The degree to which Q01 differs from Q02 depends on the difference in the amount of electron-phonon coupling in the two electronic states. The relative change 5.
(21) of the equilibrium position of the ground state and excited states is the source for the broadband transition of the transition-metal ions, because the lattice vibrations consist of a large number of modes with different phonon frequencies in the reality. In addition, when the equilibrium position is unchanged, the vibrational coupling is weak and the electronic is sharp, similar to the case of rare-earth ion doped crystals, or the R lines of ruby laser [2.14].. Fig. 2.2 Single configuration coordinate diagram of a transition-metal ion coupled to a vibrating lattice [1.13].. Unlike the rare-earth ions which have shielded 4f orbitals, the d orbitals of the transition-metal ions are influenced by the external crystal field. The position of the various electronic states of the transition-metal ions under the influence of a crystal field depends on the crystal field strength according the Tanabe-Sugano theory [2.15], and this is presented in the Tanabe-Sugano diagram, as will be explained below. There, it is possible to design a crystal host where specified optical transitions will be dominated.. 6.
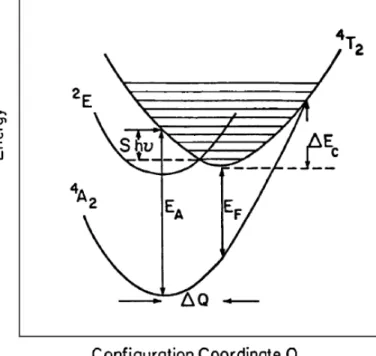
(22) 2.1.2 Crystal field effect on Cr3+ energy level As an example, the configuration diagram of Cr3+-doped system was shown in Fig. 2.3 [2.11]. It shows that the 2E→4A2 transition is spin-forbidden, so the excited state 2E is stabilized and not coupled with the vibrational modes of the crystalline host. Therefore, there is almost no change in the equilibrium distance of the ion-ligand both in the ground and excited states, and the 2E→4A2 transition will show the sharp line. In the spin-allowed transition, 4T2→4A2, the Cr-ligand interaction of the electronic orbitals in the 4T2 excited state causes distortion in crystalline structure due to electronic repulsion, as well as increase in the Cr-ligand inter-nuclear distance, in the other words, a strong electron phonon coupling and broadening of this transition.. Fig. 2.3 Configuration coordinated diagram of the ground state 4A2 and excited states 2 E and 4T2 of Cr3+-doped solids [2.11].. We note that due to the electron-phonon coupling of the 4T2 state, this level is much more sensitive to the crystal field strength than the 2E state. This can be observed from the Tanabe-Sugano diagram for the octahedrally coordinated d3 system presented in Fig. 2.4 [2.11]. The Tanabe-Sugano diagrams are based on the quantum mechanical treatment of the energy levels of a dn system (n is the number of electrons), under two fields: inter-electronic repulsions and medium crystal field strength. It was 7.
(23) found that under medium crystal field strength, the splitting of each state of d depends on the field strength measured by Dq or Δ and also on the electronic repulsion parameters also known as Racah parameters, denoted by B and C. In the Tanabe-Sugano theory it is assumed that C is proportional to B and that the proportionality constant has a fixed value for each diagram. However, the diagrams are independent of B since both the energy of each state (E) and the crystal field strength (Dq or Δ) are normalized to B [2.16].. Fig. 2.4 Energy-level diagram as a function of the crystal field strength in units of Racah parameter B for the octahedrally coordinated d3 system (such as Cr3+) [2.11].. By a proper choice of the solid-state host composition, we can control the crystal field strength and hence the energetic position of the 4T2 state relative to 2E. The energy splitter ΔE is the energy between 4T2 and 2E, which is defined as ΔE = E ( 4 T2 ) − E ( 2 E ). (2.2). It varies strongly with Dq/B and may be positive or negative, as shown in Table 2.1 [2.17-2.20]. In a strong strength crystal field, the 4T2 state will be above 2E, Dq/B >. 8.
(24) 2.45 as in Ruby, ΔE>0 (~2300 cm-1), and the Cr3+ emission is dominated by the sharp R lines (686.3 nm and 687.3 nm, 2E→4A2 transition) [2.21]. However, by contrast in a weak strength crystal field, the 4T2 level is below 2E, Dq/B < 2.45 as in LLGG, ΔE<0 (~-1000 cm-1), and the Cr3+ emission is broadband emission (4T2→4A2 transition). In Fig. 2.5 [2.17], it shows the fluorescence spectra for Cr3+ ion in several laser host crystals varying from strong to weak crystal fields. The Cr3+ emission is becoming broader when the crystal field strength is decreased. Table 2.1 Crystal field parameters for Cr3+ ion in several laser host crystals [2.17-2.20].. Crystal name. Host material. ΔE (cm-1). Dq/B. Ruby. Al2O3. 2300. 2.8. YAG. Y3Al5O12. 1000. 2.6. Alexandrite. BeAl2O4. 800. 2.59. Emerald. Be3Al2(SiO6). 400. 2.56. GGG. Gd3Ga5O12. 300. 2.55. GSGG. Gd3Sc2Ga3O12. 50. 2.45. LLGG. La3Lu2Ga3O12. -1000. 2.39. Fig. 2.5 Fluorescence spectra for Cr3+ ion in several laser host crystals [2.17]. 9.
(25) 2.1.3 Crystal field effect on Cr4+ energy level The Tanabe-Sugano correlation diagram for a tetrahedrally coordinated d2 system such as a Cr4+ ion is presented in Fig. 2.6 [2.11]. The 3F ground-state level of the free-ion splits into three components in an ideal tetrahedral site (Td symmetry): 3. F≡3A2+3T2+3T1 [2.16]. The energy of these levels is 3A2 < 3T2 < 3T1. Group theory. [2.22] predicts that, with the 3A2 level as the ground state, the 3A2→3T1 transition would be electric dipole allowed while the 3A2→3T2 transition would only be magnetic dipole allowed and should therefore be orders of magnitude less intense than the 3A2→3T1 transition. Lowering the symmetry to a distorted tetrahedron (D2d symmetry), i.e., stretching the tetrahedrons along the crystallographic axes, changes the ground state and results in an orbital splitting of the excited state [2.23]. In the D2d symmetry, the ground state 3A2 becomes 3B1, the 3T2 splits into 3B2 and 3E, and the 3T1 splits into 3A2 and 3E. The transition from the ground state into the 3E levels are electric dipole allowed. However, it is expected that the transition into the 3E(3T1) state is stronger than that into the 3E(3T2) state because the transition into the parent state in a Td symmetry was already electric dipole allowed for the former and only magnetic dipole allowed for the lattice. The 3B1(3A2)→3A2(3T1) transition is electric dipole allowed while 3B1(3A2)→3B2(3T2) transition is only magnetic dipole allowed. These energy levels, allowed electric and magnetic dipole transitions in Td, D2d, and D2d with spin-orbital splitting, are shown in Fig. 2.7 [2.24]. The spectroscopic study by Eilers [2.23] and Kück [2.25] et al. have confirmed that the visible absorption band between 600 nm and 700 nm is assigned to the 3B1(3A2)→3E(3T1) transition, and the strong NIR absorption band center at around 1000 nm is assigned to the 3. B1(3A2)→3A2(3T1) transition. The weak absorption at 1280 nm is due to the. 3. B1(3A2)→3B2(3T2) transition, while it is not possible to clearly identify the location of. the 3B1(3A2)→3E(3T1) transition. The corresponding absorption spectra of Cr4+:YAG at 10K as an example was shown in Fig. 2.8 [2.23]. Before their study, the strong NIR absorption band are generally assigned to the 3B1(3A2)→3E(3T2) transition, and the visible absorption band is assigned to the 3B1(3A2)→3E(3T1) transition for a long time [2.7].. 10.
(26) Fig. 2.6 Energy-level diagram as a function of the crystal field strength in units of Racah parameter B for the octahedrally coordinated d2 system (such as Cr4+) [2.11].. Fig. 2.7 Electronic energy levels of Cr4+ ion in Td symmetry, showing the splittings introduced by a D2d distortion and spin-orbital coupling [2.24]. 11.
(27) Fig. 2.8 10K absorption spectrum of Cr4+:YAG. The inset shows an enlargement of the lowest-energy transition [2.23].. As was noted previously, the related positions of the energy levels of transition-metal ions depend on the crystal field strength. The metastable level can be either 1E or 3T2, depending on the strength of the crystal field in the tetrahedral site. The strong or weak crystal field is the field above or below the cross-over point of the two states, respectively. In a weak crystal field, the transition is expected to be between 3T2→3A2 states, with a short fluorescence lifetime (spin-allowed transition) and broadband emission due to strong electron-phonon coupling. In a strong crystal field, where the electron-phonon coupling is weak and the transition is spin forbidden, we expect a long lifetime and narrowband emission due to the 1E→3A2 transition. The crystal field strength parameter Dq/B was calculated for several crystals. The value of Dq/B in Y3Al5O12 (YAG) [2.23], Y2SiO5 (YSO) [2.26], and Mg2SiO4 (forsterite) [2.27] are 1.78, 1.80, and 1.99, respectively. There values correspond to the relatively strong crystal fields where we have intermediate states that are very close to the cross-over points between 3T2 and 1E levels in Tanabe-Sugano diagram, or even mixed states of 3. T2 and 1E states. However, the strong orbital splitting of 3T2 into 3E and 3B2 brings. the 3B2 level below the 1E level, and this makes the Cr4+ behave as a weak crystal field system [2.23]. In addition, the crystal field analysis for the tetrahedrally coordinated Cr4+ ion is difficult, because the transitions to the crystal field 12.
(28) components of the 3T2 energy level are either weak and overlapping each other – like in Cr4+:YSO [2.26], or they are hidden under the stronger absorption of the 3T1 level – like in Cr4+-doped garnets [2.28]. In the tetrahedrally coordinated Cr4+ ion, due to the strong electron-phonon coupling and the distortion of the tetrahedral symmetry, it results in the broadband emission, which is 3T2→3A2 transition. Here, as shown in Table 2.2, we overview some of Cr4+-doped crystals whose fluorescence emission can be used as tunable solid-state lasers in the NIR spectral range. Various types of Cr4+-doped crystals can span the spectral range from 1150 nm to 1850 nm.. Table 2.2 The spectral characteristics of Cr4+-doped crystals.. Lattice. Emission peak (nm). Bandwidth (nm). Reference. Lu3Al5O12 (LAG). 1370. 232. [2.28]. Y3Al5O12 (YAG). 1378. 224. [2.28]. Y3ScxAl5-xO12 (YSAG) (x=0.22). 1397. 233. [2.28]. Y3ScxAl5-xO12 (YSAG) (x=0.48). 1407. 237. [2.28]. Y3ScxAl5-xO12 (YSAG) (x=1.20). 1468. 268. [2.28]. Y3ScxAl5-xO12 (YSAG) (x=1.50). 1508. 303. [2.28]. Y3ScxAl5-xO12 (YSAG) (x=1.72). 1593. 298. [2.28]. Y3Ga5O12 (YGG). 1456. 238. [2.28]. Gd3Ga5O12 (GGG). 1442. 231. [2.28]. Gd3Sc2Al3O12 (GSAG). 1599. 276. [2.28]. Y3Sc2Ga3O12 (YSGG). 1561. 279. [2.28]. Gd3Sc2Ga3O12 (GSGG). 1582. 299. [2.28]. Mg2SiO4 (forsterite). 1235. 150. [2.29]. Y2SiO5 (YSO). 1230. 250. [2.7]. 13.
(29) 2.2 Properties of Cr:YAG crystal In order for a material to be useful solid-state lasers applications, it must possess appropriate chemical, mechanical, thermal, and optical properties. These are determined by a combination of the inherent properties of the host material, the properties of the optically active ions, and the mutual interaction between the host and the dopant ions. Some criteria for laser materials are listed in Table 2.3 [2.17].. Table 2.3 Criteria for laser materials. Total system. 1. Economic production and fabrication in large size 2. Ion-host compatibility (a) Valence and size of substitutional ion similar to host ion (b) Uniform distribution of optical centers in the host Host material. 1. Robust and stable with respect to operational environment 2. Chemical: stability against thermal, photo, and mechanical changes 3. Mechanical (a) High stress-fracture limit (b) Small thermal expansion and stress-optic coefficients to lensing I High threshold for optical damage (d) Hardness for good polishing 4. Optical (a) Minimum scattering centers (b) Minimum parasitical absorption at lasing pumping wavelengths I Low refractive index to maximize the stimulated emission cross section Optically active centers. 1. Efficient absorption of pump radiation 2. Efficient internal conversion to metastable-state with small quantum defect 3. Appropriate energy storage time in the metastable-state to utilize all pump energy 4. Efficient radiative emission at the laser wavelength with high quantum efficiency 5. No absorption at the lasing wavelength (either ground or excited state) 14.
(30) Among possible hosts that have been used to date, YAG is the most used member because of its excellent mechanical and thermal properties. Furthermore, it can be grown easily in very high optical quality by Czochralski (CZ) method. YAG belongs to the garnet family with a cubic space group Ia3d (Oh10 is Schoenflies notation). The stoichiometric formula is {C3}[A2](D3)O12, where C, A, and D denote different lattice sites with respect to their oxygen coordination (dodecahedral, octahedral, and tetrahedral, respectively) and symmetry (222, 3 , and 4 , respectively) [2.28], as shown in Fig. 2.9. For the YAG structure, the site symmetry is dodecahedral for the Y3+ ions, octahedral for 40% of the Al3+ ion, and tetrahedral for 60% of the Al3+ ions.. Compounds with the garnet structure have interesting properties, such as YAG is good laser host material for the rare-earth ion and Cr3+. The large eight oxygen coordinated holes are ideal for the rare-earth ions and the octahedrally coordinated holes are of appropriate size of Cr3+ ion.. Fig. 2.9 The garnet structure. For the NIR broadband emission range from 1.2 μm to 1.6 μm, it is Cr4+ ion occupying the tetrahedrally coordinated lattice site. Although the garnets have cubic symmetry, the Cr4+:YAG exhibits some polarization properties due to the distorted tetrahedrally coordinated Cr4+ sites with D2d symmetry [2.23]. The room temperature. 15.
(31) absorption and fluorescence spectra were shown in Fig. 2.10. The absorption spectrum shows three broad bands at around 0.48 μm, 0.65 μm, and 1 μm. The 0.48 μm absorption band is not observed in the excitation spectrum and has been investigated to assign to Cr4+ in octahedral sites [2.31]. The absorption band around 0.65 μm and 1 μm are Cr4+ in tetrahedral sites associated with the transitions from 3. B1(3A2) to 3E(3T1) and 3A2(3T1), respectively. The fluorescence spectrum center at. 1.38 μm region results from 3B2(3T2)→3B1(3A2) transition. The corresponding energy level diagram of the Cr4+:YAG crystal is schematically shown in Fig. 2.11. In addition, some physical and optical properties of Cr4+:YAG crystal are listed in Table 2.4 [2.11, 2.32].. (a). (b) Fig. 2.10 (a) Absorption and (b) fluorescence spectra of Cr4+:YAG. Fluorescence spectrum was taken under Nd:YAG laser with wavelength at 1.06 μm [2.30].. 16.
(32) Td. D2d 3E. 3T 1. Pump ~0.65 μm 3E. 1E. 3A 2. 3T 2. Pump ~1 μm 3B 2. Emission ~1.38 μm 3B 1. 3A 2. Fig. 2.11 Energy level diagram of the Cr4+:YAG crystal.. Table 2.4 Physical and optical properties of Cr4+:YAG crystal. Crystal. Y3Al5O12 (YAG). Melting point. 1970 (oC). Hardness (Mohr). 8.5. Density. 4.56 (g/cm3). Index of refraction. 1.82 (at 1 μm). Thermal conductivity. 11-13 (W/mK). Thermal change in refractive index. 7.3×10⁻⁶ (K-1). Thermal expansion coefficient. 8.0×10⁻⁶ (K-1). Lattice constant. 12.01 (Å). Tunable range. 1.35-1.55 (μm). Absorption cross section. 5×10-18 (cm2). Emission cross section. 3.3 ×10⁻¹⁹ (cm2). Emission quantum efficiency. 22%. Fluorescence lifetime. 4.1 (μs). ESA cross section. 0.96×10⁻²⁰ (cm2) 17.
(33) 2.3 Fabrication and measurement for Cr:YAG crystal fiber Cr4+:YAG can be grown by Czochralski [2.33, 2.34], floating zone [2.34], pulsed laser deposition [2.35], and laser-heated pedestal growth [2.36] methods. However, for the production of crystal fiber with 100 μm in diameter, it only can be achieved by LHPG method. Furthermore, the LHPG method is fast, economical, flexible and easy to adjust conditions of growth and dopant concentrations. Besides, the shape of the molten zone, macroscopic crystal defects, and the interface shape can be observed directly during growth. Therefore, a LHPG system has been constructed for growing the 100-μm-sized single-crystal fibers. In this section, the LHPG system and fabrication processes of crystal fibers were described, and the then some of measurement for examining the quality of crystal fibers was introduced.. 2.3.1 LHPG system and fabrication processes A schematic of our LHPG system is shown in Fig. 2.12. The heat source is a 100 W polarized CO2 laser (Spectron Laser system) with wavelength of 10.6 μm. The laser power can be adjusted by a zinc selenide (ZnSe) Polarizer-Analyzer-Attenuator (ΙΙ-VI Inc.). The CO2 laser system has a collinear He-Ne laser with wavelength of 632.8 nm as indicator because the CO2 laser beam is invisible. After passing through a ZnSe beam-expansion telescope, the CO2 beam shines into the growth chamber. The telescope expands the CO2 beam size to three centimeter in diameter. Within the growth chamber, as shown in Fig. 2.13, the incident Gaussian shape of CO2 laser is converted to a uniform donut-shape beam to heat the crystal. The pulling and feeding mechanisms are outside the chamber, and consist of computer-controlled linear stage driven by stepping motor with gearbox to reduce vibration. The maximum pulling length is 20 cm with the pulling speeds from 0.375 to 37.5 mm/min. Source material can be prepared in the forms of either round or square cross-section rods. The crystal growth process is shown in Fig. 2.14. A seed rod is used to determine the crystallographic orientation of the fiber to be grown. The growth starts from using a tightly focused CO2 laser to heat and melt the top end of the source rod, and then the seed rod is dipped into the molten zone. Finally, a single-crystal fiber is grown by pulling the seed rod and feeding the source rod upward simultaneously at a constant 18.
(34) growth ratio. By repeating this growth processes, the crystal fibers can be achieved with diameters of 920 μm to 23 μm.. ZnSe mirror 100 W CO2 laser. PC. PD. ZnSe mirror. Growth chamber Power ZnSe attenuator beam splitter. ZnSe telescope. Fig. 2.12 The LHPG system.. Paraboloidal mirror. CO2 laser beam Planar mirror. Reflaxicon Fig. 2.13 Growth chamber.. 19.
(35) Push. Oriented seed Growing crystal Pull CO2 laser Molten zone. Source rod Feed. Fig. 2.14 Illustration of single crystal growth by LHPG method. The whole system is controlled by a LabVIEW (7.0, National Instruments) program, such as motion control and laser power feedback. Due to the power fluctuation of CO2 laser will affect the diameter variation of crystal fiber, the laser power feedback program was utilized to decrease the power fluctuation. By detecting the laser power through the thermal coupler photodetector (PD) (818T-30, Newport) and controlling the angle of Polarizer-Analyzer-Attenuator, the original fluctuation of CO2 laser is from ±3% down to ±0.1%. In the Fig. 2.15, it shows the photography of a 70-μm-diameter crystal fiber of Cr4+:YAG grown at speed of 10 mm/min, the diameter variation is about ±1.1% over 1 cm in length. In addition, the more detailed description for fabrication processes can be found elsewhere [2.37].. 70 μm. 200 μm Fig. 2.15 Photography of a 70-μm-diameter crystal fiber of Cr4+:YAG. 20.
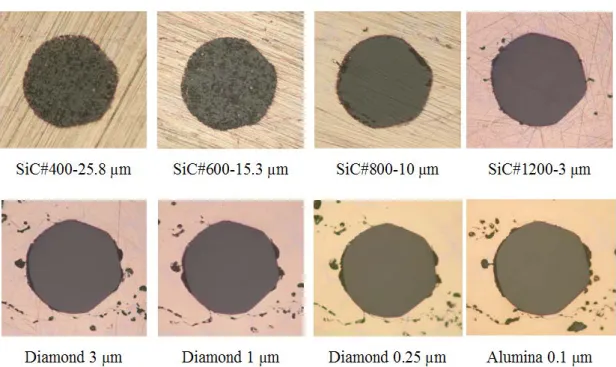
(36) 2.3.2 Sample preparation Cr:YAG crystal fiber was grown from source materials with 2×2 mm2 in cross section and <111> in crystal orientation by using LHPG method. The crystal fibers were packaged by low-melting-point (821oC) Pyrex glass capillary as cladding and fused by gas torch (acetylene/oxygen flame). The cladding sample was mounted in the heat-pressed conductive carbon powders for further grinding and polishing. First, the crystal fibers were ground with silicon carbide (SiC) paper from #400 (grit size of 25.8 μm) to #1200 (grit size of 6 μm) under rotation speed of 300 rpm. Table 2.5 lists the number of SiC papers and its corresponding grit sizes. Each grinding step usually takes 1-3 minutes or longer until the scratches on the end face are in the same direction. Then it continued to be polished with diamond polishing cloths of 3 μm, 1 μm, and 0.25 μm for about 2-3 minutes to get good surface quality. In order to obtain. the optimal optical quality, alumina polishing with 0.1 μm is employed in the final step. Table 2.6 shows the summary of the mechanical preparation and its corresponding preparation time for crystal fiber samples. During the grinding processes, the stereomicroscope (SZ11, Olympus) with 110-fold magnification was used to observe the surface quality roughly. In the polishing processes, the crystal quality is fine, it needs to use metallurgical microscope (Optiphot-100, Nikon) with 1-μm spatial resolution for observation. Figure 2.16 shows the revolution of surface quality after grinding and polishing. After polishing to 0.1 μm grit size of alumina, the surface quality is good for electron probe micro-analyzer (EPMA) and laser scanning confocal microscopy measurements. By the way, it can be seen that the YAG boundary is a hexagon-like form due to the fiber was grown from the <111>-oriented seed YAG. Table 2.5 SiC grit size (USA).. Number. 120. 400. 600. 800. 1200. Grit size (μm). 106. 25.8. 15.3. 10. 3. 21.
(37) Table 2.6 The mechanical preparation of crystal fiber samples. Grinding processes. # of SiC paper. Preparation time (min). # 400. 1. # 600. 1. # 800. 1. # 1200. 3. Polishing processes. Types of. Grit size of diamond. The amount of lubricant Preparation time. polishing cloths. abrasives. (drop/min). (min). MD-Pan. 3 μm. 6. 2-3. MD-Dur. 1 μm. 6. 2-3. MD-Nap. 0.25 μm. 6. 2-3. SP-Policel 2. 0.1 μm, alumina paste. 6. 2. Fig. 2.16 The revolution of surface quality after grinding and polishing.. 22.
(38) 2.3.3 Refractive index measurement The refractive index profile of crystal fiber was measured by perpendicular Fresnel reflection. A schematic of the experimental arrangement is shown in Fig. 2.17. A distributed feedback (DFB) (S1FC635, Thorlabs) laser with wavelength of 635 nm is focused by 40× microscope objective lens, yielding a minimum spot of 1 μm at the fiber end face. The fiber is mounted upon a five-axis micropositioner and is accurately aligned to be perpendicular to the focus axis of the objective lens. The crystal fiber was positioned at the focus of the objective lens, and the reflected signal is filtered by pinhole and then focused onto a silicon photodiode (DET 210, Thorlabs). The signal from this photodiode is digitized with a 12-bit analog-to-digital converter (DAQPad-6020E, National Instruments) in the control computer. A beam splitter is used to reflect the pump laser and transmit the signal. The system is necessary to have a sample of known refractive index to measure absolution values of refractive index.. Eyepieces Focal lens Objective lens Prism Silicon PD. Pinhole Beam splitter. DFB laser (635 nm). Objective lens 40X/0.65 Sample 2D-stepping motor. Fig. 2.17 Refractive index measurement setup.. 23.
(39) 2.3.4 Laser scanning confocal microscopy. LSCM has been widely applied in bio-medical and many other researches [2.38, 2.39]. In LSCM, the laser is focused to a diffraction-limited beam waist with sub-micron in diameter. It provides depth discrimination and spatial resolution within the plane of focus for forming the image through a pinhole place in the front of the detector, which acts as a spatial filter to select emission from the plane of focus. Both reflection and fluorescence images with sub-micron definition can be acquired rapidly [2.40]. Here, we utilized the property of the different spectral characteristics of 3+ and 4+ oxidation states of Cr ions by using LSCM for distinguishing Cr3+ and Cr4+ ions. The fluorescence spectra of Cr3+ and Cr4+ in YAG are shown in Fig. 2.18. Figure 2.18 (a) shows the Cr3+:YAG spectrum, which is a sharp R-line (689 nm from 2E→4A2 transition) associates with three phonon sidebands (675, 707, and 726 nm) [2.41]. In Fig. 2.18 (b), the Cr4+:YAG spectrum shows the broadband emission from 1.2 to 1.6 µm resulting from 3T2→3A2 transition. The central wavelength is at 1.38 µm and its 3-dB bandwidth is 265 nm. 1.0. Cr3+ fluorescence spectrum. Fluorescence intensity (a.u.). Fluorescence intensity (a.u.). 1.0. 0.8. 0.6. 0.4. 0.2. 0.0 625. 650. 675. 700. 725. 750. 775. Cr4+ fluorescence spectrum 0.8. 0.6. 0.4. 0.2. 0.0 1100. 800. 1200. 1300. 1400. 1500. 1600. 1700. Wavelength (nm). Wavelength (nm). (b). (a). Fig. 2.18 The fluorescence spectra of (a) Cr3+ and (b) Cr4+ in YAG.. However, in the commercial LSCM, the use of detector system is photo multiplier tube (PMT), which can not measure the signal wavelength longer than 800 nm. That is not suitable for Cr4+ fluorescence measurement. In addition, the design of mirror scanning system for quantitative analysis will suffer from optical aberration. 24.
(40) through the objective lens. Therefore, we built a homemade LSCM, as shown in Fig. 2.19. A 2-D stepping motor with 0.625 μm resolution is used to replace the scanning mirror. It can avoid the optical aberration by fixing the optical path for sample scanning. For the Cr3+ fluorescence measurement, a frequency doubled Nd:YAG laser with a wavelength at 532 nm was used as Cr3+ fluorescence excitation light source. The dichroic beam splitter 1 is the Cr3+ dichroic beam splitter, as shown in Figure 2.20 (a), which is designed to reflect the excitation laser (532 nm) and pass through the Cr3+ fluorescence (600-900 nm). A 40× objective lens with NA of 0.65 focused the laser beam to achieve 1-μm laterally spatial resolution. An incident power of 5 mW was measured after the objective lens. After pumping by laser beam, the generation of fluorescence signal was collected by the same objective lens and passed through the Cr3+ dichroic beam splitter. In the dichroic beam splitter 2, it was used for passing through the Cr3+ fluorescence (600-900 nm) and reflecting the Cr4+ fluorescence (1200-1700 nm). A band pass filter with a transparent window from 600 to 900 nm was set for increasing the signal-to-noise ratio, followed by a 50 μm diameter pinhole for spatial filtering. Finally, a silicon photodiode (DET 210, Thorlabs) and the optical spectrum analyzer (86142A, HP) were used for measuring Cr3+ fluorescence intensity and spectrum. For the Cr4+ fluorescence measurement, an Yb fiber laser (DPIR-2200T, Casix) of 10 mW with a wavelength at 1.064 μm was used. The system needs to switch to another dichroic beam splitter 1 (Cr4+ dichroic beam splitter) which was designed to reflect excitation laser (1064 nm) and pass through the Cr4+ fluorescence (1200-1700 nm), as shown in Fig. 2.20 (b). The Cr4+ fluorescence signal is reflected by the dichroic beam splitter 2, and then a long pass filter is set for passing through the wavelength longer than 1300 nm to distinguish the Cr4+ fluorescence against the excitation laser and noise. After a 50 μm diameter pinhole, an InGaAs photodiode (G8370-05, Hamamatsu) and the optical spectrum analyzer were used for measuring Cr4+ fluorescence intensity and spectrum.. 25.
(41) Silicon PD Lens (For Cr3+). Objective lens. Eyepieces. Dichroic BS 2. Prism Pinhole Optical spectrum analyzer. 600-900 nm band pass filter. Dichroic BS 1. Yb fiber laser (1064 nm). 1300 nm long pass filter. Frequency doubled Nd:YAG laser (532 nm). Objective lens. Objective lens 40X/0.65. Pinhole Lens. Sample Optical spectrum analyzer. 2D-stepping motor InGaAs PD (For Cr4+). Fig. 2.19 Laser scanning confocal microscope setup.. Transmittance (%). 100 80 60 40. Cr3+ dichroic beam splitter. 20 0 500. 600. 700. 800. 900. 1000. 1100. Wavelength (nm). (a). Transmittance (%). 100 80 60. Cr4+ dichroic beam splitter. 40 20 0 1000. 1100. 1200. 1300. 1400. 1500. 1600. 1700. Wavelength (nm). (b) Fig. 2.20 The transmittance spectra of (a) Cr3+ and (b) Cr4+ dichroic beam splitters. 26.
(42) 2.3.5 Fluorescence lifetime measurement The measurement setup for Cr4+ fluorescence lifetime is shown in Fig. 2.21. The continuous wave (CW) Yb fiber laser power was modulated at 3 kHz by optical chopper (MC1000A, Thorlabs) with 30-solt blade, as shown in Fig. 2.22. The laser beam was focused by 10× objective lens with NA of 0.25 to minimize the duration of fall time. The fall time is the measure of the time response of a photodiode to a stepped light output, and is defined as the time required for the output to change from 90% to 10% of the steady output level. The signal was recorded by a 500 MHz oscilloscope (54615B, HP) with 50 Ω input impedance for high speed detection. However, under the 50 Ω input impedance, the signal is small, and needs to be amplified by a RF amplifier (ZPUl-30P, Mini-Circuits) of 30 dB gain with frequency ranges of 2.5 kHz to 700 MHz. Before measuring the Cr4+ fluorescence lifetime of Cr4+:YAG, the system response needs to be calibrated. As shown in Fig. 2.23, the fall time of system response is 0.9 μs, which is sufficient to measure the fluorescence time of Cr4+:YAG, i.e. about 4.1 μs.. I (a.u.). I (a.u.). A (V). T (s). T (s). T (s). Sample. Yb fiber laser (1064 nm). Detector Objective lens. Objective lens. Objective lens. Lens Filter. InGaAs PD. A (V). Chopper ( 3 kHz). T (s). Oscilloscope. RF amplifier 30 dB gain 2.5 kHz-700 MHz. Fig. 2.21 Measurement setup for Cr4+ fluorescence lifetime.. 27.
(43) 1.0. Voltage (a.u.). 0.8 0.6 0.4 3 kHz 0.333 ms. 0.2 0.0 -0.0006. -0.0004. -0.0002. 0.0000. 0.0002. 0.0004. 0.0006. Time (s) Fig. 2.22 The modulated laser power at 3 kHz.. 1.0. Voltage (a.u.). 0.8. 90%. 0.6. Fall time: 0.9 μs 0.4. 0.2. 10% 0.0 498. 499. 500. 501. 502. 503. Time (μs) Fig. 2.23 The fall time of system response.. 28. 504.
數據
![Fig. 2.2 Single configuration coordinate diagram of a transition-metal ion coupled to a vibrating lattice [1.13]](https://thumb-ap.123doks.com/thumbv2/9libinfo/8768092.210686/21.892.223.682.347.738/single-configuration-coordinate-diagram-transition-coupled-vibrating-lattice.webp)
![Table 2.1 Crystal field parameters for Cr 3+ ion in several laser host crystals [2.17-2.20]](https://thumb-ap.123doks.com/thumbv2/9libinfo/8768092.210686/24.892.152.747.394.1107/table-crystal-field-parameters-cr-laser-host-crystals.webp)
![Fig. 2.8 10K absorption spectrum of Cr 4+ :YAG. The inset shows an enlargement of the lowest-energy transition [2.23]](https://thumb-ap.123doks.com/thumbv2/9libinfo/8768092.210686/27.892.240.656.123.451/absorption-spectrum-inset-shows-enlargement-lowest-energy-transition.webp)
+7


相關文件
• helps teachers collect learning evidence to provide timely feedback & refine teaching strategies.. AaL • engages students in reflecting on & monitoring their progress
Robinson Crusoe is an Englishman from the 1) t_______ of York in the seventeenth century, the youngest son of a merchant of German origin. This trip is financially successful,
fostering independent application of reading strategies Strategy 7: Provide opportunities for students to track, reflect on, and share their learning progress (destination). •
Strategy 3: Offer descriptive feedback during the learning process (enabling strategy). Where the
How does drama help to develop English language skills.. In Forms 2-6, students develop their self-expression by participating in a wide range of activities
Now, nearly all of the current flows through wire S since it has a much lower resistance than the light bulb. The light bulb does not glow because the current flowing through it
(d) While essential learning is provided in the core subjects of Chinese Language, English Language, Mathematics and Liberal Studies, a wide spectrum of elective subjects and COS
O.K., let’s study chiral phase transition. Quark
