以臨床病理型態、微衛星測試和 cDNA 微陣列共同分析胃癌
之亞型特徵(2/3)
計畫類別: 個別型計畫 計畫編號: NSC92-3112-B-002-025- 執行期間: 92 年 05 月 01 日至 93 年 04 月 30 日 執行單位: 國立臺灣大學醫學院內科 計畫主持人: 林肇堂 共同主持人: 楊泮池,吳明賢 報告類型: 完整報告 處理方式: 本計畫可公開查詢中 華 民 國 93 年 4 月 29 日
National Research Program for Genomic Medicine
National Science Council, the Executive Yuan, ROC.
計畫名稱-中文
以臨床病理型態、微衛星測試和cDNA微陣列共同分析胃癌之亞型特徵
計畫名稱-英文
Characterization of Subsets of Gastric Cancer by Combined
Clinicopathologic, Microsatellite, and cDNA Microsarray Analyses
報告類別:□ 新進研究計畫 □ 修正後計畫書
;
年度成果
報告
(New Proposal)
(Revised Proposal)
(Progress
Report)
計畫類別:
;
個別型計畫 □ 整合型計畫
(Individual
Project)
(Program
Project)
計畫編號:
NSC91-3112-B002-007計畫主持人 (Principle Investigator):林肇堂
共同主持人 (Co-Principle Investigator):楊泮池 吳明賢
執行單位 (Institution):
台大醫學院National Research Program for Genomic Medicine
National Science Council, the Executive Yuan, ROC.
Progress Report—Research Project
基因體醫學國家型科技計畫
國科會延續性計畫進度報告
個別型計畫 (Individual Project)
Program Classification:
;
Genomic Medicine Bioinformatics
Proteomics & Structural Genomics ELSI
Project Number
:NSC92-3112-B002-025
(計畫編號)NSC Funding Number: NSC93-3112-B002-017
(93年度國科會預核編號) (in Chinese) 中文 以臨床病理型態、微衛星測試和 cDNA 微陣列共同分析胃癌之亞 型特徵 Title of Project 計畫名稱 (in English) 英文Characterization of Subsets of Gastric Cancer by Combined Clinicopathologic, Microsatellite, and cDNA Microsarray Analyses
(in Chinese) 中文
台大醫學院內科
Institution
研究(執行)單位
(in English) 英文
Department of Internal Medicine, National Taiwan University College of Medicine (in Chinese) 中文 林肇堂 Principle Investigator 計畫主持人 (in English) 英文
Jaw-Town Lin
FY 2002 2003 2004 Total
Budget
2,197,000 2,319,700
2,272,135
6,788,835
(in NT dollars: 1USD = 34 NTD)
TABLE OF CONTENTS
Progress Report... 4
1. Response to previous reviewers’ critiques ...4
2. Specific
Aims...5
3. Progress
Summary ...7
4. Projected Timeline & Brief Summary of Plans for Next Year ...14
5. Personnel...15
6. Publications and/or Patents...16
6a. Publications...16
6b. Patents...17
Progress Report
1. Response to previous reviewers’ critiques
Please describe the previous reviewers’ critiques and how based on the
critiques
,
you made modifications to specific aims, experimental design, or
resource allocation etc.
2. Specific Aims
Please state the overall goals of the project, and specific aims, as reviewed
and approved by the Study Section and actually awarded. If these specific
aims as actually funded did not differ in scope from those actually pursued
during the grant period, and if the aims have not been modified, state this.
If they have been modified, give the revised aims.
Gastric cancer (GC) is the second most frequent cause of death form cancer in both sexes in the world. It is noteworthy that GC is heterogeneous in histology, location, clinical manifestation, and course. GC can be classified into intestinal and diffuse subtypes according to histology, and can be assorted to cardia and noncardia cancer by anatomic location. Such heterogeneity suggests that GC may be a collection of related, but molecularly distinct diseases. Two genetic pathways, including chromosomal –instability pathway, also known as the microsatellite stable pathway, and microsatellite instability pathway, have been demonstrated to play a role in colonic and gastric carcinogenesis. We have demonstrated that different genetic alterations are involved in different clinicopathologic and epidemiologic features of GC with respect to its anatomic location and histologic subtypes. It is crucial to stratify GC into different histologic types and tumor stages for adequate molecular and pathogenic analysis. This project has been designed to define the spectrum of genetic alterations of GC by laser capture microdissection (LCM) and microarray analysis. Such research may further yield important information in the early detection and prognostic categorization of GC. Specific aims of this study including:
(1) To establish a clearer picture of molecular classification of GC by analyzing gene expression profiles in different categories of GC.
(2) To determine molecular markers for predicting progression and prognosis of GC by analyzing gene expression profiles in early, advanced, and metastatic GC. (3) To clarify the role H. pylori in gastric carcinogenesis by analyzing gene expression
profiles in H. pylori-positive and-negative GC.
(4) To redefine the genetic pathways leading to mutator phenotypes by analyzing gene expression profiles in microsatellite instability and microsatellite stable GC. (5) To identify different underlying genetic alterations in cardia and noncardia GC. Following hypotheses will be tested:
(1) Gastric carcinogenesis is a multistep process accompanied by accumulations of multiple genetic alterations.
(2) The evolution of sequential histological changes from normal cells, precursor lesion, to invasive cancer is underlied by different moleculer basis of progression. (3) Etiology-specific critical regulatory genes may be responsile for GC.
(4) GC with microsatellite instability and microsatellite stable GC represents two different disease entities with distinct genetic pathways.
(5) A different spectrum of genetic changes is involved in different histologic form or location.
3. Progress Summary
Summarize concisely the results obtained for
each specific aim during
the past year (or reporting period)
. Negative results, if any, should also
be included and approaches taken to improve the prospects of the project
discussed.
(Do not exceed
5 pages
, not including figures and references.)
In the past two year, we have collected 75 cancer tissues and their respective non-cancerous tissues from patients with GC who underwent surgery at the National Taiwan University Hospital. There were totally 54 males and 21 females with a ratio of 2.57:1. Both the tumor and the neighboring nontumorous tissues of each patient were obtained at the time of surgery and preserved separately at -70 C until use. Their relevant demographic and clinicopathologic information was obtained from medical records. Mutator phenotype (microsatellite instability) was determined by 5 microsatellite loci defined by the National Cancer Institute, including BAT 25, BAT26, D5S346, D2S123, and D17S250. To establish the microarray system for further analysis of GC tissues in vitro, we have used the RNAs extracted from the human gastric cancer (AGS) and macrophage (THP-1) cell lines, which were co-cultured with 3 different clinical isolates of H. pylori from duodenal ulcer, gastric cancer, and Maltoma patients, respectively. Three different H. pylori strains induced distinct gene expression patterns in GC and macrophage cell lines. The results, in addition to shed light on the interaction of bacteria and host and possible mechanism of H. pylori-related gastric carcinogenesis, confirm the accountability of the microarray system we used (Agilent cDNA array).
Till the April 30, 2004, we have procured pure cancer cells from 45 cancerous tissues from GC for further RNA extraction and amplification by PixCell II LCM System and CapSure HS LCM caps (Acturus, Mountain View, California). After procurement of more than 2,000 cells, total RNA was extracted using PicoPure RNA
Isolation Kit (Arcturus, Mountain View, California, USA). The quality of RNA extracted from LCM procured cells was determined by Bioanalyzer before further amplification and hybridization. Only 21 of their RNAs qualified for further amplification. Total RNA purified from LCM samples was amplified twice by Riboamp kit (Acturus, Mountain View, California) to antisense RNA (aRNA).Then, 1 µg of aRNA are converted to cDNA using a 3DNATM Array 50 Expression Array Detection Kit (Genisphere, USA). The labeled cDNA is hybridized to Human 1 cDNA microarray (Agilent Technologies, USA). After first hybridizing with cDNA, microarrays are then hybridized with Cy3 and Cy5 dendrimers in formamide-based buffer. After washing and drying by
centrifugation, microarrays are scanned with a Virtek fluorescence reader (Virtek, CA) at 535 nm for Cy3 and 625 nm for Cy5. Scanned images are analyzed by
Array-Pro image acquisition software (Media Cybernetics, USA), an image analysis algorithm is used to quantify signal and background intensity for each target element. Data normalization is performed by Lowess method using R package (written by Terry Speeds Microarray Data Analysis Group, University of Berkeley). Dye Swap duplication was performed in each sample. We have hybridized total 62 arrays, including 42 arrays for cancer (21 cases with dye-swap duplication) and 20 arrays for nontumorous cells (10 cases with dye-swap duplication) with universal reference. Preliminary analysis of the microarray data by unsupervised hierarchical clustering algorithm yields no meaningful classification of cancerous and
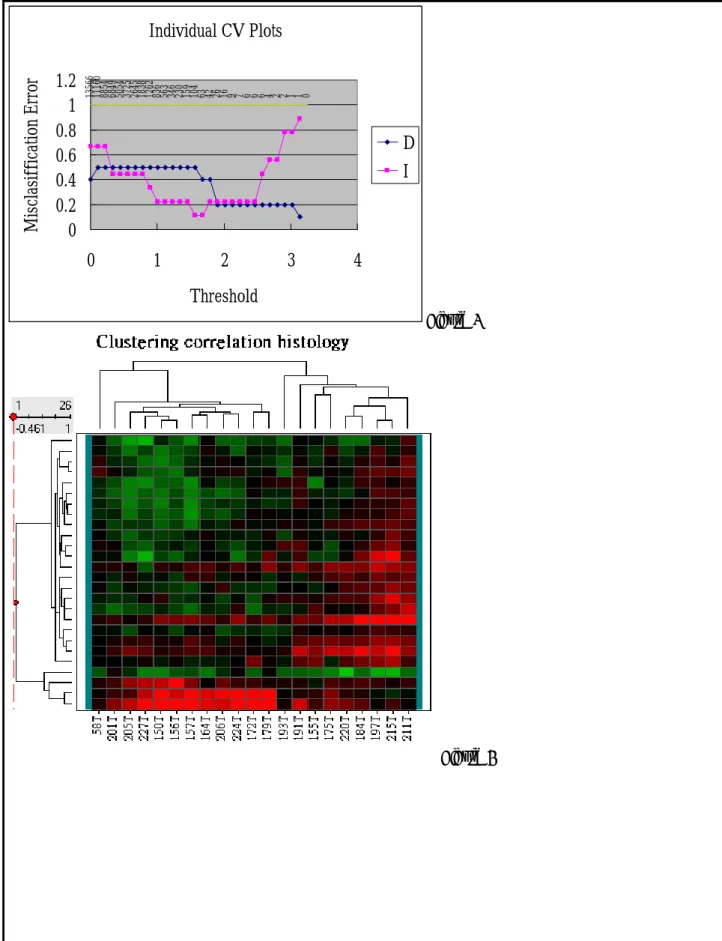
noncancerous groups. We used a software developed by researcher in Standford University- Prediction Analysis of Microarray (PAM ) and Spotfire software to analyze the data and found that there were 504 genes which can distinguish the cancerous and noncancerous groups with more than 99% accuracy. Analysis the tumor group with these 504 genes showed that there were 3 subgroups of gastric cancer did not
respond to any classification system used today, including Lauren’ classification (Figure 1). Of the 504 genes, Trefoil factors 1, 2, and 3 are in the list of genes and their expression pattern are similar to previous study. The results confirmed our
microarray data indirectly and implied there existed a new molecular classification of gastric cancer. The clinical significance of the new classification needs further studies. In addition, one aim of this study is elucidate the different genetic
alternations of MSI and MS stable gastric cancer. We found there were 11 genes, including MutL (involved in DNA repair), interleukin 13, annexin A1, Down syndrome critical region gene 1, and Human (JER47) MUC5AC mRNA for mucin (partial) et al, differentially expressed between these two groups of gastric cancer (figure 2&3). In addition to compare the differential gene expression profile of MSI and MS stable gastric cancer, we also analyzed the differential gene expression profiles between cardiac and noncardiac gastric cancers(figure 4&5), and between intestinal and diffuse type gastric cancers(figure 6&7). Further studies to elucidate the role of these genes in the pathogenesis of MSI and MS gastric cancer and different subtypes of gastric cancer are under going.
2b. Studies and Results (Cont.) Figure 2 Figure 3 Individual CV Plots 0 1 2 2 3 5 8 11 12 16 21 27 43 70 10 4 16 5 25 5 37 0 54 5 79 9 1157 1714 2460 3347 4531 5960 7683 9536 1156 4 1356 6 0 0.2 0.4 0.6 0.8 1 1.2 1.4 0 1 2 3 4 Threshold Mi sc la si ffi ca ti on E rro r MSN MSP
Figure 4 Figure 5 Individual CV Plots 0 1 1 2 2 2 4 4 7 11 13 19 22 33 61 89 146 241 368 540 821 1236 1861 2658 3797 5251 6949 8962 11111 13566 0 0.2 0.4 0.6 0.8 1 1.2 1.4 0 1 2 3 4 Threshold M is cla si ff ic atio n E rr or C NC
Figure 6 Figure 7 Individual CV Plots 0 1 1 2 2 4 6 6 6 7 9 16 26 42 63 104 159 230 346 563 836 1262 1838 2645 3725 5054 6849 8854 11160 13566 0 0.2 0.4 0.6 0.8 1 1.2 0 1 2 3 4 Threshold M is cla si ff ica tion E rr or D I
4. Projected Timeline & Brief Summary of Plans for Next Year
Provide a short paragraph to describe the plans for next year including a
realistic timetable and appropriate milestones for the project, based on the
progress reached so far. (Do not exceed
1 page
.)
In the next year, we are going to confirm the new classification of different
subtypes of gastric cancers by our microarray results. The interesting genes,
including IL13 and annexin A1, are under evaluation by
immunohistochemical staining on gastric cancer tissues. The result will be
published in the near future.
Month
1 2 3 4 5 6 7 8 9 10 11 12
Immunohistochemical
staining
Data analysis
Publication of final
results
5. Personnel
Summarize the
personnel involved in the project during the grant
period
. List the personnel in accordance to the following categories: (1)
senior investigators, including visitors; (2) postdoctoral fellows; (3)
graduate students; (4) technicians or research assistants. Specify for each
individual the period of involvement and the percentage commitment of
effort.
Name In Chinese In English Position Title Education Degree % of personal effort on this project Job Description or Responsibilities 林肇堂 楊泮池 吳明賢 張毓廷 王珮琳 Lin Jaw-Town Yang Pan-Chyr Wu Ming-Shiang Chang Yu-Ting Wang Pai-Lin PI Co-PI Co-PI Ph.D. Student Research Assistant MD. PhD. MD. PhD. MD. PhD. MD. MS. Bachelor 100 30 30 100 100Study design, administration, data collection, interpretation, report writing
Director and monitor of microarray techniques
Conduct experiments in genetic alterations other than those from microarray
Full time experiment including genetic alteration, LCM, and microarray
Full time experiment including genetic alteration, LCM, and microarray
6. Publications and/or Patents
6a. Publications
List the title and complete references (author(s), journal or book, year,
page number) of all publications
directly resulting from studies
supported by the project (i.e., with citation of this grant in the
acknowledgement section)
. List the publications for the project in
accordance to the following categories: (1) manuscripts published and
accepted for publications; (2) manuscripts submitted; and (3) conference
proceedings. Provide one copy of each publication not previously reported
to the National Science Council in the Appendix.
Distinct Gene Expression Profiles in Gastric Epithelial Cells
Induced by Different Clinical Isolates of Helicobacter pylori----
Implication of Bacteria and Host Interaction in Gastric
Carcinogenesis(
manuscript submitted
)(See appendix)
Distinct Gene Expression Profiles in Microsatellite Instable and
Stable Gastric Cancers Analyzed by Microarray (manuscript in
preparation)
6b. Patents
List all inventions disclosed, patents filed, and patents granted. Please note
the inventors, assignee, title of patent, country or area where patent applied
for, filing or issued number and date.
Distinct Gene Expression Profiles in Gastric Epithelial Cells
Induced by Different Clinical Isolates of Helicobacter pylori----
Implication of Bacteria and Host Interaction in Gastric
Carcinogenesis
Yu-Ting Changa, Ming-Shiang Wua,Ya-Jen Changb, Ching-Chow Chenb, Yi-Shing Linc, Tracy Hsiehc, Pan-Chyr Yanga, and Jaw-Town Lina. Departments of aInternal Medicine and bPharmacology,National Taiwan University Hospital, College of Medicine, National Taiwan University, Taipei;
cGenasia Biotechnology, Ltd., Taipei, Taiwan
Corresponding author: Jaw-Town Lin, M.D., Ph. D.
Address: Department of Internal Medicine, National Taiwan University Hospital,
No.7, Chung-Shan South Road, Taipei, Taiwan Telephone: 886-2-23123456 ext.5695
Fax: 886-2-23947899
e-Mail address: [email protected]
Running title: Gene Expression in Gastric Epithelial Cells Induced by
Helicobacter pylori
Abstract
Helicobacter pylori (H. pylori) infection is a major risk factor of peptic ulcer, gastric cancer, and gastric mucosa-associated lymphoid tissue (MALT) lymphoma. The interplay between H. pylori and host determines the various outcomes after infection and is an important issue for further elucidation of pathogenesis of H. pylori-related diseases. The availability of cDNA microarray creates the unprecedented opportunity to examine simultaneously dynamic changes of multiple molecular pathways affected by different H. pylori strains infection. To elucidate the cross-talk of H. pylori and gastric epithelial cells, three different clinical isolated H. pylori strains, GC, DU and MA strain, isolated from patients of gastric cancer(GC), duodenal ulcer(DU), and gastric MALT lymphoma (MA), were cocultured with AGS cells for 6 hours. Total RNA was extracted and used for detection of genes represented in the Human 1 cDNA Microarray (Agilent).Validation of microarray data were done by Western blot analysis of selected genes. Of the 12,814 clones on the Human 1 cDNA microarray, there were 522 genes expressed differently in the three groups. Of the 522 genes, there were 4 genes, 4 genes and 13 genes, either up- or down-regulated more than twofold change, in AGS cells induced specifically by GC, MA and DU strain respectively. The GC and DU strains induced more genes involving in carcinogenesis, such as pim-1, jun B, and VEGF. In the study, we provide evidence of bacterial factors may determine the outcomes of H.
pylori infection. Different bacterial virulent factors, other than cagA and vacA,
are critical in the development of various gastroduodenal diseases. The expression profiles of cDNA microarray provide clues for diagnosis, treatment and prevention of H. pylori-related gastroduodenal diseases.
Introduction
Helicobacter pylori (H. pylori) is a prevalent gram-negative bacterium. The
infection of H. pylori has been recognized as a major risk factor in the development of chronic active gastritis, peptic ulcer disease, and gastric cancer[1]. The prevalence of H. pylori-related diseases varies in different geographic regions and patient populations[2]. However, the majority of H.
pylori colonized individuals remain asymptomatic; approximately 20% of
infected patients develop clinically significant diseases such as peptic ulcer, gastric adenocarcinoma, or gastric mucosa-associated lymphoid tissue (MALT) lymphoma[1, 3]. This variability in clinical outcomes may result from differences in inflammatory responses governed by host genetics, and specific interactions between host and microbial determinants[3].Bacterial virulence, host genetic, and environmental factors are among the critical determinants that predispose to the clinical manifestation of H. pylori infection.
H. pylori populations are extremely diverse[4, 5] because H. pylori has a
very plastic genome, reflecting its high rate of recombination and point mutation. Different H. pylori strains have different effects on cellular turnover and level of apoptosis of gastric mucosal epithelial cells [6-10]. Previous studies have shown that the presence of cag pathogenicity island (PAI) and specific genotype of vacA or iceA gene are more frequently associated with H.
pylori-related diseases [11, 12]. It implied that differences in virulence factors
that characterize different strains of H. pylori could influence the clinical outcome of H. pylori infection. However, the virulent markers for H. pylori strains that affect Western populations have little or no predicative power in East Asian populations[13, 14]. The molecular pathways of gastric carcinogenesis and H.
pylori-related diseases are multiple, producing complex pattern of molecular
changes in gastric epithelial cells. It is of fundamental importance to understand the main molecular pathways affected by H. pylori in epithelial cells in order to identify the critical steps in induction of H. pylori-related diseases, such as duodenal ulcer, gastric caner, and gastric MALT lymphoma. The availability of cDNA microarray reference creates the unprecedented opportunity to examine simultaneously dynamic changes of multiple pathways affected by different H.
pylori strains infection. In this study, we apply the microarray technology to
examine the broad patterns of gene expression of gastric epithelial cell lines which co-culture with three different clinical isolates of H. pylori. Understanding the molecular pathway affected by different H. pylori in the gastric epithelium may provide novel approaches to screening the high risk group and identification of molecular targets for further prevention of peptic ulcer disease, gastric cancer, and gastric MALT lymphoma.
Materials and Methods
Bacteria and growth conditions
The H. pylori strains employed in this study included gastric cancer (GC)
strains, duodenal ulcer (DU) strains, and gastric MALT lymphoma (MA) strains originally isolated from patients with gastric adenocarcinoma, duodenal ulcer, and gastric MALT lymphoma, respectively. H. pylori strains were grown on Columbia agar plates containing 5% (vol/vol) sheep blood and antibiotics supplement (GIBCO BRL, Rockville, Md.) at 370C in a microaerophilic chamber (Don Whitley, West Yorkshire, England ) containing 5% O2, 85% N2, and 10%
CO2 for 48 hours. Bacterial cells were collected and washed with PBS buffer
(pH 7.4) and pelleted. Cell pellets were then resuspended in PBS buffer (pH7.4) and used for infection experiment immediately. Bacterial numbers were measured by spectrophotometry at 600 nm.
Cell culture
The gastric cancer cell line 1739-CRL (AGS cell) was used to perform in vitro co-culture experiment with H. pylori. The AGS cells were maintained in RPMI 1640 (Sigma Co.) supplemented with 10% fetal bovine serum (FBS) (GIBCO BRL, Rockville, MD., USA), 100U/ml of penicillin, and 100µg/ml of streptomycin. Co-culture with bacteria was prepared by seeding 1x10⁶ AGS
cells in 10cm plates in RPMI 1640 without antibiotics. The cell lines were treated with three different clinically isolated H. pylori strains for 6 hours with MOI of 300 or a similar volume of PBS as control. After washing the cell lines with PBS and removing the bacteria, total RNA were extracted from AGS cells by TRIzol reagent (Gibco BRL) and quantified by OD 260nm and qualified by Bioanalyzer (Agilent Technology, USA).
Probe Labeling and microarray hybridization and scanning
Total 15µg of purified RNA are converted to cDNA using a 3DNATM Array 50 Expression Array Detection Kit (Genisphere, U. S. A.). Correspondingly synthesized cDNA products are combined and concentrated by ethanol precipitation and suspended in hybridization buffer. Hybridization of labeled cDNA is hybridized to Human 1 cDNA microarray (Agilent Technologies, USA) at 650C for 17 hours. After hybridization, slides were washed by 0.5X SSC/0.01% SDS at room temperature for 5 minutes, and 0.06X SSC at room temperature for 2 minutes. Washed microarrays are then hybridized with Cy3 and Cy5 dendrimers in formamide-based buffer at 530C for 3 hours. After hybridization with dendrimers, slides were washed by 2X SSC/0.01% SDS at 420C for 15 minutes, 2X SSC at room temperature for 10 minutes, and 0.2X SSC at room temperature for 10 minutes. After washing and drying by centrifugation, microarrays are scanned with a Virtek fluorescence reader (Virtek, CA) at 535 nm for Cy3 and 625 nm for Cy5. Scanned images are analyzed by Array-Pro image acquisition software (Media Cybernetics, USA). An image analysis algorithm is used to quantify signal and background intensity for each target element. The targets which signal to background intensity ratio more than 2.5 were selected for further analysis. Data normalization is performed by Lowess method using R package (written by Terry Speeds Microarray Data Analysis Group, University of Berkerley, USA). The microarray data were analyzed by Spotfire software (Someville, MA., USA).
Preparation of Cell Extracts and Western Blot Analysis
Rabbit polyclonal antibodies specific for CCAAT enhancer-binding protein (C/EBP β) and goat polyclonal antibody specific for actin were purchased from
Santa Cruz Biotechnology (Santa Cruz, CA., USA). After incubation with various Helicobacter pylori strains for 3, 6, 12, 18, and 24 hours, AGS cells were rapidly washed with PBS to remove bacteria, and then lysed with ice-cold lysis buffer (50 mM Tris-HCl, pH 7.4, 1 mM EGTA, 1 mM NaF, 150 mM NaCl, 1 mM PMSF, 5 µg/ml of leupeptin, 20 µg/ml of aprotinin, 1 mM Na3VO4, 10mM
β-glycerophosphate, 5mM Na-pyrophosphate, 1% Triton X-100). The cell lysate (100 µg total protein) was subjected to SDS-PAGE using 10 % running gels. The proteins were transferred to nitrocellulose paper. The membranes were blocked for 1 h at 25oC with 0.1% milk in Tris-buffered saline/Tween 20 (TTBS) ) and then incubated for 1 h at 25oC with rabbit antibodies specific for C/EBPβ or goat antibodies specific for actin. Then, the membrane was incubated for 30 min at 25oC with horseradish peroxidase-labeled secondary antibody against rabbit or goat. After each incubation, the membrane was washed extensively with TTBS. The immunoreactive band was detected using ECL detection reagents
(Amersham) and visualized using Hyperfilm-ECL. Quantitative data were obtained using a computing densitometer and ImageQuant software (Molecular Dynamics, Sunnyvale, CA., USA).
Genotyping and sequencing of vacA
DNAs from three clinically isolated H. pylori were extracted for vacA analysis as previously described[15, 16].
Statistical Analysis
The average of the two replicate experiments was determined and used for fold change determination by comparing the gene expression fold change relative to the non-infected control. Pearson correlation method was used to analyze the similarity of gene expression between each two groups.
Discriminate genes and differences between the three groups were analyzed using two-tailed ANOVA test. After ANOVA test, those genes shown to undergo more than twofold up- or down-regulation induced by H. pylori were selected for further analysis. P<0.05 was considered statistically significant.
Results
Comparative analysis of gene expression of AGS cells induced by different clinical isolated H. pylori infection
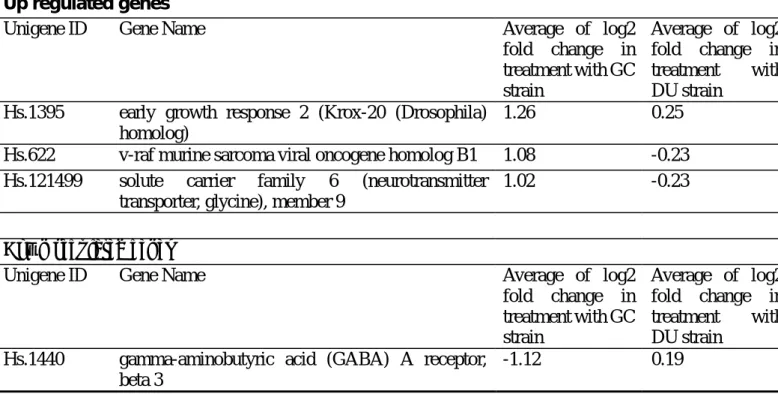
The intensity of 99% targets of the 12,814 clones on the six Human 1 cDNA microarray were more than or equal to 2.5 times of background. We found the gene expression profile was more similar between the GC strain and DU strain (r=0.552) than that between GC strain and MA strain (r=0.393), and that between DU strain and MA strain (r=0.355). ANOVA analysis showed that there were 522 genes expressed differently in the three groups. There were 4 genes up- or down-regulated expression in AGS cells induced specifically by GC strain (Table 1), 4 genes up- or down-regulated expression in AGS cells induced specifically by DU strain (Table 2), and 13 genes up- or down-regulated expression in AGS cells induced specifically by MA strain (Table 3). Those genes shown to undergo more than twofold up- or down-regulation induced by H. pylori were further analyzed. We found that there were 32 genes, including pim-1 oncogene, vascular endothelial growth factor (VEGF), jun B, CCAAT/enhancer binding protein β (C/EBPβ), and cyclin G2, etc. up- or down-regulated expression in AGS cells induced both by GC and DU strains but not by MA strain (Table 4).
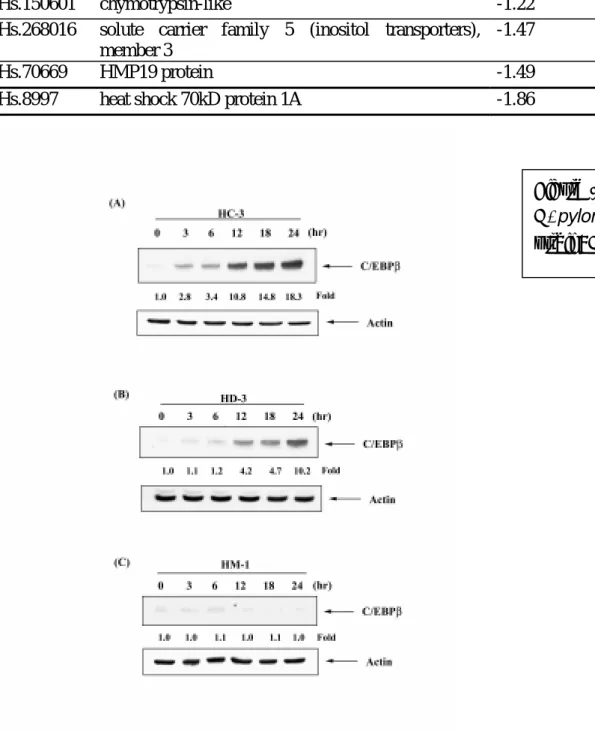
Validation of microarray data by Western blot analysis
For verifying the results of microarray, the protein expression of C/EBPβ in AGS cells induced by three H. pylori strains at 3, 6, 12, 18, and 24 hours were quantified by Western blot analysis. We found that the GC and DU strain induced C/EBPβ expression in AGS cells at 6, 12, 18 and 24hours (Figure 1). The MA strain did not induced C/EBPβ expression in AGS cells at different time
point in our experiments. The result was consistent with our microarray data.
Genotypes of Helicobacter pylori
All of the three strains of Helicobacter pylori express cagA. The genotype of vacA of the three strains is s1m2.
Discussion
Although H. pylori is associated with chronic gastritis, duodenal ulcer, gastric cancer, and gastric MALT lymphoma, only a small portion of infected population developed theses diseases while the majority of infected people remained asymptomatic. Therefore is crucial to investigate the distinct response of gastric epithelial cells to different H. pylori strains. Examination of the effects of H. pylori on gene expression in the gastric epithelial cells or mucosa has been reported in literature [17-19]. However, only a single strain or isogenic mutant strains of H. pylori were used in the previous studies. With the involvement of the bacterial factors, host susceptibility, and interaction of bacteria, environment and host immune response in vitro experiments using gastric cancer cell lines in co-cultured with a single strain of H. pylori can not fully elucidate the pathogenesis of H. pylori-related gastric diseases. Microarray has been used to identify differences in gene content between H.
pylori strains that induce distinct pathological outcomes in an animal model [20].
In the present study, we report the different clinically isolated H. pylori strains would induce distinct gene expression patterns in gastric epithelial cells. Understanding the interaction between H. pylori and gastric epithelial cells is an essential prerequisite in elucidating the underlying mechanisms of different H.
pylori-related diseases. The conventional method is to analyze the defined
signal pathway in co-culture model. This approach provides a reliable but limited clue. Applying the technology of microarray to study host-microbe interaction can generate a holistic view of signal alterations in a single experiment. This is the first study to show that the mRNA expression of gastric epithelial cells after infection by different strains of H. pylori is not general but
rather strain-specific. Of the three clinical isolates, the DU strain from the patient with duodenal ulcer and the GC strain from the patient of gastric cancer induced more oncogenes, protooncognes, or genes involved in carcinogenesis, such as fos, jun B, pim-1 and VEGF, etc. The expressions of these genes in AGS cells induced by H. pylori were similar to the result of previous study [17].However, the MA strain from the patient of gastric MALT lymphoma did not induce those genes. The result implied that the strain-specific factors play an important role in gastric carcinogenesis and the role of H. pylori strain in the pathogenesis of gastric MALT lymphoma is quite different to that of duodenal ulcer and gastric cancer. In addition to the difference of H. pylori strains, the genes up- or down-regulated in AGS cells induced by H. pylori are related to the MOI of bacteria, duration of coculture, and the type of microarray we used. This is why there are some differences in the genes induced by H. pylori between our report and previous studies[17-19].
C/EBPβ is one of the family of transcription factor, CAAT box enhancer binding proteins (C/EBPs). C/EBPβ is strongly upregulated at the transcription level by inflammatory stimuli, participates in both inflammatory and metabolic regulations, and controls cell cycle progression[21]. The increase in C/EBPβ results in accelerated entrance of liver cells to S phase for replication [22]. Our experiment showed that the GC and DU strains induced higher C/EBPβ transcription and translation in AGS cells than MA strains did. The result implied that the H. pylori may induce the signal pathway related to C/EBPβ in gastric carcinogenesis. Previous study had shown that the COX-2 expression was regulated by the expression of the C/EBPβ [23]. The production of COX-2 has been linked to different gastroduodenal diseases including ulcer and cancer. In
addition, increased activation of C/EBPβ has been reported to promote tumor invasiveness and render a malignant phenotype of renal cell carcinoma [24] and C/EBPβ may be a target for tumor inhibition[25]. The role of C/EBPβ in the pathogenesis of H. pylori-related diseases has not been studied yet. Collectively, these results suggest C/EBPβ may play a distinct role in the pathogenesis of H. pylori-related gastric carcinogenesis and ulcer formation and indicate microarray is a rapid and reliable way to identify targets involved in pathogenesis of H. pylori-related diseases. Further study for the role of C/EBPβ in gastric carcinogenesis is needed.
It is of fundamental importance to understand the main molecular pathways affected by H. pylori in epithelial cells in order to identify the critical steps of gastric carcinogenesis. In this study, we have identified distinct genes involved in different clinicaly isolated H. pylori infection. The results provide evidence of bacterial factors and molecular cross-talk between bacteria and the epithelial cells may determine the outcomes of H. pylori infection. Further studies in this line including the identification of the bacterial virulent factors, and elucidation of the different pathways involved, are critical in understanding gastric carcinogenesis and provide novel clues for diagnosis, treatment, and prevention of gastric cancer.
Acknowledgement
The study was supported in part by the grant from National Science Council (NSC91-3112-B002-007).
References
1. Uemura, N., S. Okamoto, S. Yamamoto, N. Matsumura, S. Yamaguchi, M. Yamakido, K. Taniyama, N. Sasaki, and R.J. Schlemper, Helicobacter pylori infection and the development of gastric cancer. N Engl J Med 345: 784-789; 2001.
2. Miwa, H., M.F. Go, and N. Sato, H. pylori and gastric cancer: the Asian enigma. Am J Gastroenterol 97: 1106-1112; 2002.
3. Peek, R.M., Jr. and M.J. Blaser, Helicobacter pylori and gastrointestinal tract adenocarcinomas. Nat Rev Cancer 2: 28-37; 2002.
4. Go, M.F., V. Kapur, D.Y. Graham, and J.M. Musser, Population genetic analysis of Helicobacter pylori by multilocus enzyme electrophoresis: extensive allelic diversity and recombinational population structure. J Bacteriol 178: 3934-3938; 1996.
5. Blaser, M.J. and D.E. Berg, Helicobacter pylori genetic diversity and risk of human disease. J Clin Invest 107: 767-773; 2001.
6. Moss, S.F., J. Calam, B. Agarwal, S. Wang, and P.R. Holt, Induction of gastric epithelial apoptosis by Helicobacter pylori. Gut 38: 498-501; 1996.
7. Jones, N.L., P.T. Shannon, E. Cutz, H. Yeger, and P.M. Sherman, Increase in proliferation and apoptosis of gastric epithelial cells early in the natural history of Helicobacter pylori infection. Am J Pathol 151: 1695-1703; 1997.
8. Kohda, K., K. Tanaka, Y. Aiba, M. Yasuda, T. Miwa, and Y. Koga, Role of apoptosis induced by Helicobacter pylori infection in the development of
duodenal ulcer. Gut 44: 456-462; 1999.
9. Peek, R.M., Jr., S.F. Moss, K.T. Tham, G.I. Perez-Perez, S. Wang, G.G. Miller, J.C. Atherton, P.R. Holt, and M.J. Blaser, Helicobacter pylori cagA+ strains and dissociation of gastric epithelial cell proliferation from apoptosis. J Natl Cancer Inst 89: 863-868; 1997.
10. Rokkas, T., S. Ladas, C. Liatsos, E. Petridou, G. Papatheodorou, S. Theocharis, A. Karameris, and S. Raptis, Relationship of Helicobacter pylori CagA status to gastric cell proliferation and apoptosis. Dig Dis Sci 44: 487-493; 1999.
11. Blaser, M.J., G.I. Perez-Perez, H. Kleanthous, T.L. Cover, R.M. Peek, P.H. Chyou, G.N. Stemmermann, and A. Nomura, Infection with Helicobacter pylori strains possessing cagA is associated with an increased risk of developing adenocarcinoma of the stomach. Cancer Res 55: 2111-2115; 1995.
12. Censini, S., C. Lange, Z. Xiang, J.E. Crabtree, P. Ghiara, M. Borodovsky, R. Rappuoli, and A. Covacci, cag, a pathogenicity island of Helicobacter pylori, encodes type I-specific and disease-associated virulence factors. Proc Natl Acad Sci U S A 93: 14648-14653; 1996.
13. Ito, Y., T. Azuma, S. Ito, H. Suto, H. Miyaji, Y. Yamazaki, T. Kato, Y. Kohli, Y. Keida, and M. Kuriyama, Sequence analysis and clinical significance of the iceA gene from Helicobacter pylori strains in Japan. J Clin Microbiol 38: 483-488; 2000.
14. Maeda, S., F. Kanai, K. Ogura, H. Yoshida, T. Ikenoue, M. Takahashi, T. Kawabe, Y. Shiratori, and M. Omata, High seropositivity of anti-CagA antibody in Helicobacter pylori-infected patients irrelevant to peptic
ulcers and normal mucosa in Japan. Dig Dis Sci 42: 1841-1847; 1997. 15. Yang, J.C., C.H. Kuo, H.J. Wang, T.C. Wang, C.S. Chang, and W.C.
Wang, Vacuolating toxin gene polymorphism among Helicobacter pylori clinical isolates and its association with m1, m2, or chimeric vacA middle types. Scand J Gastroenterol 33: 1152-1157; 1998.
16. Wang, H.J., C.H. Kuo, A.A. Yeh, P.C. Chang, and W.C. Wang, Vacuolating toxin production in clinical isolates of Helicobacter pylori with different vacA genotypes. J Infect Dis 178: 207-212; 1998.
17. Sepulveda, A.R., H. Tao, E. Carloni, J. Sepulveda, D.Y. Graham, and L.E. Peterson, Screening of gene expression profiles in gastric epithelial cells induced by Helicobacter pylori using microarray analysis. Aliment Pharmacol Ther 16 Suppl 2: 145-157; 2002.
18. Chiou, C.C., C.C. Chan, D.L. Sheu, K.T. Chen, Y.S. Li, and E.C. Chan, Helicobacter pylori infection induced alteration of gene expression in human gastric cells. Gut 48: 598-604; 2001.
19. Maeda, S., M. Otsuka, Y. Hirata, Y. Mitsuno, H. Yoshida, Y. Shiratori, Y. Masuho, M. Muramatsu, N. Seki, and M. Omata, cDNA microarray analysis of Helicobacter pylori-mediated alteration of gene expression in gastric cancer cells. Biochem Biophys Res Commun 284: 443-449; 2001.
20. Israel, D.A., N. Salama, C.N. Arnold, S.F. Moss, T. Ando, H.P. Wirth, K.T. Tham, M. Camorlinga, M.J. Blaser, S. Falkow, and R.M. Peek, Jr., Helicobacter pylori strain-specific differences in genetic content, identified by microarray, influence host inflammatory responses. J Clin Invest 107: 611-620; 2001.
21. Poli, V., The role of C/EBP isoforms in the control of inflammatory and native immunity functions. J Biol Chem 273: 29279-29282; 1998.
22. Greenbaum, L.E., D.E. Cressman, B.A. Haber, and R. Taub, Coexistence of C/EBP alpha, beta, growth-induced proteins and DNA synthesis in hepatocytes during liver regeneration. Implications for maintenance of the differentiated state during liver growth. J Clin Invest 96: 1351-1365; 1995.
23. Caivano, M., B. Gorgoni, P. Cohen, and V. Poli, The induction of cyclooxygenase-2 mRNA in macrophages is biphasic and requires both CCAAT enhancer-binding protein beta (C/EBP beta ) and C/EBP delta transcription factors. J Biol Chem 276: 48693-48701; 2001.
24. Oya, M., A. Horiguchi, R. Mizuno, K. Marumo, and M. Murai, Increased activation of CCAAT/enhancer binding protein-beta correlates with the invasiveness of renal cell carcinoma. Clin Cancer Res 9: 1021-1027; 2003.
25. Zhu, S., K. Yoon, E. Sterneck, P.F. Johnson, and R.C. Smart, CCAAT/enhancer binding protein-beta is a mediator of keratinocyte survival and skin tumorigenesis involving oncogenic Ras signaling. Proc Natl Acad Sci U S A 99: 207-212; 2002.
Table 1. Selected genes up- or down-regulated by GC strain in AGS cells
Up regulated genes
Unigene ID Gene Name Average of log2
fold change in treatment with GC strain Average of log2 fold change in treatment with DU strain
Hs.1395 early growth response 2 (Krox-20 (Drosophila) homolog)
1.26 0.25
Hs.622 v-raf murine sarcoma viral oncogene homolog B1 1.08 -0.23 Hs.121499 solute carrier family 6 (neurotransmitter
transporter, glycine), member 9
1.02 -0.23
Down regulated genes
Unigene ID Gene Name Average of log2
fold change in treatment with GC strain Average of log2 fold change in treatment with DU strain
Hs.1440 gamma-aminobutyric acid (GABA) A receptor, beta 3
-1.12 0.19
Up regulated genes
Unigene ID Gene Name Average of log2
fold change in treatment with DU strain Average of log2 fold change in treatment with GC strain Hs.75812 phosphoenolpyruvate carboxykinase 2 (mitochondrial) 1.46 0.72
Hs.13131 lymphocyte adaptor protein 1.30 0.58
Hs.102865 interleukin 1 receptor-like 2 1.33 0.40
Down regulated genes
Unigene ID Gene Name Average of log2
fold change in treatment with DU strain Average of log2 fold change in treatment with GC strain Hs.18141 ladinin 1 -1.01 -0.23
Up regulated genes
Unigene ID Gene Name Average of log2
fold change in treatment with MA strain Average of log2 fold change in treatment with GC strain
Hs.99236 regulator of Gz-selective protein signaling 1.47 -0.31
Hs.430 plastin 1 (I isoform) 1.12 0.13
Hs.147996 protein kinase, X-linked 1.12 -0.19
Hs.66141 prostate derived STE20-like kinase PSK 1.11 0.29 Hs.174044 dishevelled 3 (homologous to Drosophila dsh) 1.07 0.18 Hs.275924 dystrophia myotonica-containing WD repeat motif 1.02 0.19
Down regulated genes
Unigene ID Gene Name Average of log2
fold change in treatment with MA strain Average of log2 fold change in treatment with GC strain
- Human DiGeorge syndrome critical region, centromeric end.
-1.03 0.10
- unnamed protein product -1.06 -0.57
Hs.165986 testin -1.09 0.71
Hs.74552 caspase 3, apoptosis-related cysteine protease -1.13 -0.14
Hs.124186 ring finger protein 2 -1.17 -0.27
Hs.181125 immunoglobulin lambda locus -1.17 0.04
Hs.84673 troponin I, skeletal, slow -1.37 0.11
Up regulated genes
Unigene ID Gene Name Average of log2
fold change in treatment with GC strain Average of log2 fold change in treatment with DU strain
Hs.127799 baculoviral IAP repeat-containing 3 2.39 2.00 Hs.171695 dual specificity phosphatase 1 2.30 2.76 Hs.25647 v-fos FBJ murine osteosarcoma viral oncogene
homolog
2.24 2.06
Hs.460 activating transcription factor 3 2.11 2.53 Hs.211600 tumor necrosis factor, alpha-induced protein 3 2.11 2.33 Hs.96 phorbol-12-myristate-13-acetate-induced protein 1 2.06 1.99
Hs.75692 asparagine synthetase 1.89 2.63
Hs.73793 vascular endothelial growth factor 1.89 2.17 Hs.77054 B-cell translocation gene 1, anti-proliferative 1.83 1.93 Hs.285313 core promoter element binding protein 1.76 1.38 Hs.82173 TGFB inducible early growth response 1.70 1.90
Hs.198951 jun B proto-oncogene 1.67 2.32
Hs.79069 cyclin G2 1.67 2.02
Hs.298275 amino acid transporter 2 1.67 2.06
Hs.10706 epithelial protein lost in neoplasm beta 1.62 2.06
Hs.81170 pim-1 oncogene 1.57 1.83
Hs.99029 CCAAT/enhancer binding protein (C/EBP), beta 1.55 1.77 Hs.78465 v-jun avian sarcoma virus 17 oncogene homolog 1.50 2.09
Hs.12289 Cdc42 effector protein 2 1.48 2.02
- Human leptin receptor (LEPR) gene, exon 3. 1.30 1.76 Hs.75716 serine (or cysteine) proteinase inhibitor, clade B
(ovalbumin), member 2
1.25 1.84
- Human low density lipoprotein receptor gene, exon 18.
1.24 1.60
Hs.54468 tubby (mouse) homolog 1.20 1.00
Hs.283565 FOS-like antigen-1 1.14 1.80
Hs.154276 BTB and CNC homology 1, basic leucine zipper transcription factor 1
1.12 1.11
Hs.3337 transmembrane 4 superfamily member 1 1.12 1.41 - Human low density lipoprotein receptor gene, exon
18.
1.08 1.38
Hs.19904 cystathionase (cystathionine gamma-lyase) 1.08 1.76
Down regulated genes
Unigene ID Gene Name Average of log2
fold change in treatment with
Average of log2 fold change in treatment with
Hs.268016 solute carrier family 5 (inositol transporters), member 3
-1.47 -1.59
Hs.70669 HMP19 protein -1.49 -1.90
Hs.8997 heat shock 70kD protein 1A -1.86 -1.79
Figure 1 Western blot analysis H. pylori in AGS cells. HC-3: GC strain: HM-1: MA strain.