探討台灣交通事故死亡之原因
68
0
0
全文
(2) DETERMINANTS OF TRAFFIC FATALITIES IN TAIWAN Advisor: Dr. Chien-Hsing Wu Department of Information Management National University of Kaohsiung Student: Glen Vorel International Master of Business Administration National University of Kaohsiung. March 2014. ABSTRACT This work examines determinants of traffic fatalities in Taiwan by using multiple regression time series analysis for the period 1991-2012. Emphasis has been laid on investigating the efficacy of mandatory helmet law as well as alcohol law. Among other socioeconomic variables scrutinized in this thesis are national income, unemployment, fuel price, alcohol price, number of vehicles, and the effect of secular trend. The results indicate that the helmet law has a significant reducing impact on traffic fatalities, however, the alcohol law was not found to be effective in reducing road causalities. The impact of national income and number of vehicles on fatalities is positive whereas unemployment and secular trend have a negative effect. Fuel price and alcohol price do not have a significant impact on motor vehicle fatalities in Taiwan. Implications and suggestions are also addressed.. Keywords: traffic fatalities, Taiwan, multiple regression analysis, legal variables, socioeconomic variables, helmets.
(3) TABLE OF CONTENTS List of tables ............................................................................................................................... 2 List of figures ............................................................................................................................. 3 List of appendices ...................................................................................................................... 4 1 Introduction ........................................................................................................................ 1 1.1 Background ................................................................................................................. 1 1.2 Motivation ................................................................................................................... 1 1.3 Objective ..................................................................................................................... 2 1.4 Research process ......................................................................................................... 2 1.5 Thesis outline .............................................................................................................. 2 2 Literature review ................................................................................................................ 4 2.1 Estimating economic costs of road accidents in Taiwan ............................................. 4 2.2 Traffic situation in Taiwan .......................................................................................... 7 2.2.1 Road infrastructure............................................................................................... 7 2.2.2 Vehicle ownership ................................................................................................ 8 2.2.3 Vehicle composition ............................................................................................. 8 2.2.4 Accidents.............................................................................................................. 9 2.2.5 Injuries ............................................................................................................... 13 2.2.6 Fatalities ............................................................................................................. 14 2.3 International comparison ........................................................................................... 19 2.3.1 Vehicle ownership .............................................................................................. 19 2.3.2 Vehicle composition ........................................................................................... 19 2.3.3 Fatalities ............................................................................................................. 20 2.4 Examining determinants of traffic fatalities .............................................................. 23 3 Methodology .................................................................................................................... 27 3.1 Model specifications ................................................................................................. 27 3.2 Model variables ......................................................................................................... 28 4 Data analysis and results .................................................................................................. 33 5 Conclusion and discussion ............................................................................................... 40 5.1 Conclusion................................................................................................................. 40 5.2 Discussion ................................................................................................................. 40 5.3 Limitations and future research ................................................................................. 43 References ................................................................................................................................ 44 Appendix .................................................................................................................................. 52. I.
(4) LIST OF TABLES Table 1 Estimated cost of accidents as percentage of GNI in various countries ....................... 5 Table 2 Motorcycle accidents by collision type ....................................................................... 13 Table 3 Variable definitions ..................................................................................................... 28 Table 4 Summary statistics for used variables ......................................................................... 32 Table 5 Regression results of determinants of traffic fatalities in Taiwan ............................... 33 Table 6 Comparison of matching variables with previous studies .......................................... 39. II.
(5) LIST OF FIGURES Figure 1 Road length between 1966 and 2012........................................................................... 7 Figure 2 Number of registered motor vehicles between 1956 and 2012 ................................... 8 Figure 3 A1 and A2 accidents between 1966 and 2012 ........................................................... 10 Figure 4 Six main A1 accident causes ..................................................................................... 11 Figure 5 Accident composition by mode of transport between 2000 and 2012....................... 12 Figure 6 A1 and A2 injuries between 1988 and 2012 .............................................................. 14 Figure 7 Fatalities between 1966 and 2012 ............................................................................. 15 Figure 8 Fatality composition by mode of transport between 1991 and 2012......................... 16 Figure 9 Comparison of fatality rates by region in 2012 ......................................................... 18 Figure 10 International comparison of vehicle compositions .................................................. 20 Figure 11 International comparison of fatalities between 1999 and 2011 ............................... 22 Figure 12 International comparison of fatalities by mode of transport ................................... 23 Figure 13 Comparison of recorded and estimated fatalities .................................................... 38. III.
(6) LIST OF APPENDICES Appendix 1 Road length between 1966 and 2012 (in kilometers)........................................... 52 Appendix 2 Number of registered motor vehicles between 1956 and 2012 ............................ 53 Appendix 3 Fatalities, accidents and injuries .......................................................................... 54 Appendix 4 Six main A1 accident causes ................................................................................ 55 Appendix 5 Accidents by mode of transport between 2000 and 2012 .................................... 55 Appendix 6 Fatalities by mode of transport between 1991 and 2012...................................... 56 Appendix 7 Fatality rate by age of motorcycle rider between 1999 and 2009 ........................ 57 Appendix 8 Fatality rate by age of automobile driver between 1999 and 2009 ...................... 57 Appendix 9 Fatality rate by age of bicycle rider between 1999 and 2009 .............................. 58 Appendix 10 Fatality rate by age of pedestrian between 1999 and 2009 ................................ 58 Appendix 11 Comparison of fatalities by region in 2012 ........................................................ 59 Appendix 12 Vehicle compositions in different countries ....................................................... 60 Appendix 13 International comparison of fatalities between 1999 and 2011 .......................... 60 Appendix 14 International comparison of fatalities by mode of transport .............................. 61 Appendix 15 Overview of independent variables (aggregated annually) ................................ 62. IV.
(7) 1 INTRODUCTION 1.1 Background Taiwan’s population density is about 646 1 persons per km2 (Department of Household Registration Affairs, MOI, 2013) making it one of the most densely populated countries in the world. Taiwan has been experiencing fast economic growth since the early 1970s which was accompanied by increase in traffic volume. Road infrastructure was extended and improved to handle rising numbers of vehicles from 15,040 km in 1966 to 28,473 km in 1991 to 40,901 km in 2011. As the income per capita rose, increasing percentage of population could afford to own and operate a private vehicle. Taiwan has become a heavily motorized country with about 958 registered vehicles per 1,000 persons. Two-wheelers are very common means of transport especially due to their low purchase and maintenance cost, good maneuverability, short learning curve, etc. (Hsu, Nguyen, & Ahmad Fahran, 2003a) Motorcycles now comprise more than twothirds of all vehicles (Directorate General of Highways, MOTC, 2013) which presents variety of challenges in traffic safety management (Yeh, 2012).. 1.2 Motivation With rising amount of vehicles on the roads, the numbers of accidents, injuries and fatalities have increased. All traffic accidents have a price resulting from material damage and loss of output due to injuries and deaths; the sum of these costs often equals to approximately two to three percent of country’s gross domestic product (Elvik, 2000) which naturally has a negative impact on the economy. The most expensive component is loss of potential output, especially as a result of fatalities. By adopting appropriate measures in road design and traffic law, traffic causalities can be reduced quite effortlessly as compared with other causes of causalities, e.g., various forms of cancer, heart diseases, cerebrovascular diseases, diabetes etc. Legislators are therefore inclined to introduce policies aiming for mitigation of the number of accidents and fatalities, both for economic and humane reasons.. 1. Population of Taiwan is 23,361,147 persons, area of Taiwan is 36,192.8144 km2 (Department of Household Registration Affairs, MOI, 2013).. 1.
(8) 1.3 Objective This work examined the effects of policies which have been adopted since 1991 through 2012; namely, the alcohol law (took effect in July 1973 and was further revised in May 1986, January 1997, January 2001, and December 2005) and the helmet law (introduced in January 1997) (Laws and Regulations Database of the Republic of China, MOJ, 2013). The effects of various socioeconomic variables (disposable income, alcohol price, fuel price, unemployment, number of registered vehicles, and secular trend) were also measured.. 1.4 Research process Research was based on Peltzman’s standard model (Peltzman, 1975) regarding traffic fatalities as a cost to be measured against many benefits of economic growth, i.e., fatalities were viewed as a product of several socioeconomic variables affected by laws and policies. An ordinary least square (OLS) regression model in log-log form was used to estimate elasticities of the legal (alcohol law and helmet law) and socioeconomic (disposable income, alcohol price, fuel price, unemployment, number of registered vehicles, and secular trend) variables. Data were obtained from governmental institutions and their respective databases, e.g., the Ministry of the Interior, the Ministry of Health and Welfare, the Ministry of Transportation and Communications, the Ministry of Justice, the Executive Yuan of Republic of China, etc. Data used for international comparisons were obtained from publications issued by several global institutions: the World Health Organization, the World Bank, the Organisation for Economic Co-operation and Development, etc.. 1.5 Thesis outline In the first part of this work, estimation of the financial impact of traffic accidents on Taiwanese economy was based on similar studies from different countries. The costs were usually significant and had a strongly encouraging effect on countries’ officials to adopt policies reducing the numbers of accidents, injuries and fatalities. In the following chapters, the state of road infrastructure as well as traffic situation with emphasis put on vehicle ownership rate, vehicle composition, accident rates, injury rates, and 2.
(9) fatality rates were examined and compared with several countries in Asia and other world’s regions. Subsequently, Peltzman’s model (1975) of traffic fatalities estimation was introduced along with its modifications by Garbacz (1989), McCornac (1993), Zlatoper (1984), and Wong & Wu (1998) and the most applicable model was derived from the abovementioned researches. The model was fitted in three stages. As discussed above, variables were separated into two groups: legal variables and socioeconomic variables. In the first stage, only the legal variables were studied in order to test their impact and significance. The second stage measured elasticities of socioeconomic variables to examine their influence on fatalities while disregarding effects of governmental policies. In the third stage, all variables were analyzed and their mutual effect was scrutinized. All models were tested for presence of first-order autocorrelation by Durbin–Watson statistics and Prais–Winsten transformation was used to adjust coefficients for detected autocorrelation.. 3.
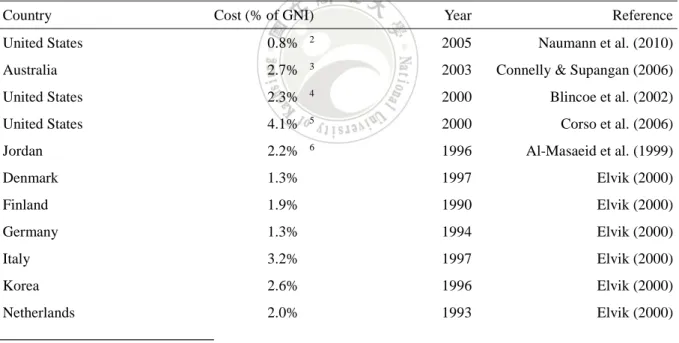
(10) 2 LITERATURE REVIEW 2.1 Estimating economic costs of road accidents in Taiwan Road traffic injuries are the eighth leading cause of death globally, and the leading cause of death for young people aged 15-29. Approximately 1.24 million people were killed on world’s roads in 2010 and the cost of dealing with the consequences of traffic accidents runs up to billions of dollars (World Health Organization, 2013). In recent years, many studies have identified the growing importance of road crashes as cause of death and researchers were trying to calculate costs of these accidents. There is no standard method of accident evaluation which all researchers would agree upon; Hills & Jones-Lee (1983) identified six methods which can be used to calculate cost of road accidents. These methods are: GROSS OUTPUT (OR HUMAN CAPITAL) APPROACH. This method separates an accident cost into two parts: cost due to loss or diversion of current resources (cost of vehicle damage, medical treatment, police and administration cost) and cost due to loss of future output (average future wages discounted to present day value). NET OUTPUT APPROACH. It differs from the above in that the victim’s future consumption is subtracted from the gross output figure. LIFE-INSURANCE APPROACH. This method links directly cost of an accident to price which typical individuals in a given society are willing to pay for their life insurance. COURT AWARD APPROACH. This approach calculates the sums awarded by courts to the surviving dependents of those killed or injured as a result of crime as these indicate the cost that society associates with road accidents. IMPLICIT PUBLIC SECTOR VALUATION APPROACH. This method determines the costs and values that are implicitly placed on accident prevention in safety legislation. WILLINGNESS TO PAY APPROACH. This approach is based on the assumption that decisions made in public sector should reflect the preferences of individual citizens. The value of an improvement in road safety is the amount of money that the society would be willing to 4.
(11) pay for it. Conversely, value of a measure which increases risk is calculated as the sum which the society would be willing to pay for. These six approaches produce different results. Hills & Jones-Lee (1983) emphasize that selection of the most appropriate method depends on the objectives of a specific research. The two most common objectives are economic (reduction of accident costs and maximization of national output) and social (reduction of injuries and fatalities). The only two methods that appear to be relevant to these two objectives are the gross output approach and willingness to pay approach. The monetary value of accidents in any country can be expressed as percentage of gross national income and then compared with other methods, studies or countries. Following table summarizes findings of several scholars who carried out accident evaluations in numerous countries. Table 1 Estimated cost of accidents as percentage of GNI in various countries Country. Cost (% of GNI). Year. Reference. 2005. Naumann et al. (2010). United States. 0.8%. 2. Australia. 2.7%. 3. 2003. Connelly & Supangan (2006). United States. 2.3%. 4. 2000. Blincoe et al. (2002). United States. 4.1%. 5. 2000. Corso et al. (2006). Jordan. 2.2%. 6. 1996. Al-Masaeid et al. (1999). Denmark. 1.3%. 1997. Elvik (2000). Finland. 1.9%. 1990. Elvik (2000). Germany. 1.3%. 1994. Elvik (2000). Italy. 3.2%. 1997. Elvik (2000). Korea. 2.6%. 1996. Elvik (2000). Netherlands. 2.0%. 1993. Elvik (2000). 2. Motor vehicle–related fatal and nonfatal injury costs exceeded $99 billion in 2005; GNI was 13,201,010,773,229 current USD (World Bank, 2013a). 3 Annual cost of road traffic crashes in 2003 was approximately $17 billion AUD; mean AUD-USD conversion rate in 2003 was approximately 0.66 (Trading Economics, 2013); GNI was 421,114,021,215 current USD (World Bank, 2013a). 4 The total economic cost of motor vehicle crashes in 2000 was $230.6 billion; GNI was 9,898,800 million current USD (World Bank, 2013a). 5 In 2000 more than 50 million Americans experienced a medically treated injury resulting in lifetime costs of $406 billion; GNI was 9,898,800 million current USD (World Bank, 2013a). 6 Cost of traffic accidents in Jordan in 1996 was 146.3 million USD; GNI was 6,766,239,409 current USD (World Bank, 2013a).. 5.
(12) New Zealand. 4.4%. 1991. Elvik (2000). Norway. 2.3%. 1995. Elvik (2000). Sweden. 2.7%. 1995. Elvik (2000). United Kingdom. 2.0%. 1990. Elvik (2000). Median. 2.3%. Results differ substantially depending on the method used, sources of data and exact items included in the estimations. Most studies contain variety of components which some of them are difficult to estimate. Emergency care costs, ambulance and transport costs, long-term care costs, repair and material costs, administrative costs, police, firefighters and road assistance costs, legal costs, and sick leave and productivity losses are some of the indicators which can be assigned monetary value relatively easily. Inversely, intangible items like adaptation to disability, travel delay, or pain, grief and suffering are very difficult to measure in any currency (Transport Research Laboratory, 1995). Although the rates varied between 0.8% and 4.4%, the average burden for a country’s economy was about 2.3% of gross national income. There had been no comparable study conducted in Taiwan so far but by applying the average accident costs obtained from other countries the cost of road accidents in Taiwan is estimated to 284 billion TWD7 (9.4 billion USD) annually. Nevertheless, given the high number of fatalities per capita (as discussed in chapter 2.3.3 Fatalities) as compared with countries presented in the table above, the cost might as well be considerably higher. An essential part of accident costs calculation is differentiation of severity of on an accident, i.e., whether an accident was fatal, involved an injury or only material damage had occurred. As demonstrated by Al-Masaeid, Al-Mashakbeh, & Qudah (1999), Trawén, Maraste, & Persson (2002), Blincoe et al. (2002), and García-Altés & Puig-Junoy (2011), fatal accidents are substantially more costly particularly due to the lost output. The economic loss increases with the length of the period which is being averted, in other words, the younger person dies, the greater the financial loss. Young men aged 18-24 are frequent victims in Taiwan, especially in motorcycle and automobile accidents. Hence, the mitigation of fatalities should be an objective. 7. 12,333,970 million TWD [GNI at current prices in 2012 (Directorate General of Budget, Accounting and Statistics, Executive Yuan, 2013)] × 2.3% = 283,681 million TWD. 6.
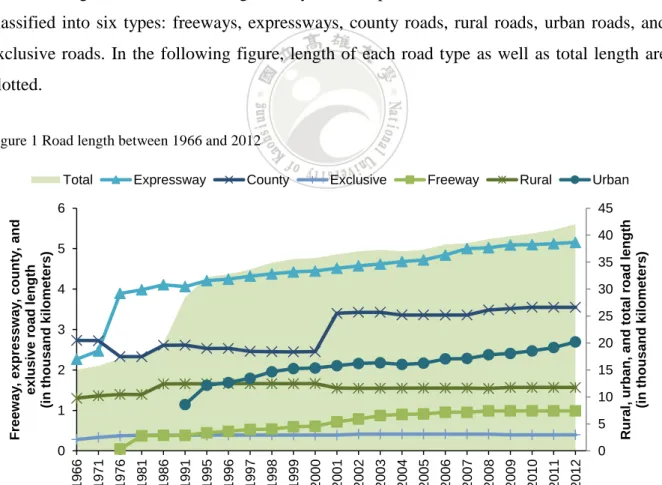
(13) on national resource planning level as it not only leads to significant economy benefits but the humane factor should be also taken into consideration. It is crucial to examine the state of infrastructure, amount and composition of vehicles as well as effective laws and policies in order to select measures which are the most suitable for Taiwan.. 2.2 Traffic situation in Taiwan With economic boost at the beginning of the 1970s, average national income grew quickly and the increment of disposable income per household accelerated the volume of vehicles owned by Taiwanese population.. 2.2.1 Road infrastructure The road length has been increasing steadily over the past four decades 8. Roads in Taiwan are classified into six types: freeways, expressways, county roads, rural roads, urban roads, and exclusive roads. In the following figure, length of each road type as well as total length are plotted. Figure 1 Road length between 1966 and 2012 Total. Expressway. County. Exclusive. Freeway. Rural. Urban 45 40. 5 35 4. 30 25. 3 20 2. 15 10. 1 5. Source: Institute of Transportation, MOTC (2013a). 8. For more details see Appendix 1 Road length between 1966 and 2012 (in kilometers).. 7. 2012. 2011. 2010. 2009. 2008. 2007. 2006. 2005. 2004. 2003. 2002. 2001. 2000. 1999. 1998. 1997. 1996. 1995. 1991. 1986. 1981. 1976. 1971. 0 1966. 0. Rural, urban, and total road length (in thousand kilometers). Freeway, expressway, county, and exlusive road length (in thousand kilometers). 6.
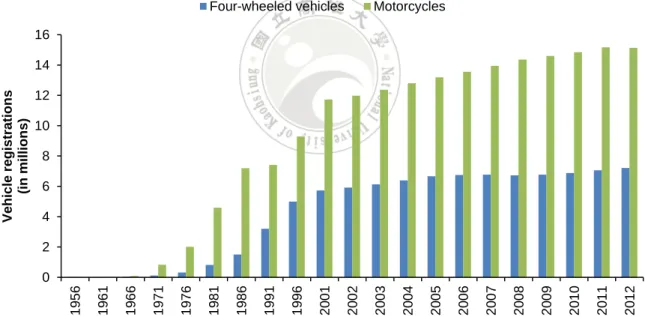
(14) As seen from the chart above, the length of roads has been gradually increasing over time; the fast growth of total road length between 1986 and 1991 resulted from inclusion of urban roads into the total figure. Despite the fact that the road mileage has been growing steadily, the number of fatalities has fluctuated so it does not seem to be directly related to this attribute.. 2.2.2 Vehicle ownership The database registered mere 940,000 vehicles in 1971, however, almost 5.4 million vehicles were registered ten years later. The expansion of vehicles gradually slowed but did not cease completely. There are currently more than 22 million vehicles in Taiwan which means that the vehicle ownership rate is about 958 vehicles per 1,000 persons. The number continues to increase which poses a challenge to legislators who must constantly improve the traffic law to cope with rising number of vehicles on Taiwanese roads. Figure 2 Number of registered motor vehicles between 1956 and 2012 Four-wheeled vehicles. Motorcycles. 16. Vehicle registrations (in millions). 14 12 10 8 6 4 2 2012. 2011. 2010. 2009. 2008. 2007. 2006. 2005. 2004. 2003. 2002. 2001. 1996. 1991. 1986. 1981. 1976. 1971. 1966. 1961. 1956. 0. Source: Directorate General of Highways, MOTC (2013). 2.2.3 Vehicle composition At the end of 2012, there were 22.3 million registered vehicles in Taiwan9 (Directorate General of Highways, MOTC, 2013). Vehicles are classified into following six categories: . 9. 6.1 million automobiles (27% or 261 cars per 1000 persons),. For more details see Appendix 2 Number of registered motor vehicles between 1956 and 2012.. 8.
(15) . 15.1 million motorcycles (68% or 649 motorcycles per 1000 persons),. . 862 thousand light trucks (4% or 37 light trucks per 1000 persons),. . 161 thousand trucks (less than 1% or 7 trucks per 1000 persons),. . 31 thousand buses (less than 1% or 1 bus per 1000 persons), and. . 61 thousand specially constructed vehicles (less than 1% or 3 vehicles per 1000 persons).. The most intriguing figure is certainly the high share of motorcycles 10 . Hsu et al. (2003a) summarized common reasons for purchasing a motorcycle: it is much cheaper than automobile, needs less space for parking, provides door-to-door access, and has a good acceleration and may cruise as fast as a car, especially in urban areas. Hsu, Nguyen, & Ahmad Farhan (2005) examined the vehicle ownership rate in time and by using Gompertz model concluded that the saturation level of motorcycles in Taiwan (i.e., ownership rate at which the growth should cease) was 609 motorcycles per 1,000 persons. There are currently 649 motorcycles per 1,000 persons registered in Taiwan and the growth rate doesn’t seem to be decelerating which suggests that the situation is very difficult to predict and the increase in number of motorcycles is likely to continue in the future as well. It is important to be aware of this trend to be able to plan efficient regulations and engineer traffic network capable of handling such intense motorcycles usage.. 2.2.4 Accidents National Police Agency classifieds traffic accidents into three categories: A1, A2 and A3. The latest definitions describe them as accidents which lead to death of at least one person within 24 hours of the accident, at least one non-lethal injury, and property damage only, respectively. A1 accidents have been recorded since 1985 but data on A2 accidents were not recorded until 1998. A3 accidents had not yet been incorporated into Road Accident Investigation and Reporting System (Yeh, 2012).. In this work, “motorcycle” refers to any motor-powered two-wheeled vehicle and does not distinguish between engine displacements and vehicle design (i.e., included are also scooters and mopeds). 10. 9.
(16) Figure 3 A1 and A2 accidents between 1966 and 2012. 2012. 2010. 2008. 2006. 2004. 2002. 2000. 1998. 1996. 1994. 1992. 0 1990. 0 1988. 50. 1986. 2. 1984. 100. 1982. 4. 1980. 150. 1978. 6. 1976. 200. 1974. 8. 1972. 250. 1970. 10. 1968. 300. A2 accidents (in thousands). A2 accidents. 12. 1966. A1 accidents (in thousands). A1 accidents. Source: National Police Agency, MOI (2013a), Institute of Transportation, MOTC (2013b). There were approximately 6,000 A1 accidents recorded in mid-1960s but with the development of transportation industry this number quickly rose to its peak in the mid-1970s when more than 10,500 accidents occurred. Taiwanese lawmakers made first attempts to resolve the ascending trend by implementing alcohol law in 1975 (Laws and Regulations Database of the Republic of China, MOJ, 2013) and constructing first motorcycle exclusive lanes in order to separate twowheeled and four-wheeled traffic. These countermeasures were successful and fatal accidents decreased to 2,700 in 1993. Since then, they have been oscillating between 2,000 and 3,500 cases annually with a slow decreasing trend. There were less than 2,000 fatal accidents in Taiwan11 recorded in 2012. On the contrary, A2 accidents saw a steep rise between 2000 and 2012; they increased five-fold from 50,000 to almost 250,000 in the observed period. The fast growth is yet to be explained but one possible reason is increase in accuracy of recorded data. Perhaps the rate of underreporting is diminishing (possibly due to anticipation of insurance reimbursement), thus, National Police Agency data is simply aligning with the actual situation and a real change of A2 accidents cannot be derived from the official data. Under-reporting of non-fatal injuries, especially those that are less severe, is common (Odero, Garner, & Zwi, 1997). The exact rate of under-reporting remains unknown; Hsu et al. (2003a) estimated that the actual number of all. 11. For more details see Appendix 3 Fatalities, accidents and injuries.. 10.
(17) accidents was at least 50 times more than the sum of A1 accidents but in 2012 there were approximately 125 times more total accidents than A1 accidents officially reported so the rate of under-reporting is probably much higher. By using the official statistics (i.e., excluding accidents which are not reported or which only lead to property damage) can be concluded that in 2012 there were approximately 10.7 accidents per 1,000 persons12 or one accident every 2 minutes and 6 seconds13 which led to injury of at least one person on average. In order to better understand the changes in traffic safety measures and their implications, it is helpful to examine the leading causes of accidents. In 2012 97.9% of A1 and A2 accidents combined were caused by driver while only 1.3% by passenger or pedestrian, 0.3% by vehicle malfunction, 0.1% by traffic control malfunction, and 0.3% by other factors (National Police Agency, MOI, 2013b). Thus, human failure appears to be the main leading cause of all accidents. This figure can be further developed into six prevailing accident causes including drunk driving, careless driving, failing to yield, disregarding signals, inappropriate turning, and losing control over vehicle due to speeding. Figure 4 Six main A1 accident causes Drunk driving. Failing to yield. Disregarding traffic signals. Losing control due to speeding. Inappropriate turning. Careless driving. 800 700. Cases. 600 500 400 300 200 100 0 2000. 2001. 2002. 2003. 2004. 2005. 2006. 2007. 2008. 2009. 2010. 2011. 2012. Source: Traffic Safety Committee, MOTC (2010) and Traffic Safety Committee, MOTC (2013). 12 13. ( 1,964 [A1 accidents] + 247,501 [A2 accidents] ) / 23,315,822 [population] = 10.679 1 / ( 1,964 [A1 accidents] + 247,501 [A2 accidents] / 365 [days] / 24 [hours] / 60 [minutes] ) = 2.107. 11.
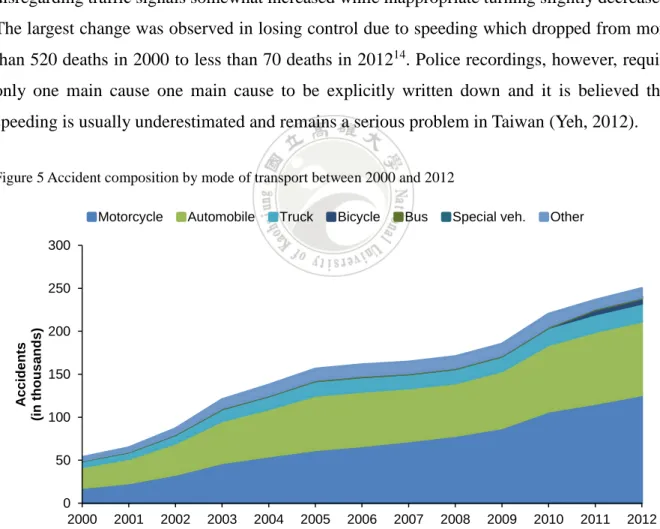
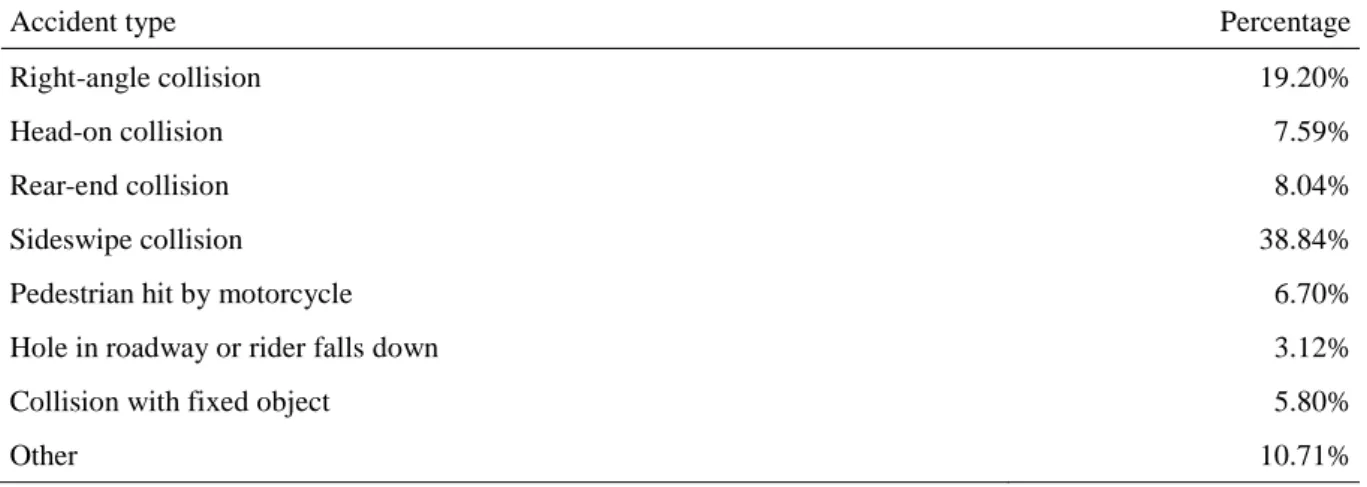
(18) The number of accidents caused by the six main causes combined comprised about 60-70% of the total sum of all accidents. The most common cause was drunk driving which peaked in 2006 when it was accountable for approximately 700 deaths. The growth of number of accidents caused by drunk driving in 2005-2007 collides with the increase of fatalities in the same time period which confirms that driving under the influence is responsible for vast majority of traffic fatalities. In December 2005 (prior to peak of drunk driving accidents in 2006) the Road Traffic Management and Penalty Act was revised. The revision lifted life-time license revocation because it had been declared against the Constitutional Law; the increase in alcohol related accidents might, thus, be result of the change in the Act. Careless driving is the second most frequent cause of fatal accidents but it appears to have a declining trend. Failing to yield and disregarding traffic signals somewhat increased while inappropriate turning slightly decreased. The largest change was observed in losing control due to speeding which dropped from more than 520 deaths in 2000 to less than 70 deaths in 201214. Police recordings, however, require only one main cause one main cause to be explicitly written down and it is believed that speeding is usually underestimated and remains a serious problem in Taiwan (Yeh, 2012). Figure 5 Accident composition by mode of transport between 2000 and 2012 Motorcycle. Automobile. 2001. 2003. Truck. Bicycle. Bus. Special veh.. Other. 300. Accidents (in thousands). 250 200 150 100 50 0 2000. 2002. 2004. 2005. 2006. 2007. 2008. 2009. 2010. 2011. 2012. Source: National Police Agency, MOI (2013b). Closer examination of accidents by mode of transport reveals that motorcycles caused over 50%. 14. For more details see Appendix 4 Six main A1 accident causes.. 12.
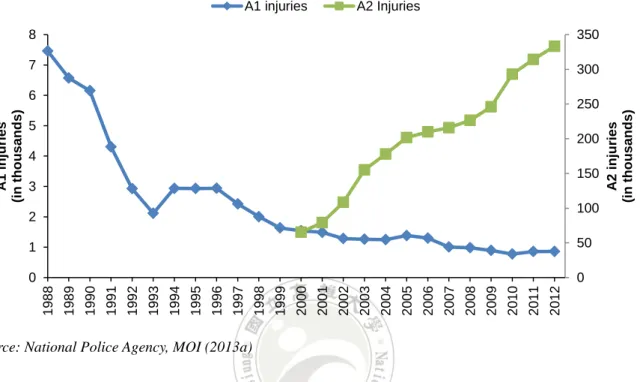
(19) of accidents in 2012 and the proportion has been steadily increasing over the last decade15; motorcycles were only involved in 35% of accidents in 2000. Motorcycle collision types were thoroughly analyzed by Hsu et al. (2003a). Table 2 Motorcycle accidents by collision type Accident type. Percentage. Right-angle collision. 19.20%. Head-on collision. 7.59%. Rear-end collision. 8.04%. Sideswipe collision. 38.84%. Pedestrian hit by motorcycle. 6.70%. Hole in roadway or rider falls down. 3.12%. Collision with fixed object. 5.80%. Other. 10.71%. Source: Hsu et al. (2003a). Table 2 reveals that the sideswipe collision is among the most frequent kinds of collisions suggesting that the frequency of motorcycle accidents on the road section in mid-stream is higher than at intersections.. 2.2.5 Injuries Injuries are divided into A1 and A2 categories occurring in the respective accidents. A1 injuries (i.e., injuries which occurred in accident where at least one person died) were steadily decreasing from almost 7,500 in 1988 to roughly 2,000 in 1993. From 1993 they temporarily grew to approximately 3,000 annual injuries in years 1994 to 1996. This period was followed by a steady decline and in 2012 there were less than 900 A1 injuries recorded. The ratio of A1 injuries and A1 accidents also declined from 1.1 injuries per accident in 1988 to 0.4 injury per accident in 2012. There are two possible explanations of this trend: either the growing number of vehicles per capita means that there are generally fewer passengers sharing one vehicles (thus, fewer persons are injured in case of an accident) or it results mostly from progress in vehicle safety design. A2 injuries follow a similar trend as A2 accidents and grew from 65,000 in 2000 to more than. 15. For more details see Appendix 5 Accidents by mode of transport between 2000 and 2012.. 13.
(20) 330,000 in 201216. The ratio of A2 accidents and A2 injuries is nearly constant and grew only marginally from 1.30 in the early 2000s to 1.35 in the late 2000s. The increase in injuries is, however, very fast and appears to be accelerating. Figure 6 A1 and A2 injuries between 1988 and 2012 A2 Injuries. 8. 350. 7. 300. A1 injuries (in thousands). 6. 250. 5 200 4 150 3. A2 injuries (in thousands). A1 injuries. 100. 2. 2012. 2011. 2010. 2009. 2008. 2007. 2006. 2005. 2004. 2003. 2002. 2001. 2000. 1999. 1998. 1997. 1996. 1995. 1994. 1993. 1992. 1991. 0 1990. 0 1989. 50. 1988. 1. Source: National Police Agency, MOI (2013a). In 2012 there were on average 14.3 reported injuries per 1,000 persons17 or one reported injury every 1 minute and 34 seconds18. It is important to stress that official numbers are most likely underestimated and the actual numbers are substantially higher.. 2.2.6 Fatalities The National Police Agency has been recording accident data since 1985 but only fatalities which occurred during an accident or within 24 hours of an accident have been included (Yeh, 2012). This means that deaths occurring as a result of a traffic accident later than 24 hours are excluded from the police statistics. This practice does not comply with the WHO or the OECD standards which record deaths occurring within 30 days of an accident (International Traffic Safety Data and Analysis Group, OECD, 2013). More accurate estimation of the actual number of fatalities can be compiled from death. 16 17 18. For more details see Appendix 3 Fatalities, accidents and injuries. ( 862 [A1 injuries] + 333,220 [A2 injuries] ) / 23,315,822 [population] = 14.301 1 / ( 862 [A1 injuries] + 333,220 [A2 injuries] / 365 [days] / 24 [hours] / 60 [minutes] ) = 1.573. 14.
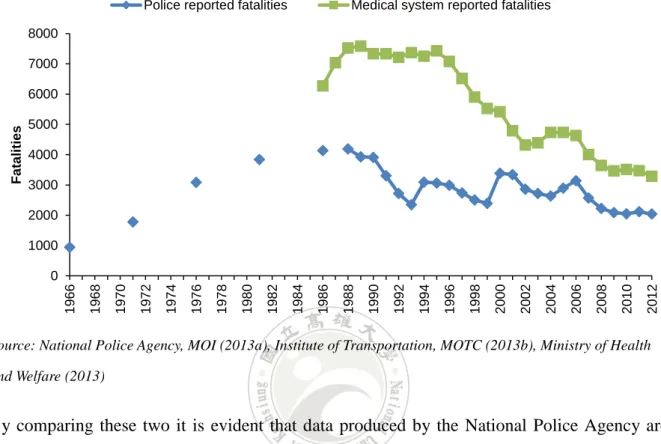
(21) certificates issued by the Ministry of Health and Welfare which records all deaths occurring as a result of a traffic accident. Figure 7 Fatalities between 1966 and 2012 Police reported fatalities. Medical system reported fatalities. 8000 7000. Fatalities. 6000 5000 4000 3000 2000 1000 2012. 2010. 2008. 2006. 2004. 2002. 2000. 1998. 1996. 1994. 1992. 1990. 1988. 1986. 1984. 1982. 1980. 1978. 1976. 1974. 1972. 1970. 1968. 1966. 0. Source: National Police Agency, MOI (2013a), Institute of Transportation, MOTC (2013b), Ministry of Health and Welfare (2013). By comparing these two it is evident that data produced by the National Police Agency are seriously underestimated with the greatest discrepancy occurring in 1993 when there were three times more fatalities recorded by medical system compared with the NPA database. The medical system reported data reveal that the number of fatalities had been increasing until it reached its peak in 1988-89 when more than 7,500 persons died as a result of a motor vehicle accident. Followed by a short stagnation, the number has been decreasing since 1996 onward. Over the last 20 years, even though the population and number of motor vehicles have been increasing, both police reported and medical system reported fatalities have been reduced by half. Although the number has been substantially reduced, motor vehicle transport accidents still prevail as one of the most frequent causes of death19. Although motorcycles have many advantages over automobiles, they also pose higher risk for the rider. A motorcycle is considered to be one of the most hazardous modes of transport. 19. There were 3,291 reported deaths resulting from motor vehicle transport accidents out of 153,823 total deaths in 2012 (Ministry of Health and Welfare, 2013).. 15.
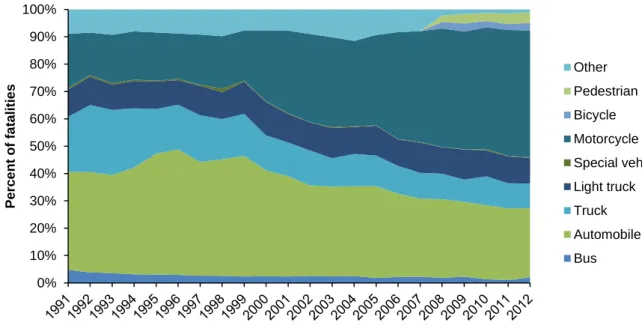
(22) because high degree of exposure makes passengers more vulnerable in case of collision (Hsu, Nguyen, & Ahmad Fahran, 2003a). Given the high share of motorcycles on Taiwanese roads, the death toll in their category dominates the overall number of traffic causalities. In 2012 motorcycle riders represented over 46% of fatalities according to the National Police Agency, MOI (or 63% according to the Institute of Transportation, MOTC). Along with pedestrians and cyclists (who accounted for 4% and 3%, respectively) these “vulnerable road users” (a term by the World Health Organization) were victims in 53% of total road fatalities. Automobiles comprised 25% of fatalities, light trucks about 9% and heavy trucks 9% as well leaving about 3% to bus drivers, specially constructed vehicle drivers and other modes of transport20. Figure 8 Fatality composition by mode of transport between 1991 and 2012 100%. Percent of fatalities. 90% 80%. Other. 70%. Pedestrian. 60%. Bicycle Motorcycle. 50%. Special veh.. 40%. Light truck 30%. Truck. 20%. Automobile. 10%. Bus. 0%. Source: National Police Agency, MOI (2013c). Two most obvious trends apparent in the Figure 8 are the decreasing share of automobiles on the total number of traffic causalities and, adversely, enlarging proportion of motorcycle fatalities. The high proportion of motorcycle causalities is not surprising as motorcycle riders have a 34-fold higher risk of death in a crash than people driving other types of motor vehicles (Lin & Kraus, 2009). Because motorcycle fatalities comprise the highest share of road accident causalities, they should be subject to the most detailed scrutiny. In 2012 903 motorcycle riders wore helmet while 143 did not wear helmet at the time of fatal. 20. For more details see Appendix 6 Fatalities by mode of transport between 1991 and 2012.. 16.
(23) accident. Out of the 903 persons who had their helmet on, 429 died as a result of head injury and 474 as a result of injuries of body parts different from head. Among those who did not wear helmet at the time of accident, head injury was leading cause of death in 80 cases while 63 causalities resulted from other injuries. (National Police Agency, MOI, 2013d) In other words, death caused by a head injury occurred in 48% and 56% of accidents for riders wearing and not wearing a helmet, respectively. It suggests that wearing a helmet can lower the risk of death resulting from head injury which is the most common cause of death. This conclusion is consistent with findings of Lin & Kraus (2009), French, Gumus, & Homer (2009), and French, Humus, & Homer (2012) who have demonstrated that helmet laws are effective in reducing fatal and non-fatal motorcycle injuries. Keng (2005) estimates that helmets reduce probability of death in a crash in Taiwan by 40%. Helmet wearing, however, was not independently related to the risk of crashing (Lin, Chang, Lu, & Keyl, 2003). The fatality rates of various transportation means based on gender and age groups were also studied21. The prevailing male fatality rate per 100,000 persons rate is apparent in most of the examined samples. Male car drivers had a higher fatality rate in comparison with their female counterparts, nevertheless, the rate of male drivers aged between 18-24 and 25-64 (i.e., two groups with the highest rates) had an obvious decreasing trend. The rate of motorcycle fatalities per 100,000 persons was higher than death rate of any other transportation mean. The highest rate appeared in male riders aged over 65, possibly because of their frailty and higher susceptibility to trauma (Yeh, 2012). It was followed by male riders aged 18-24, male riders aged 25-64 and also male riders aged 13-17. Unlicensed motorcycling is a problem which should be addressed and resolved by using proper policies. Similarly to the pattern observed among automobile drivers, motorcycle female death rates for all age groups were lower than any male death rate. Elderly bicycle riders suffered higher fatality rates possibly due to the same reasons as elderly motorcycle riders. Male bicycle riders aged over 65 had the highest death toll per 100,000 persons while female riders aged 65 or more had the second highest toll. The gap between both genders has been, however, shrinking in recent years. The proportion of deceased elderly. 21. For more details see Appendix 7 Fatality rate by age of motorcycle rider between 1999 and 2009 through Appendix 10 Fatality rate by age of pedestrian between 1999 and 2009.. 17.
(24) pedestrians showed substantially higher causality rate compared with younger age groups. Closer examination of fatalities by region in 2012 reveals that the lowest death rate was in Taipei City (2.9 fatalities per 100,000 persons) and was also relatively low in other cities and developed areas: New Taipei City, Keelung City, Taoyuan County, Hsinchu City, Taichung City, Chiayi City, Tainan City, and Kaohsiung City. On the other hand, the fatality rate was rather high in the rural areas and on the east coast, especially in Taitung County (21.7 fatalities per 100,000 persons)22. It should be noted that the fatality rates are based on data by the National Police Agency which are underestimated. The difference in fatality rates in individual counties can be explained by a better law enforcement in urban areas which is making drivers more risk averse and also because the ambulance transport is shorter thanks to higher density of hospitals. To a certain extent it also corresponds to different percentage of helmet usage among counties and cities of Taiwan, as further elaborated in chapter 5.2 Discussion. Figure 9 Comparison of fatality rates by region in 2012 1: New Taipei City. 11: Nantou County. 2: Taipei City. 12: Yunlin County. 3: Taichung City. 13: Chiayi County. 4: Tainan City. 14: Pingtung County. 5: Kaohsiung City. 15: Taitung County. 6: Yilan County. 16: Hualien County. 7: Taoyuan County. 17: Keelung City. 8: Hsinchu County. 18: Hsinchu City. 9: Miaoli County. 19: Chiayi City. 10: Changhua County. Source: National Police Agency, MOI (2013b), Department of Household Registration Affairs, MOI (2013). 22. For more details see Appendix 11 Comparison of fatalities by region in 2012.. 18.
(25) 2.3 International comparison 2.3.1 Vehicle ownership There were about 22.3 million vehicles and 23.3 million persons registered in Taiwan in 2012 which means that the vehicle ownership rate was 958 vehicles per 1,000 persons. Even if the official figure was overestimated due to imperfect removal of scrapped vehicles from the registration system, it would still be higher compared with other both developing and developed countries. The vehicle ownership rate per 1,000 persons including two- and three-wheelers was 834 in the United States, 711 in Malaysia, 710 in Japan, 642 in Norway, 629 in Canada, 567 in United Kingdom, 409 in South Korea and 378 in Vietnam (World Health Organization, 2013). Excluding two- and three-wheelers, 312 registered vehicles per 1,000 persons ranked Taiwan below other developed countries. The vehicle ownership rate excluding motorcycles per 1,000 persons was 797 in the United States, 607 in Canada, 591 in Japan, 583 in Norway, 519 in the United Kingdom, 363 in South Korea, 361 in Malaysia and only 20 in Vietnam (World Bank, 2013b). As seen from these figures, the vehicle ownership rate in Taiwan is very high when including motorcycles. This situation is quite unique and presents a challenge especially for Taiwanese policymakers who have to cope with it by designing and maintaining appropriate set of policies and laws.. 2.3.2 Vehicle composition Vehicle composition is also an important determinant which differentiates countries and regions. Although Taiwan belongs to a high-income group of countries (annual disposable income per capita in 2012 was about 17,700 USD which exceeds 12,276 USD, a criterion used by the World Bank) its vehicle structure shares many similarities with middle-income countries which are defined as nations with income per capita between 1,006 and 12,175 USD.. 19.
(26) Figure 10 International comparison of vehicle compositions 100% 90% 80% Percentage. 70% 60% Other. 50% 40%. Buses. 30%. Heavy trucks. 20%. Motorized 2- and 3-wheelers. 10%. Cars and 4-wheeled light vehicles. 0%. Source: Directorate General of Highways, MOTC (2013), World Health Organization (2013), Japan Automobile Manufacturers Association (2013). The share of motorcycles is much higher in Taiwan than in other developed countries, almost 68% of all registered vehicles are motorcycles and only 27% are automobiles. This proportion is relatively similar in Malaysia where the vehicle fleet consists of 45% cars and 47% two- and three-wheelers. A different situation is in Japan and South Korea where cars comprise 66-69% and two-wheelers 9-14% of all vehicles. Countries with higher national income follow a slightly different pattern; there are about 86-93% cars and 3-10% motorcycles registered in Norway, United Kingdom, Canada and the United States. On the other hand, automobiles in Vietnam make up less than 2% while two- and three-wheelers over 96% of all vehicles registered. It can be concluded that in high income countries the share of automobiles to motorcycles is significantly higher than in middle and low income countries23.. 2.3.3 Fatalities It is reasonable to compare traffic fatality rates of Taiwan with other countries. The number of traffic fatalities can be converted to a relative variable; there are three frequently used indicators which make direct comparisons possible: FATALITIES PER BILLION VEHICLE-KILOMETERS is the most objective indicator to. 23. For more details see Appendix 12 Vehicle compositions in different countries.. 20.
(27) describe risk on the road network, only a limited number of countries, however, collects data on distance travelled. FATALITIES PER 10,000 REGISTERED VEHICLES are limited as they only allow comparison of countries with similar traffic characteristics. This measure also requires reliable statistics on the number of vehicles. In some countries, scrapped vehicles are not systematically removed from the database and, thereby, undermine the accuracy. This indicator also omits nonmotorized vehicles which in some countries represent a large part of the vehicle fleet. FATALITIES PER 100,000 HEAD OF POPULATION is the denominator commonly used, as the figure is available in most countries. It also enables comparison with other causes of injury and death, like heart disease, HIV/AIDS, etc. As the health and transport sectors increase their level of co-operation, fatalities per 100,000 population is becoming widely used as the standard indicator (International Traffic Safety Data and Analysis Group, OECD, 2013). An important step in international comparison is to homogenization of the time period over which fatalities are measured. International standard used by the World Health Organization, the Organisation for Economic Co-operation and Development, and other international organizations includes all causalities occurring within 30 days of an accident. The National Police Agency in Taiwan records fatalities which occur within 24 hours of an accident which is causing significant underestimation whereas the Ministry of Health and Welfare includes all accidents with no time restrains which leads to over-rated statistics unsuitable for international comparison as well. In Taiwan, 30-days fatalities are estimated by the Institute of Transportation, MOTC which is linking police-reported fatalities with death certificate data in medical systems to identify injury victims who died within 30 days. These adjusted figures are suitable for international comparison24.. 24. See more details in Appendix 3 Fatalities, accidents and injuries.. 21.
(28) Figure 11 International comparison of fatalities between 1999 and 2011. Fatalities per 100,000 persons. 30 Malaysia. 25. Taiwan South Korea. 20. United States New Zealand. 15. Canada Japan. 10. Singapore Norway. 5. United Kingdom 0 1999 2000 2001 2002 2003 2004 2005 2006 2007 2008 2009 2010 2011. Source: International Traffic Safety Data and Analysis Group, OECD (2013), World Bank (2013c), Ministry of Transport New Zealand (2010), Royal Malaysian Police (2013), Traffic Police Singapore (2013). Figure 11 indicates that 30-days fatality rate increased from 16.4 in 2003 to 19.3 in 2006 but subsequently reduced to 14.3 in 2011. The rate is lower than the world’s average which is 18 causalities per 100,000 population and also lower than average in South-East Asia and Americas where it reached 18.5 and 16.1, respectively. However, Taiwan is outperformed by European region where the rate is only 10.8. Traffic fatality rate in Taiwan is three times higher than in countries with the best performance like Norway, United Kingdom, Japan or Singapore with less than 5 fatalities per 100,000 population. In spite of reduction in fatalities in recent years, Taiwan still has much to improve, especially in areas regarding motorcycle use, elderly road users, and accidents caused by drunk driving. According to the World Health Organization (2013), half of the world’s road traffic deaths occur among “vulnerable road users”, i.e., motorcyclists (23%), pedestrians (22%), and cyclists (5%), while 31% of deaths happen to car occupants and the remaining 19% to unspecified road users. The total share of vulnerable road users is similar in Taiwan where they make up 53% of all road causalities; the share of individual means of transport is, nevertheless, different from WHO data; motorcyclists, pedestrians and cyclists represent 46%, 4% and 3%, respectively.. 22.
(29) Figure 12 International comparison of fatalities by mode of transport 100% Percentage of fatalities. 90% 80% 70%. Other. 60%. Buses. 50%. Heavy trucks. 40%. Passengers. 30%. Cars and light trucks. 20%. Cyclists. 10%. Pedestrians. 0%. Motorcycle riders. Source: World Health Organization (2013), National Police Agency, MOI (2013c). The proportion of motorcycle causalities in Taiwan is high not only compared with the world’s average but also with most other countries including Vietnam where powered two-wheelers comprise more than 96% of total vehicles. This observation suggests that there is room for improvement and motorcycle fatalities can be further reduced. The percentage of pedestrian fatalities is very low compared with most other countries. Car fatalities comprise 35% of all fatalities in Taiwan, their share is similar to United Kingdom or Japan where they account for 33% and 31% of fatalities, respectively.. 2.4 Examining determinants of traffic fatalities As discussed above, car accidents, and especially the fatal ones, have a negative impact on country’s economy. Many researchers have been trying to develop models which could explain their causes in order to identify and reduce them. Effects of numerous policies were also examined and, in some cases, predictions of future fatalities had been made. One of the earliest models estimating road fatalities known as Smeed’s Law was linking deaths with vehicles and population. Smeed (1949) analyzed sample of 20 countries by using data from 1930-1946 period and found that the relationship between number of fatalities and vehicle ownership rate was stable across the sampled countries. The formula was expressed in the following form: 23.
(30) 2. 𝐷 𝑁 −3 = 0.0003 𝑁 𝑃. (1) where D is number of deaths, N is number of vehicles, and P is country’s population. The relationship was revalidated by Adams (1987) by making adjustments to parameters of the formula to better reflect situation at the end of the 1980s. However, the predicted fatalities continued to rise although the actual number in some countries started to decline from the 1960s. Kopits & Cropper (2005) found evidence that the income level at which fatality rate per population first declined is approximately 8,600 USD (measured in 1985 international prices) and this income level was attained by countries such as New Zealand in 1968, Belgium, the United Kingdom, and Austria in the early 1970s, and South Korea in 1994. For the United Kingdom, the Smeed’s prediction was moving correctly and had approximately the right magnitude until 1966. By 2000, the prediction was about four times too high (Koren & Borsos, 2010). Other researchers attempted do develop more complex models to cope with changing situation by adding more variables in order to reflect subtle nuances affecting road safety. Peltzman (1975) developed a model which tested the effect of National Traffic and Motor Vehicle Safety Act of 1966 on death toll on US roads. The Act which made it compulsory for new vehicles to be equipped with several safety features like seat-belts, energy absorbing steering column, and penetration resistant windshield, did not prove to be effective in reducing number of road causalities. In a time-series analysis (1947-1972) Peltzman divided data into two periods: a pre-regulatory (1947-1965) and a post-regulatory (1966-1972) period. By using log-log multiple regression, he estimated parameters of socioeconomic variables like accident cost, income, time trend, alcoholic intoxication, driving speed and driver age for the pre-regulatory period and then, using the same model, projected fatality rates for the post-regulatory period. There was no significant difference between projected and actual fatality rates during the post-regulatory period and he therefore concluded that the Act had not been effective. He argued that safer cars produced an offsetting behavior on part of drivers as drivers became driving less cautiously while relying on safety equipment installed in their cars. This conclusion finds support in Wilde’s (1998) paper who argues that there is a constant injury risk target which drivers seek to maintain, therefore, safety regulations are usually being offset. 24.
(31) Evidence of an offsetting behavior was also found by Garbacz (1990) and Keeler (1994). On the other hand, other researchers have reservations about Peltzman’s findings. Robertson (1977) considers Peltzman’s model insufficiently robust and sensitive to changes in preregulatory period. When he re-estimated the equation based on a shorter period (1947-1959 instead of 1947-1965), he obtained different coefficients and projected fatality rates were higher compared with actual ones. Joksch (1976) criticized possible multicollinearity among some variables (income, time trend, and speed) which might have led to biased coefficients. After reestimating an adjusted model he concluded that the original model was unstable. Studies by Crandall & Graham (1984) and Zlatoper (1984) also indicate that offsetting behavior does not exist. These studies were examining situation in the United States. Several researchers performed studies based on Peltzman’s model in Asian countries. Garbacz (1989) examined determinants of traffic fatalities in Taiwan from 1964 to 1984. The situation was, nevertheless, very different from what it is nowadays; road causalities were on the rise, there were no regulations on seat-belt or helmet usage, drunk driving did not appear to be a severe problem although alcohol law was in place already. The study was undertaken relatively shortly after the industrialization of Taiwan had begun, Garbacz, therefore, had to consider characteristics of a transitioning economy. He modified Peltzman’s model and used following variables to explain traffic fatalities: real income, accident price, numbers of registered motorcycles and automobiles, real price of gasoline, truck-ton-kilometers and ratio of agricultural employment to total employment. His study suggested that disposable income, number of registered motorcycles and truck-ton-kilometers were positively related to fatalities while the price of accidents, price of gasoline and number of registered automobiles had a negative impact on fatalities. Another conclusion was that an economy based on labor-intensive agriculture reduced fatalities. McCornac (1993) estimated the effectiveness of seat-belt usage and government safety policies in Japan. In his study he used real income, accident price, highway miles travelled by automobiles, real expenditures on alcohol, percentage of speed limit violations, seat-belt usage and safety policy to estimate their impact on death toll. The data on seat-belt usage were obtained from annual surveys of the National Police Agency and expressed as a percentage of drivers who used seat-belts on a regular basis. Safety policies were a proxy for improvements in traffic safety equipment and were estimated as a number traffic signals, road signs and other road safety elements weighted by length of roadways. Seat-belt usage, safety policies and 25.
(32) accident price had a significant negative effect whereas income and total miles travelled had a significant positive effect. Another paper based on Peltzman’s model was written by Wong & Wu (1998). Their study tested the efficacy of safety policies (namely seat-belt regulation, usage of breathalyzers, and circuit training and testing system25) along with other socioeconomic determinants (income, accident price, population, number of motorcycles and automobiles, and time trend) on total, occupant, and non-occupant fatalities in Singapore. Dummy variables were used to represent existence or non-existence of a safety policy in a given year. Breathalyzers and seat-belt law were not found to be effective in reducing traffic fatalities, the only safety policy showing a significant negative impact was the implementation of circuit training system. Time trend proved to be negatively related to traffic causalities while number of registered automobiles had a positive effect. In summary, the various studies of the efficacy of government safety policies in reducing traffic fatalities have not been conclusive. This paper examined effects of safety policies and other socioeconomic determinants on fatalities in Taiwan. While studies depicted in literature presented important aspects in general and antecedents linked significantly to traffic fatalities in particular, they at the same time paid limited attention to the effects of both legal variables (e.g., alcohol law and helmet law) and socioeconomic variables (e.g., real price of fuel, unemployment rate, number of vehicles) as a whole on the number of fatalities. This work is unique in that it studies both groups of variables individually in order to estimate their unbiased effect on road fatalities.. 25. This system was introduced in April 1985 with the aim of ensuring that the new pools of drivers and riders were adequately trained and prepared for the roads. The circuits cater for the training and testing of learner drivers and riders. Furthermore, all learner riders were banned from public roads in October 1985.. 26.
(33) 3 METHODOLOGY 3.1 Model specifications The monthly number of fatalities in Taiwan may be analyzed as a time series process. The model was based on the standard Peltzman’s time series model with some modifications of variables. It was estimated using Ordinary Least Square (OLS) multiple regression method in log-log form with natural logarithms where the base is e ≈ 2.71828. The coefficients are elasticities of dependent variables in respect to the independent variable. In other words, the interpretation is given as an expected percentage change in independent variable when dependent variable increases by one percentage point, assuming other variables remain constant. The estimated model in equation form is as follows: ln 𝐹𝐴𝑇𝐴𝐿𝐼𝑇𝐼𝐸𝑆𝑡 = 𝛼 + 𝛽1 ln 𝐻𝐸𝐿𝑀𝐿𝐴𝑊𝑡 + 𝛽2 ln 𝐴𝐿𝐶𝐿𝐴𝑊𝑡 + 𝛽3 ln 𝐼𝑁𝐶𝑂𝑀𝐸𝑡 + 𝛽4 ln 𝐴𝐿𝐶𝑂𝐻𝑂𝐿𝑡 + 𝛽5 ln 𝐹𝑈𝐸𝐿𝑡 + 𝛽6 ln 𝑈𝑁𝐸𝑀𝑃𝐿𝑂𝑌𝑡 + 𝛽7 ln 𝑉𝐸𝐻𝐼𝐶𝐿𝐸𝑆𝑡 + 𝛽8 𝑇𝑅𝐸𝑁𝐷𝑡 + 𝜀𝑡. (2) where FATALITIES is the number of motor vehicle fatalities in month t; α is the constant; HELMLAWt and ALCLAWt are helmet law and alcohol law in month t, respectively; INCOMEt is disposable income per capita in month t; ALCOHOLt and FUELt are alcohol price and fuel price in month t; UNEMPLOYt is unemployment rate in month t; VEHICLESt is number of vehicles in month t; TRENDt is a secular trend in month t; and εt is an error term in month t. Monthly time series data span a period from January 1991 to December 2012 which allowed to construct a model with n = 264 observations. The model was tested in three stages. In the first stage, only socioeconomic variables were studied in order to examine their influence on fatalities while disregarding the effect of governmental policies. The second stage measured legal predictors to test their impact and significance. In the third stage, all explanatory variables were analyzed and their mutual effect was scrutinized. Durbin–Watson (DW) statistics was used to detect presence of first-order autocorrelation in each examined model. If DW exceeded critical values, model was rectified by using Prais– Winsten transformation. Prais–Winsten method is a modification of Cochrane–Orcutt 27.
(34) estimation which does not lose the first observation and leads to more efficiency as a result.. 3.2 Model variables Monthly time-series data from January 1991 to December 2012 period were used to estimate the regression equations for total traffic fatalities in Taiwan. In the model total fatalities were explained as a product of several predictor variables. Two groups of these variables were tested: socioeconomic variables and legal variables. Following table summarizes all variables and their expected effects. Table 3 Variable definitions Variable. Definition. Expected effect. Dependent variable FATALITIES. Number of motor vehicle fatalities. Legal independent variables HELMLAW. Fine for violating helmet law. <0. ALCLAW. Fine for driving under the influence. <0. Socioeconomic independent variables INCOME. Real disposable income per capita. >0. ALCOHOL. Alcohol price. <0. FUEL. Fuel price. <0. UNEMPLOY. Unemployment rate. <0. VEHICLES. Registered vehicles. >0. TREND. Secular trend. <0. FATALITIES were compiled from statistics by the Ministry of Health and Welfare which include causalities resulting from all road traffic accidents involving automobiles, motorcycles, and bicycles as well as collisions with pedestrians but exclude railway accidents, marine accidents, and aircraft crashes. As discussed in chapter 2.2.6 Fatalities, data provided by the Ministry of Health and Welfare was not limited to a specific timeframe unlike the official statistics by the National Police Agency which only include fatalities occurring within 24 hours of an accident. This methodology results in higher but more accurate numbers. HELMLAW is fine for violating the helmet law which was defined in a revision of Article 31 28.
(35) of the Road Traffic Management and Penalty Act (Laws and Regulations Database of the Republic of China, MOJ, 2013) taking effect in January 1997. The law states that violators failing to wear a helmet shall be fined 500 TWD; the price has not been increased since the introduction of the law. ALCLAW is the upper limit of fine for violating the alcohol law, i.e., when alcohol level “exceeds the maximum tolerated standard” (Laws and Regulations Database of the Republic of China, MOJ, 2013) 26 . The law was firstly introduced in Article 35 of the Road Traffic Management and Penalty Act in July 1975 and fined violators 300-600 TWD; further revisions changed the price range to 900-1,800 TWD, 6,000-12,000 TWD, and 15,000-60,000 TWD in May 1986, January 1997, and January 2001, respectively. The fine was raised to 15,000-90,000 TWD in January 2013 but the increase is out of range of time period observed in this work. Both law variables, i.e., HELMLAW and ALCLAW, were further adjusted for inflation (2011 = 100). A variable accounting for seat-belt law was also tested in a preliminary specification of the model. The variable was defined as the upper limit of fine for violating the seat-belt law described in Article 31 of the Road Traffic Management and Penalty Act (Laws and Regulations Database of the Republic of China, MOJ, 2013) weighted by the road length and number of seats which it applied to. The seat-belt law was introduced in March 1985 and only regarded front seat occupants driving on freeways; violators were fined 500 TWD. The fine was raised to 1,000 TWD in May 1986 and to 3,000 TWD in January 1997. The law expanded to front seat car occupants driving on expressways in January 1997 but it was not until January 2001 that the compulsory use of seat-belts for front seat car occupants took effect on all roads. At the same time, fine for violating the law on freeways was raised to 3,000-6,000 TWD. The law was revised in January 2012 and the fines were adjusted to 3,000-6,000 TWD both on freeways and expressways and mandatory use of seat-belts expanded to back seat car occupants. However, both alcohol law and seat-belt law were subject to major revisions in January 1997 and January 2001 which means that the variables are highly correlated (r = 0.9931) and it is not possible to use them in the regression simultaneously. The author decided to fit the model with ALCLAW. 26. Blood alcohol content (BAC) tolerated in Taiwan is 0.05% (Yeh, 2012).. 29.
(36) because driving under the influence appears to be a more serious problem in Taiwan27. INCOME refers to real disposable income per capita. Peltzman (1975), Zlatoper (1984), Garbacz (1989), McCornac (1993) and Wong & Wu (1998) found income to be positively related to traffic fatalities as increased level of income affects one’s ability to travel. Rising wealth of society increases the amount of traveling which is made solely for purpose of recreation. The greater the aggregate distance driven, the greater the probability of a traffic accident. Greater portion of population can afford to own a private vehicle which results in higher density of vehicles on the roads. Young inexperienced drivers who are known to have high fatality rates28 are also more likely to get access to vehicles and use them actively when the economy is performing well. Furthermore, it was expected that as income rises the value of time rises accordingly and drivers may increase their travel speed (and the likelihood of an accident) to save valuable time. In this study, real disposable income per capita (INCOME) in month t was calculated from corresponding gross national disposable income (GNDI) in quarter q at current prices which was divided into months and further deflated by consumer price index (CPI) at month t. The figure was eventually divided by population (P) of Taiwan in month t. 𝐺𝑁𝐷𝐼𝑞 ⁄ 3 𝐶𝑃𝐼𝑡 𝐼𝑁𝐶𝑂𝑀𝐸𝑡 = 𝑃𝑡 (3). Figures of disposable income and consumer price index were taken from the Directorate General of Budget, Accounting and Statistics, Executive Yuan (2013), figures of population were obtained from the Department of Household Registration Affairs, MOI (2013). ALCOHOL is real price of alcoholic beverages of consumer price index (2011 = 100). Increase in price of alcoholic beverages was expected to lead to decline in their consumption and, correspondingly, to lower numbers of intoxicated drivers. Drunk driving is a common cause of traffic accidents in Taiwan29 so its reduction is likely to result in decrease in alcohol-related fatalities. Data was provided by the Directorate General of Budget, Accounting and Statistics, Executive Yuan (2013).. 27 28 29. For more details see chapter 2.2.4 Accidents. For more details about fatality rates by age groups, see chapter 2.2.6 Fatalities. For more details about the most common causes of accidents in Taiwan see chapter 2.2.4 Accidents.. 30.
(37) FUEL is real price of fuels and lubricants of consumer price index (2011 = 100). Growing price was expected to result in lower vehicle usage, i.e., drivers more willing to use bicycles or walk over short distances rather than ride a motorcycle or drive a car. Hsu et al. (2003b) reported that almost 10% of travels made on motorcycles were shorter than 1 kilometer and nearly 20% are between 1 and 3 kilometers which means that almost one third of all trips made on motorcycles was shorter than 3 kilometers. Motorcycles are fairly easily substituted by bicycles over such short distances. Data was obtained from the Directorate General of Budget, Accounting and Statistics, Executive Yuan (2013). UNEMPLOY is unemployment rate per mil measured as the number of unemployed persons of the total labor force. Assumption was that increase in unemployment leads to decrease in motor vehicle usage for unemployed persons as they are likely to lessen the amount and distance of their travels and, due to lack of income, forgo their recreational trips. At the same time, the unemployment rate is an important economic variable serving as a proxy for the overall state of country’s economy. Increase in unemployment rate is usually result of economic downturn which influences majority of population and the reduction of traveling thus affects wider range of population than only actually unemployed persons. Data was acquired from statistical tables of National Statistics, Republic of China (2013). VEHICLES is number of motor vehicles registered by the Ministry of Transportation and Communications. The figure combines several classes of vehicles: automobiles, motorcycles, light trucks, heavy trucks, buses, and specially constructed vehicles. Assuming that the ratio of kilometers driven per vehicle remains constant over time, the increase in number of motor vehicles was expected to lead to higher exposure to vehicles and increase in accidents and fatalities. Data was obtained from the Ministry of Transportation and Communications (2013b). TREND is secular trend which serves as a proxy for technological progress. Peltzman (1975) suggested that “it was impractical to treat separately numerous variables which should affect accident rates or their severity. Among these variables were the state of driver skill, the quality of highways, the private demand and supply of improved vehicle design, the quality of health care, and the demand and supply of vehicle maintenance. This technological change is difficult to measure, fatalities are, however, expected to decline over time due to progress in engineering and medicine.” The trend was measured by a value of 1 for the first month, increasing by 1 unit each successive month.. 31.
(38) List of all variables used in the regression and their values can be found in Appendix 15 Overview of independent variables (aggregated annually). Table 4 summarizes descriptive statistics of used variables after their conversion to natural logarithmic form30. Table 4 Summary statistics for used variables Variable. Mean. Standard Deviation. Minimum. Maximum. FATALITIES. 6.044. 0.292. 5.460. 6.561. HELMLAW. 4.571. 2.805. 0.000. 6.368. ALCLAW. 9.869. 1.432. 7.620. 11.122. INCOME. 10.506. 0.158. 10.139. 10.725. ALCOHOL. 4.516. 0.181. 4.215. 4.768. FUEL. 4.307. 0.189. 4.018. 4.722. UNEMPLOY. 3.458. 0.458. 2.485. 4.116. 16.625. 0.237. 16.129. 16.922. 132.500. 76.354. 1.000. 264.000. VEHICLES TREND. All variables have n = 264 observations.. 30. Variable TREND is not measured in the logarithmic form.. 32.
(39) 4 DATA ANALYSIS AND RESULTS The model was estimated using the Ordinary Least Square (OLS) multiple regression in loglog form. It was regressed in three stages; socioeconomic variables were estimated in the first stage, legal variables were estimated in the second stage, and all predictor variables combined were regressed in the third stage. Each model was consequently tested for first-order correlation using Durbin–Watson (DW) method and models with significant autocorrelation 31 were corrected using Prais–Winsten (PW) procedure. The regression results of legal (Model 1), socioeconomic (Model 2), and combined (Model 3) predictors on traffic fatalities are presented in Table 5. Table 5 Regression results of determinants of traffic fatalities in Taiwan Model 1 Variable. Coefficient. Constant. 7.931 ***. HELMLAW. 0.018. ALCLAW. -0.200 ***. INCOME. Model 2 t. p. 32.620 0.000. Coefficient 5.295 *. Model 3 t. p. 1.320 0.094. 1.210 0.114 -6.520 0.000 0.955 ***. 5.410 0.000. Coefficient. t. p. -8.711 **. -1.730 0.043. -0.026 ***. -2.920 0.002. -0.002. -0.070 0.473. 0.880 ***. 5.320 0.000. ALCOHOL. -0.036. -0.500 0.311. -0.040. -0.520 0.303. FUEL. -0.198 **. -1.950 0.026. -0.101. -1.030 0.151. UNEMPLOY. -0.246 ***. -5.100 0.000. -0.223 ***. -4.550 0.000. VEHICLES. -0.427 *. -1.450 0.074. TREND. -0.002 ***. -3.000 0.001. 0.458 * -0.004 ***. Adjusted R2. 0.773. 0.879. 0.892. DW. 2.494. 2.169. 2.101. 1.320 0.094 -5.080 0.000. * p < .10. ** p < .05. *** p < .01. Dependent variable is FATALITIES.. MODEL 1 has adjusted R-squared value of 0.773 and DW statistic is 2.494. The DW statistic of the original (OLS) model was 0.633 which was below the critical value (1.781 for n = 260, df = 2, α = 0.05) suggesting presence of positive autocorrelation in the residuals. The model was therefore corrected using PW procedure. The Prais–Winsten estimates show at a 10%. 31. Durbin–Watson statistic tests the null hypothesis H0 that the errors are uncorrelated against the alternative hypothesis H1 that they follow a first order autoregressive process. Critical values of DW statistic were obtained from tables by Savin & White (1977).. 33.
數據

+7

相關文件
Laughing (a positive outlook) can beat negative emotions during hard times2. Laughing (a positive outlook) can beat negative emotions during
Ma, T.C., “The Effect of Competition Law Enforcement on Economic Growth”, Journal of Competition Law and Economics 2010, 10. Manne, H., “Mergers and the Market for
Indeed, in our example the positive effect from higher term structure of credit default swap spreads on the mean numbers of defaults can be offset by a negative effect from
Key words: theory of the nature of the mind, the Buddha nature, one who possesses a gotra, non-resultant activity which is neither positive nor negative and is able
Experiment a little with the Hello program. It will say that it has no clue what you mean by ouch. The exact wording of the error message is dependent on the compiler, but it might
The grade of the children, education level of parents, the occupation of parents, and the number of times meals are cooked at home have a significant influence on a perception
Results of this study show: (1) involvement has a positive effect on destination image, and groups with high involvement have a higher sense of identification with the “extent
There was a significant difference in behaviors of a low-carbon diet among with different mother’s occupations.A positive correlation was gained among knowledge attitudes
