行政院國家科學委員會專題研究計畫 成果報告
總計畫及子計畫一:台灣海峽之水團組成、流通量與聖嬰現
象(Ⅱ)(2/2)
計畫類別: 整合型計畫
計畫編號: NSC92-2611-M-110-014-
執行期間: 92 年 08 月 01 日至 93 年 07 月 31 日
執行單位: 國立中山大學海洋地質及化學研究所
計畫主持人: 陳鎮東
共同主持人: 白書禎,劉倬騰
計畫參與人員: 雷佳、羅立章、邢麗玉、候偉萍、曾筱君、王昱文、蔡長利、
許志宏、王冰潔、周文臣、郭子文
報告類型: 完整報告
處理方式: 本計畫可公開查詢
中 華 民 國 93 年 11 月 4 日
D:\NSC\92s\成果\sweet\SWEET-920801-930731.doc
行政院國家科學委員會補助專題研究計畫
;
成 果 報 告
□期中進度報告
(瞭望台灣海峽環境與生態-總計畫與子計畫一:
台灣海峽之水團組成、流通量與聖嬰現象(II)(2/2)
計畫類別:
□
個別型計畫 ; 整合型計畫
計畫編號:NSC 92-2611-M-110-014
執行期間: 92 年 8 月 1 日至 93 年 7 月 31 日
計畫主持人:陳鎮東教授
共同主持人:劉倬騰教授、白書禎教授
計畫參與人員: 雷佳、羅立章、邢麗玉、候偉萍、曾筱君、王昱文、蔡長利、
許志宏、王冰潔、周文臣、郭子文
成果報告類型(依經費核定清單規定繳交):□精簡報告 ;完整報告
本成果報告包括以下應繳交之附件:
□赴國外出差或研習心得報告一份
□赴大陸地區出差或研習心得報告一份
□出席國際學術會議心得報告及發表之論文各一份
□國際合作研究計畫國外研究報告書一份
處理方式: 除產學合作研究計畫、提升產業技術及人才培育研究計畫、
列管計畫及下列情形者外,得立即公開查詢
□ 涉及專利或其他智慧財產權, □一年□ 二年後可公開查詢
執行單位: 中山大學海洋地質及化學研究所
中 華 民 國 九十三 年 十 月 十五 日
D:\NSC\92s\成果\SWEET-920801-930731.doc
本計畫自九十二年八月至今,共發表
(一) 論文如下:
SCI 1.
Saino, T., A. Bychkov, C.T.A. Chen and P.J. Harrison North Pacific Synthesis of
the Joint Global Ocean Flux Study: Overview. Journal of Oceanography, 60, 1-4,
2004. (附件1)
SCI 2.
Chen, C.T.A., A. Andreev, K.R. Kim and M. Yamamoto Role of continental
shelves and marginal seas in the biogeochemical cycles of the North Pacific,
Journal of Oceanography, 60, 17-44, 2004. (附件2)
3.
Chen, C.T.A., J.T. Liu and B.J. Tsuang Island-based catchment—The Taiwan
example, Regional Environmental Change, 4, 39-48, 2004.
4.
Sabine, C., M. Heiman, P. Artaxo, D. Bakker, C.-T. A. Chen, C.B. Field, N.
Gruber, C. LeQuéré, R.G. Prinn, J.E. Richey, P.R. Lankao, J. Sathaye and R.
Valentini Current status and past trends of the carbon cycle, in “The Global
Carbon Cycle: Integrating Humans, Climate, and the Natural World”, eds. C.B.
Field and M.R. Raupauch, Island Press, 17-44,2004.
5.
Gruber, N., P. Friedlingstein, C.B. Field, R. Valentini, M. Heimann, J.E. Richey,
P.R. Lankao, D. Schulze and C.T.A. Chen The vulnerability of the carbon cycle
in the 21
stcentaury: A assessment of carbon-climate-human interactions, in “The
Global Carbon Cycle: Integrating Humans, Climate, and the Natural World”, eds.
C.B. Field and M.R. Raupauch, Island Press, 45-76, 2004.
6.
Caldeira, K., G. Morgan, D. Baldocchi, P. Brewer, C.T.A. Chen, G.J. Nabuurs, N.
Nakicenovic and P. Robertson. A portfolio of carbon management options, in
“The Global Carbon Cycle: Integrating Humans, Climate, and the Natural World”,
eds. C.B. Field and M.R. Raupauch, Island Press, 103-129, 2004.
7.
Chen, C.T.A. Exchanges of carbon in the coastal seas, in “The Global Carbon
Cycle: Integrating Humans, Climate, and the Natural World”, eds. C.B. Field and
M.R. Raupauch, Island Press, 341-351, 2004 (cited once until 2004).
D:\NSC\92s\成果\SWEET-920801-930731.doc SCI 8.
Chen, C.T.A., L.Y. Hsing, C.L. Liu and S.L. Wang Degree of nutrient
consumption of upwelled water in the Taiwan Strait based on dissolved phosphorus
or nitrogen, Marine Chemistry, 87, 73-86, 2004.(附件3)
(二) 自九十二年八月至今,共參加航次如下:
航次
日期
OR1-694
92 年
9 月 15~19 日
OR2-1139 92 年
9 月 15~19 日
OR3-901
92 年
9 月 15~19 日
OR1-713
93 年
3 月 29 日~4 月 1 日
OR2-1182 93 年
3 月 29~31 日
OR3-948
93 年
3 月 29~31 日
OR1-725
93 年
7 月 26~30 日
D:\NSC\92s\成果\SWEET-920801-930731.doc
Journal of Oceanography, Vol. 60 (No. 1), pp. 1-4, 2004
North Pacific Synthesis of the Joint Global
Ocean Flux Study: Overview
Toshiro Saino
1
*, Alexander Bychkov
2
, Chen-Tung Arthur Chen
3,1
and
Paul J. Harrison
4
1
Hydrospheric Atmospheric Research Center, Nagoya University, Nagoya
464-8601, Japan
2
North Pacific Marine Science Organization, c/o Institute of Ocean
Sciences, Sidney, BC, Canada, V8L 4B2
3
Institute of Marine Geology and Chemistry, National Sun Yat-Sen
University, Kaohsiung 804, Taiwan, R.O.C.
4
AMCE Program, Hong Kong University of Science and Technology,
Clear Water Bay, Hong Kong
(Received 19 December 2003)
Abstract: This special issue is comprised of 13 papers, including this
overview, and focuses on the synthesis of the Joint Global Ocean Flux
Study (JGOFS) in the North Pacific which took place from 1997 through
2003. The effort was led by the JGOFS North Pacific Synthesis Group,
with the aim of quantifying CO
2
drawdown by physical and biological
pumps in the North Pacific by identifying and studying the regional,
seasonal to inter-annual variations in the key processes, and understanding
their regulating mechanisms. Emphasis was placed on the similarities and
differences of the biogeochemical regimes in the eastern and western
subarctic Pacific. Effort was also made to address the future research
directions which arose from the scientific findings during the North Pacific
JGOFS process study. A brief overview of the papers from view points of
CO
2
drawdown by physical and biological pumps, spatial variability, and
temporal variability from seasonal to decadal scales is made, followed by
TERRAPUB
Journal of Oceanography
Back
第 1 頁,共 2 頁
Abstract: JO, Vol. 60 (No. 1), pp. 1-4
suggestions for the directions of future research.
*Corresponding author E-mail:
mailto:%[email protected]
[Full text]
(PDF 65 KB)
第 2 頁,共 2 頁
Abstract: JO, Vol. 60 (No. 1), pp. 1-4
D:\NSC\92s\成果\SWEET-920801-930731.doc
Journal of Oceanography, Vol. 60, pp. 17 to 44, 2004
Keywords:
⋅⋅⋅⋅⋅Bering Sea,
⋅⋅⋅⋅⋅Japan/East Sea,
⋅⋅⋅⋅⋅Okhotsk Sea,
⋅⋅⋅⋅⋅East China Sea,
⋅⋅⋅⋅⋅South China Sea,
⋅⋅⋅⋅⋅Kuroshio, ⋅⋅⋅⋅⋅Sulu Sea, ⋅⋅⋅⋅⋅Gulf of California, ⋅⋅⋅⋅⋅nutrients, ⋅⋅⋅⋅⋅denitrification, ⋅⋅⋅⋅⋅carbon, ⋅⋅⋅⋅⋅anthropogenic CO2, ⋅⋅⋅⋅⋅budgets, ⋅⋅⋅⋅⋅North Pacific Intermediate Water.
* Corresponding author. E-mail: [email protected]
Copyright © The Oceanographic Society of Japan.
Roles of Continental Shelves and Marginal Seas in the
Biogeochemical Cycles of the North Pacific Ocean
CHEN-TUNG ARTHUR CHEN1*, ANDREY ANDREEV2, KYUNG-RYUL KIM3 and MICHIYO YAMAMOTO4
1Institute of Marine Geology and Chemistry, National Sun Yat-Sen University, Kaohsiung 804, Taiwan, R.O.C.
2Pacific Oceanological Institute Far Eastern Branch, Russian Academy of Sciences, Vladivostok, Russia
3OCEAN Laboratory/RIO, SEES, Seoul National University, Shilim-Dong, Gwanak-Gu, Seoul 151-747, Korea
4Frontier Observational Research System for Global Change, International Arctic Research Center, University of Alaska Fairbanks, Fairbanks, AK 99775-7335, U.S.A.
(Received 25 August 2003; in revised form 29 October 2003; accepted 1 November 2003)
Most marginal seas in the North Pacific are fed by nutrients supported mainly by upwelling and many are undersaturated with respect to atmospheric CO2 in the
sur-face water mainly as a result of the biological pump and winter cooling. These seas absorb CO2 at an average rate of 1.1 ± 0.3 mol C m–2yr–1 but release N2/N2O at an
average rate of 0.07 ± 0.03 mol N m–2yr–1. Most of primary production, however, is regenerated on the shelves, and only less than 15% is transported to the open oceans as dissolved and particulate organic carbon (POC) with a small amount of POC de-posited in the sediments. It is estimated that seawater in the marginal seas in the North Pacific alone may have taken up 1.6 ± 0.3 Gt (1015 g) of excess carbon, includ-ing 0.21 ± 0.05 Gt for the Bering Sea, 0.18 ± 0.08 Gt for the Okhotsk Sea; 0.31 ± 0.05 Gt for the Japan/East Sea; 0.07 ± 0.02 Gt for the East China and Yellow Seas; 0.80 ± 0.15 Gt for the South China Sea; and 0.015 ± 0.005 Gt for the Gulf of California. More importantly, high latitude marginal seas such as the Bering and Okhotsk Seas may act as conveyer belts in exporting 0.1 ± 0.08 Gt C anthropogenic, excess CO2 into
the North Pacific Intermediate Water per year. The upward migration of calcite and aragonite saturation horizons due to the penetration of excess CO2 may also make
the shelf deposits on the Bering and Okhotsk Seas more susceptible to dissolution, which would then neutralize excess CO2 in the near future. Further, because most
nutrients come from upwelling, increased water consumption on land and damming of major rivers may reduce freshwater output and the buoyancy effect on the shelves. As a result, upwelling, nutrient input and biological productivity may all be reduced in the future. As a final note, the Japan/East Sea has started to show responses to global warming. Warmer surface layer has reduced upwelling of nutrient-rich sub-surface water, resulting in a decline of spring phytoplankton biomass. Less bottom water formation because of less winter cooling may lead to the disappearance of the bottom water as early as 2040. Or else, an anoxic condition may form as early as 2200 AD.
gins and in the coastal ocean although continental mar-gins influence global biogeochemical cycles much more than their areal extent might imply (Wollast, 1998; Liu et
al., 2000a, b). Coastal regions are also especially
suscep-tible to anthropogenic influence at a time when humans are strongly interfering in the global biogeochemical cy-cle of carbon (C), nitrogen (N) and phosphorus (P). This interference has led to substantially increased loadings
1. Introduction
Many global assessments of the oceanic carbon cy-cle (e.g. Chen and Drake, 1986) have not fully accounted for the carbon fluxes and dynamics on continental
mar-of the land and atmosphere with chemicals such as nutri-ents from these activities, especially in the North Pacific. These discharges might have significantly stimulated car-bon fixation (up to 0.5–1 Gt C yr–1) (Smith and Hollibaugh, 1993; Meybeck, 1993; Chen et al., 1994; LOICZ, 1997; Mackenzie et al., 1998, 2001, 2002a, 2002b; Mackenzie and Ver, 2001). At present, however, it is not known how much of this excess organic carbon (OC) is simply re-oxidized, and how much is permanently sequestered by export to the interior ocean, or in sediments on the shelves and shallow seas. Jahnke et al. (1990) es-timated that about half of the OC input into the seabed of the North Pacific occurs within 500 km of the margin. Walsh et al. (1981, 1991) and Walsh (1991) state that large amounts of OC are recycled on the Bering Sea shelves. Of the small fraction that is not remineralized, the major-ity is not buried on the shelves, but transported over the shelf edge and deposited on the continental slopes. Hedges and Keil (1995) state that continental shelf deposits alone are responsible for the storage of about 45% of the pre-served OC in the world. The number is doubled if deltas are included. Bauer and Druffel (1998) also pointed out that the ocean margins can contribute an order of magni-tude greater amount of dissolved and particulate organic matter (DOM and POM, respectively) to the interior of the Pacific than those derived from the surface open ocean. These aspects of the oceanic cycles of carbon and associ-ated elements, and their horizontal and vertical fluxes in the marginal seas of the North Pacific, are the subject of the JGOFS North Pacific Synthesis Group (NPSG), and the results are hereby reported.
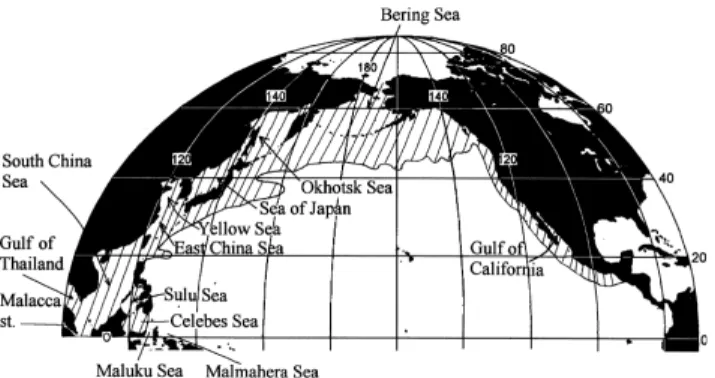
The North Pacific has some of the largest marginal seas in the world, including the Bering Sea (2.27 × 10⁶ km2), the Okhotsk Sea (1.53 × 10⁶ km2), the Japan/East Sea* (JES 1.0 × 10⁶ km2), the East China Sea (ECS, 0.77 × 10⁶ km2 plus the Bohai Gulf at 0.077 × 10⁶ km2 and the Yellow Sea at 0.38 × 10⁶ km2), and the South China Sea (SCS, 3.5 × 10⁶ km2) (Fig. 1). These seas form the linkage between the largest continent and the largest ocean, ventilate the deep oceans, receive much land run-off (Milliman et al., 1995; Dai and Trenberth, 2002) and exchange much material with the open oceans. General descriptions of the area studied are summarized in Table 1. The role of these marginal seas in the context of car-bon and nutrient cycles are briefly discussed with more emphasis on the CO2 sink. Several national and interna-tional projects have also been identified (Appendix I).
2. Carbon and Nutrient Cycles
Rock weathering and the decay of organic material, together with fertilizers and waste discharges, are the
major sources of most forms of nutrients to the sea, to which they are usually carried by terrestrial drainage in-cluding rivers, freshwater runoff, groundwater discharge and point source discharges (Mackenzie et al., 1998). For coastal oceans the human inputs, including aeolian, are beginning to become signicificant compared to weather-ing (Hong et al., 1995; Hu et al., 1998; Vörösmarty et
al., 1998; Rabouille et al., 2001).
The marine organisms act as a “biological pump”, thus removing CO2 and nutrients from the surface ocean and transferring these elements into the deeper ocean and ocean bottom. The ratios among carbon, nitrogen and phosphorus in phytoplankton vary but the Redfield Ratio is still a good representation (Chen et al., 1996b; Hedges
et al., 2002). Assuming C:N:P ratios of 106:16:1,
remineralization of these material can be represented by the equation (Redfield et al., 1963):
(CH2O)106(NH3)16H3PO4 + 138O2
↔ 106CO2 + 122H2O + 16HNO3 + H3PO4. (1) Nitrate values in coastal waters usually decrease going seaward in surface waters and increase along the same axis in deep waters. Upwelling regions have major inputs of new nitrogen from the subsurface open ocean and the surface nitrate concentrations are higher, and of-ten have strong oxygen depletion and periodically show a high degree of denitrification, resulting in high subsur-face ammonium, N2O and nitrite values. One of the ma-jor reactions is as follows:
(CH2O)106(NH3)16H3PO4 + 94.4HNO3
↔ 106CO2 + 177.2H2O + H3PO4 + 55.2N2. (2) The concentrations of phosphate and silicate in coastal waters are also often higher than in the water fur-ther offshore due to land runoff, sewage outflow, and
*The Editor-in-Chief does not recommend the usage of the term “East Sea” in place of “Japan Sea”.
Fig. 1. Marginal Seas in the North Pacific. The hatched area indicates where the dominant water mass transfer is from the interior ocean to the surface mixed layer (redrawn from Blanke et al., 2002).
T
able 1. North Pacific Continental Mar
gins: Site Descriptions.
1. Chen
et al
. (2003a); 2. JGOFS (1997); 3. Loder
et al . (1998); 4. Hill et al . (1998); 5. Matsumura et al . (2002); 6. Church et al . (1998). *Narrow , <100 km; medium 100–300 km; wide, >300 km.
coastal upwelling. When denitrification occurs N2O or N2 may escape from the water column making DIN/DIP ratio lower (Eq. (2); Gordon et al., 1996; Seitzinger, 2000). Since Si exists in the extracellular structures of diatoms, silicoflagellates and radiolarians, whereas N and P exist in the soft tissue, Si frequently does not covary with N or P.
There is clear evidence of changes in the concentra-tions of fixed N in some coastal systems due to human activities (Kemp, 1995). These nutrients are carried to the oceans mainly via rivers and groundwater. A recent report (IGBP, 1994) estimated the total anthropogenic inorganic N and P inputs to the coastal zone as 1.5 × 10¹² mol N and 0.52 × 10¹¹ mol P per year. Galloway et al. (1995), however, estimated that 4.2 × 10¹² mol N yr–1 of the nitrogen fixed by human activities are injected into oceans, of which 2.9 × 10¹² mol N yr–1 are from river flow and the rest are from the atmospheric deposition. Smith et al. (2003) reported that the total loads for the 1990s are about three times Meybeck’s (1993) estimates mainly for the 1970s. No doubt, part of the increase must have been due to human influences.
3. Case Studies on North Pacific Marginal Seas
3.1 East China Sea
Since the ECS has been studied the most thoroughly, we will discuss it first. The ECS, including the Gulf of Bohai and the Yellow Sea has a total area of 1.24 × 10⁶ km2 of which about 0.9 × 10⁶ km2 is the continental shelf, one of the largest in the world. It is also one of the most productive areas of the world oceans. Two of the largest rivers in the world, the Yangtze River (Changjiang) and the Yellow River (Huanghe), empty into the shelf with large, and ever increasing nutrient and carbon inputs. For instance, the NO3 concentration near the Yangtze River (Changjiang) estuary increased four-fold between 1963 and 1983, because of the 2.25-fold increase in the use of N-containing fertilizers in China. The DIN/DIP ratio in the estuarine water has also doubled in 20 years, but net primary productivity (PP) has not shown much variation (Gu, 1991; Zhang, 1991; Zhang and Gu, 1994; Note that net primary productivity is frequently reported but it is not always clear in the original references).
The Kuroshio Surface Water (KSW), Kuroshio Tropi-cal Water (KTW), Kuroshio Intermediate Water (KIW) and the Shelf Surface Water (SSW) make up the major water masses near the ECS continental shelf break (Chen
et al., 1995b). Although the major currents are parallel to
the isobath, the SSW has a net transport offshore because of the buoyancy induced by the net precipitation (QP–QE, where Q denotes the flux in mass unit, subscripts P and E are precipitation and evaporation, respectively) and the fresh water discharge from rivers (QRi), while KSW, KTW
and KIW have net onshore transports. In addition, there is an input through the Taiwan Strait (TSW).
The relevant known nutrient fluxes are provided in Fig. 2. It is clear that the rivers play only a very minor role as they contribute only 7% of the dissolved inorganic phosphorus (DIP) input. The major contributors of P, in the form of DIP, are the KTW, KIW and TSW. Most of the incoming DIP is converted to the organic form which is either deposited on the shelf or is transported offshore as particulate. Note even if there is any man-made eutrophication or increased biomass production due to the increased anthropogenic input of P, the increase is prob-ably very small. On the other hand, enhanced or damped upwelling due to changes in climatic forcing or damming of large rivers would make a large difference in the bio-logical pump. There are evidences showing that the aeolian fluxes may be increasing during the past several hundred years (Lou et al., 1997; Chen and Wann, 1998). Anthropogenic iron input or enhanced aeolian input of loess which is rich in Fe and P may increase PP in the high nutrient-low chlorophyll regions or in waters where molecular nitrogen-fixing cyanobacteria may bloom.
As for N, the riverine input is 37% of the total in-flux, still smaller than the contribution from the incom-ing water masses but the difference is not as dramatic as that for P. It is worth noting that the 15N data (Minagawa
et al., 2001) supports the conclusion that the major source
of N for the ECS is from the NPIW (Chen, 1996). Tsunogai
et al. (2003) also confirm that half of N in the ECS is
supplied from the lower layer of the Kuroshio. Not much N leaves ECS with the outflowing seawater. Instead, the largest sinks are the net burial on shelf, the offshore
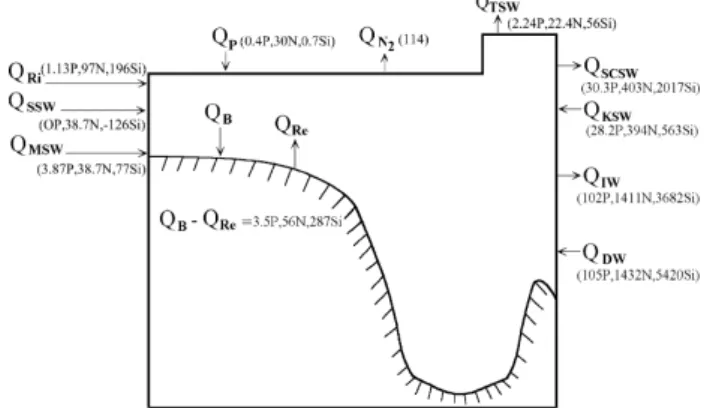
trans-Fig. 2. Schematic diagram for the annual nutrient budgets
(num-bers in 109 mol yr–1) in the East China Sea where Q is the
flux, subscripts Ri, P, TSW, KSW, KTW, KIW and SSW denote river input, precipitation, Taiwan Strait Water, Kuroshio Surface Water, Kuroshio Tropical Water, Kuroshio Intermediate Water and Shelf Surface Water, respectively; P denotes DIP, N denotes DIN, Si denotes silicate, Re de-notes the release from sediments, AS dede-notes the air-sea exchange, B denotes the nutrients buried, and SS denotes suspended sediments transported offshore (Chen et al., 2003a).
port in the form of sediments, and losses in the form of degassing as N2 and N2O (Watanabe et al., 1997; Oguri
et al., 2003) with an net denitrification rate of 0.103 ±
0.050 mol N m–2yr–1 (note the ± sign usually denotes standard deviation although it is not always clear from the original sources). This figure is small compared to those estimated in the coastal areas worldwide (Seitzinger
et al., 2000). This may be because the ECS value is
aver-aged over the entire shelf area rather than only in the nearshore coastal region. Further, because of the abun-dant Trichodesmium in the ECS (Chen et al., 1996b), ni-trogen fixation may be a significant source of N. Includ-ing this in the budget would increase the denitrification rate accordingly.
After the completion of the Shelf Edge Exchanges Processes (SEEP) project in the Atlantic Bight the sources of N for the shelf to support the measured PP was consid-ered as an unresolved question. The question was the dif-ficulty to reconcile the flux of nitrate onto the shelf with-out imposing an net export of water (Biscaye et al., 1994). Upwelling of nutrient-rich subsurface water however, would balance the export of nutrient-depleted surface water. Chen and Wang (1999) noted that the riverine DIN/ DIP ratio is 111 which is much higher than the Redfield N/P ratio of 16 for phytoplankton. This makes P more limiting to net organic production than N in the estuaries. The total seawater flux of N and P to the ECS, however, has a ratio of 13 which is much closer to the Redfield ratio. As a result, the P shortage in the ECS as a whole is not as dramatic thanks to the large influx due to the sub-surface Kuroshio waters. Changes in nutrient structure of small riverine input are also not expected to affect the stoichiometric nutrient balance of phytoplankton ecosys-tem in the ECS. The amount of Si transported by the riv-ers is 31% of the total influx. Note in Fig. 2 only the dis-solved or the easily dissolvable Si is included. Since it is not known how much of these convert into sediments, the offshore transport of SS can not be calculated.
The carbon fluxes are more complicated. On the Kuroshio side the surface water CO2 is more or less at equilibrium with the atmosphere because of the low nu-trient contents and PP. On the shelf the pCO2 is all under-saturated yearround because of the high PP. The influx of CO2 is about 2 ± 0.8 mol m–2yr–1 (Chen and Wang, 1999; Tsunogai et al., 1999; Oh et al., 2000). By way of com-parison, the global shelf average is about 1.2 mol m–2yr–1 (Chen, 2003b).
The major rivers bring in carbon in the form of dis-solved inorganic carbon (DIC), disdis-solved organic carbon (DOC), particulate inorganic carbon (PIC) and particulate organic carbon (POC). A mass-balance calculation gives the downslope contemporary particulate carbon transport rate as 2.8 ± 1.4 mol C m–2yr–1 (Fig. 3). Chen and Wang (1999) estimated the contemporary offshore POC
trans-port rate as 0.76 ± 0.38 mol C m–2yr–1. This value is equivalent to 5.7% of the average PP of 13.3 mol org C m–2yr–1 (Zhang, 1991). By way of comparison, the off-shore transport of POC of the global continental margins amounts to 6% PP on the shelf. Dividing the POC trans-port rate by 106 gives the particulate organic P (POP) transport rate as 6.6 ± 3.3 × 10⁹ mol yr–1, in good agree-ment with the estimate of 7.9 ± 4 × 10⁹ mol yr–1 obtained earlier.
Much of the land-derived DOC and POC is highly inert and mixes with seawater conservatively. Should this carbon partially or totally respire on the shelf it would form an natural source of atmospheric CO2 (Kempe, 1995). The DOC outflow, however, is higher than the to-tal input. Thus 1.14 ± 0.38 mol C m–2yr–1 new DOC is produced on the shelf and is transported to the open oceans each year. On the other hand, the ECS shelf waters pro-duce 0.79 ± 0.28 mol C m–2yr–1 POC for export out of the water column. Overall the ECS gets 6.24 ± 2.1 mol C m–2yr–1 OC from outside sources and exports 6.75 ± 2.25 mol C m–2yr–1 OC excluding the 0.67 ± 0.28 mol C m–2yr–1 buried. So the ECS currently is a net exporter of OC and is a net sink of atmospheric CO2. It should be noted that Jickells et al. (1991) reported that the major portion of POC in continental margin sediments is de-rived from algal cells that have been produced in the over-lying water. They reported that little of the POC in the sediment is of terrestrial origin.
The study of Chen and Wang (1999), however, indi-cates that about 20% of the ECS shelf deposit is relic. The results of Honda et al. (2000), Bauer et al. (2001) and Lin et al. (2002a) also indicate that a large portion of the off-shelf transport of POC may be old terrestrial or relic matter. Further, Ogawa et al. (2003) estimated a ter-restrial DOC input of 400 × 109 mol C yr–1 in the area close to the Changjiang River mouth, which is substan-tially larger than the total input of 170 × 109 mol C yr–1 that Chen and Wang (1999) chose to use (Fig. 3). A higher
Fig. 3. Schematic diagram for the annual carbon budget in the
East China Sea (numbers in 109 mol C yr–1) (taken from
riverine DOC input also implies that more shelf produced OC is recycled on the shelf. The net conversion of IC to OC is by the new production of 1.95 ± 0.98 mol org C m–2yr–1 which is 15% of the average PP with the rest re-generated on the shelf, mostly aerobically. Note the new production rate obtained from the P budget is 0.16 ± 0.05 mol C m–2yr–1. Results from the SEEP–II program on the eastern US continental shelf indicate that only less than 5% of the PP is exported to the adjacent slope (Anderson
et al., 1994; Biscaye et al., 1994). In the North Sea only
0.14% of the PP is accumulated on the shelf as POC, and 2–3% of the PP is exported over the margin (de Haas et
al., 1997).
The continental shelf waters are generally high in titration alkalinity (TA) because of river discharge and in situ generation due to oxidation of organic material, which reduces TA by 17 moles for the aerobic regeneration of 106 moles of OC (Chen et al., 1982). When the dissolved oxygen is exhausted in the sediments, the system turns to the next most abundant source for the oxidation of or-ganic material, NO3–, followed by the manganese, iron, sulfate and methane reductions (Noriki et al., 1997; Chen, 2002a). Chen and Wang (1999) estimated that on the or-der of 1 × 10¹² mol yr–1 of alkalinity is generated on the ECS shelf, mainly because of iron and sulfate reductions (Lin et al., 2002b). Fermentation, however, is probably responsible for the high CH4 found in the ECS, about 35% supersaturated (Tsurushima et al., 1996). The sea-to-air flux of CH4 is about 3 × 10⁹ mol yr–1. The DMS concen-tration in he surface water is about 80 and 17 ng S l–1, respectively, in summer and winter, with the correspond-ing fluxes of 2.2 and 0.6 mmol µg S m–2yr–1 (Uzuka et
al., 1997).
The anthropogenic, excess CO2 penetrates to ap-proximately 600 m in the ECS. The entire ECS contains 0.07 (±0.02) Gt C excess carbon in 1992. Since the wa-ters on the ECS shelf are highly supersaturated with re-spect to calcite and aragonite, sediments on the ECS shelf are not expected to neutralize excess CO2 in the coming century.
3.2 Bering Sea
The Bering Sea is the third largest marginal sea in the world and the second largest in the North Pacific. It is divided about equally into a wide shelf and a deep ba-sin with a maximum depth of 5121 m. The average water depth of the 500 km wide shelf is less than 50 m with a shelf break located at 100–200 m water depth. The shelf area is covered by ice from November to May. The Bering Strait is about 85 km wide and less than 50 m deep. This is the only northern gateway where water of the Pacific origin flows into the Atlantic through the Arctic Sea, and has one of the highest biological productivities in the world (Walsh et al., 1990). Despite of its shallow depth,
however, the Bering Sea transports 0.8 Sv (106 m3 sec–1) of seawater to the Arctic Ocean to account for 19% of the DOC found there (Wheeler et al., 1997). Takahashi (1999) went even further and claimed that “... Much of the bio-logical production of organic matter and associated nu-trients flowing into the Arctic Ocean today is due to this northerly current direction”.
The Bering Sea is relatively nutrient rich compared to the open oceans and the PP, even in the deep basin, is almost twice of that found in the Gulf of Alaska immedi-ately south of the Aleutian Islands. The diatom fluxes are approximately one order of magnitude higher in the Bering Sea than in the Gulf of Alaska although the rela-tively minor CaCO3 fluxes are similar on either side of the Aleutian Islands (Tsunogai et al., 1979; Takahashi, 1995; Takahashi et al., 2002). The shelf water has a pCO2 of about 100 µatm below saturation in winter, mainly because of the cooling effect. Nevertheless the rate of air-sea exchange is probably low because of the air-sea ice cov-erage. On the other hand, near the shelf break the pCO2 is supersaturated because of vertical mixing (Chen, 1993a). In summer, however, the shelf area is highly understurated with pCO2 as low as 125 µatm because of high productivity, especially those from siliceous shell-bearing plankton (Codispoti et al., 1986; Takahashi, 1999). The PP on the shelf is on the order of 14 mol C m–2yr–1, supported by nutrients from influxes of subsur-face waters from offshore (Fig. 1). The f ratio is 49% on the outer shelf and 17% at mid-shelf (Walsh et al., 1985; Walsh and McRoy, 1986; Walsh and Dieterle, 1994; Wollast, 1998). DMS and N2O have a concentration of about 1.6 nmol S and 313 µatm, respectively, in the sur-face water (Nojiri et al., 1997; Uzuka et al., 1997). Aranami et al. (2002) reported a sea-to-air DMS flux of 4.1 mmol m–2yr–1.
Walsh and Dieterle (1994) calculated a mean inva-sion rate of 4.3 mol C m–2yr–1 on shelves of the Bering
Fig. 4. Penetration depth of excess CO2 in the Bering Sea
Sea. These are converted to DIC, DOC and POC, and are transported to the deep basin. They suggested that, as a consequence of the rising levels of atmospheric CO2 since the Industrial Revolution, the biophysical CO2 status of the southeastern shelf may have switched over the last 250 years, from a prior source to the present sink. Chen (1993a) reported that the excess CO2 in the Bering Sea penetrates to approximately 1000 m. This is the depth where the excess CO2 is at about its detection limit of 5 µmol kg–1. Some excess CO
2 may be present below this depth. The penetration is deeper in the eastern and south-ern regions, with slightly shallower penetration off the Kamchatka Peninsula (Fig. 4). Tritium and freons show similar penetration, but the 14C concentration does not level off until a slightly deeper depth (Chen, 1993a; Warner and Roden, 1995). The Bering Sea contains about 0.21 (±0.05) Gt excess carbon around 1980. Although this value is small, export of the dichothermal water (Miura
et al., 2002) through the Kamchatka Strait could feed the
NPIW with excess CO2. Further, the carbonate deposits on the vast Bering and Okhotsk shelves could provide a large sink for excess CO2 in the near future. The shelf waters are currently about 210 and 150% saturated with respect to calcite and aragonite, respectively. Because of the shallow depth of the shelves (less than 200 m) rela-tive to the saturation horizons of calcite (400 m) and aragonite (350 m), the upward migration of these satura-tion horizons due to the excess CO2 input (Feely and Chen, 1982; Sharma et al., 1999) probably has not changed the
dissolution rates of carbonates.
An increase of approximately 200 µatm in pCO2, however, would make the shelf water undersaturated with respect to aragonite and high-magnesium calcite, which would then dissolve and neutralize the excess CO2. A doubling of the current CO2 level in the atmosphere by the later part of the next century would cause the calcites on the shelves to dissolve, providing another large sink for CO2 (Chen, 1993a).
3.3 The Okhotsk Sea
The Okhotsk Sea is the sixth largest marginal sea in the world and the third largest in the North Pacific and has a maximum depth of 3475 m. It is enclosed on three sides by land and the shelves occupy 40% of the surface area. Although this sea is geographically located at a tem-perate latitude, it has many characteristics of a polar ocean, namely, large seasonal variations in water tempera-tures and a subarctic water column structure. It also has a seasonal ice cover from December through April with a thickness of about 1 m and an areal coverage comparable to that of the Bering Sea. It is connected to the open North Pacific through the Kuril Island chain. The two most im-portant passages are Bussol’ (2300 m sill depth) and Kruzenstern (1900 m sill depth) Straits. The net exchange between the open North Pacific and the Okhotsk Sea is on the order of 3–5 Sv (Talley, 1996). The Okhotsk Sea is connected to the JES by two narrow, shallow straits: the Soya (La Perouse) Strait between Sakhalin and Hokkaido
with a sill depth of 40 m, and Tatar Strait between Sakhalin and the Eurasian continent with a sill depth of 10 m. At northwestern shelf region, the Amur River, one of the larg-est rivers in the world, supplies freshwater, heat (Ogi et
al., 2001), nutrients, and organic matters (Nakatsuka et al., 2003) into the Okhotsk Sea.
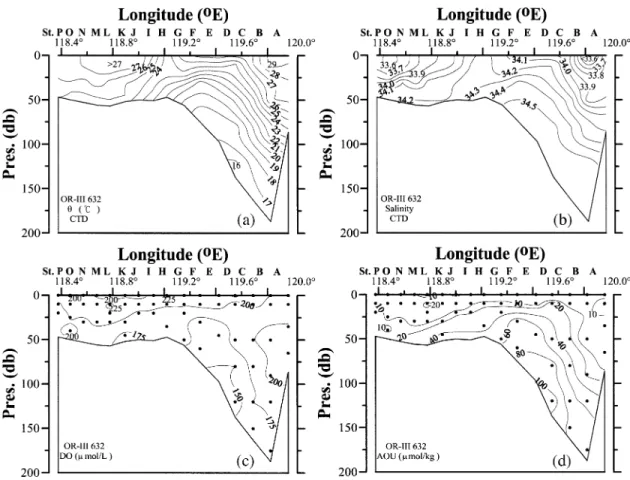
Within the Okhotsk Sea, the flow is basically cy-clonic. Local circulation features include the northern shelf region where coastal polynyas are often found; upwelling on the Kashevarov Bank; the Soya Current which transports saline JES water into the Okhotsk Sea, and; an anticyclonic eddy field in the Kuril Basin. The cold, fresh but dense Okhotsk Sea Intermediate Water (OSIW) is believed to be an important source of the North Pacific Intermediate Water (NPIW) (Wakatsuchi and Martin, 1991; Talley and Nagata, 1995; Watanabe and Wakatsuchi, 1998). Because of the influence of the north-west Pacific water there is a maximum in potential tem-perature (θ) at about 900 m in the deep basin, which is deeper and colder than the θmax found in the northwest Pacific. There is a weak θmin immediately beneath the surface layer, representing the remnant winter water. There is an apparent oxygen utilization (AOU) and nor-malized total CO2 (NTCO2 = TCO2 × 35/S) maximum but pH minimum in both the Okhotsk Sea and the north-west Pacific. The AOU and NTCO2 values are lower be-tween about 200 m and the θmax layer, but higher above 200 m or near bottom in the Okhotsk Sea. This is a clear indication that the Okhotsk Sea has younger waters be-tween 200 m and the θmax layer but older water near bot-tom as compared to the open ocean outside. Above 200 m AOU and NTCO2 values are higher but pH is lower in the Okhotsk Sea. These features remain unchanged at least since the 1950’s when data became available although inter-decadal variability has been reported (Andreev and Kusakabe, 2001).
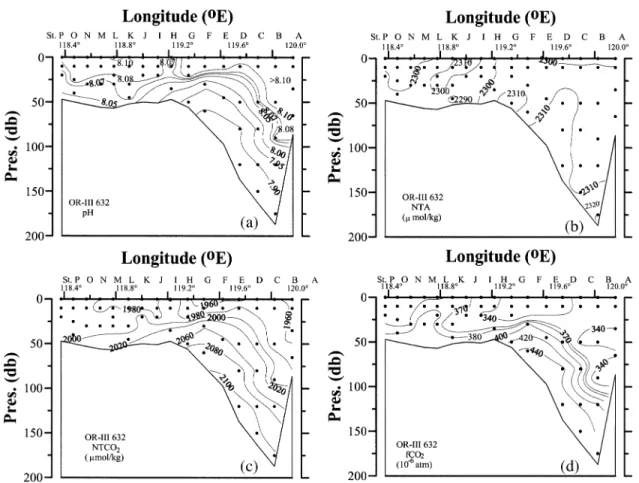
The normalized TA (NTA = TA × 35/S) data seem to show a systematic offset between the typical Okhotsk Sea and the northwest Pacific stations. Both, however, show a large increase below about 300 m, which is already deeper than the saturation depth for aragonite and cal-cite. The surface water is generally below saturation for pCO2 except near the Kashevarou Bank and the Kuril straits where tidal mixing is strong (Rogachev et al., 1997). In summer, the undersaturation of surface waters with pCO2 between –20 and –90 µatm is commonly ob-served, while the recorded values range between –170 µatm understurated to 50 µatm supersaturated. The low-est undersaturation of CO2 is measured along the eastern coast of Sakhalin and northern shelf area. These undersaturations are attributed to enhanced phytoplankton productivity. From May to September a mean invasion rate is 1–2 mol C m–2yr–1 (Biebow and Hutten, 1999; Biebow et al., 2000). In winter, the rate of air-sea
ex-change is low because of the sea ice coverage. The sur-face waters of the ice-free zone of the Kuril Basin have a pCO2 of about 10–40 µatm below saturation mainly be-cause of the strong salinity stratification and the cooling effect. On the other hand, near the Bussol’ Strait the sur-face water are supersaturated with pCO2 (20–80 µatm) because of vertical mixing in the strait and winter con-vection (unpublished data, R/V Dmitry Peskov March 2003 cruise).
The excess CO2 penetrates to at least 1000 m (σθ = 27.35–27.5; Chen and Tsunogai, 1998; Andreev et al., 1999). Wong et al. (1998) recently reported that CFCs are found in the OSIW (ranging from σθ = 26.8 to 27.4) which feeds the NPIW where high values of dissolved oxygen (DO), tritium, CFCs (Fig. 5) and excess CO2 are detected in the σθ = 26.6 to 27.2 range (Tsunogai et al., 1995). The OSIW outflow is about 6 Sv (Takahashi, 1999; Yamamoto et al., 2003). Wong et al. (1998) gave 2.7– 23.3 Sv with most of the transport occurring above σθ = 27.0. Multiplying these fluxes by the excess CO2 con-centration gives the excess CO2 export of 0.011–0.18 Gt C yr–1 to the North Pacific. Recently Chen and Tsunogai (1998) reported an inventory of 0.18 ± 0.08 Gt excess carbon in the Okhotsk Sea. This inventory is by itself not large but the export is significant. The CFC12 data (Fig. 6) indicates that the upper water is indeed mixed into the deeper layer diapycnally. Since the CFCs of the North Pacific water are very low below 300 m (Fig. 6), the outflowing CFC-rich OSIW transports CFCs and excess CO2 to the interior of the North Pacific.
The nutrient and DIC budgets for the Okhotsk Sea are determined by the water exchange with the Pacific Ocean, Amur river run off and the supply of low-nutrient
30 40 50 60 70 25 25 25 30 30 30 30 30 35 35 35 35 35 35 40 40 40 40 45 45 45 45 50
Ocean Data View
135E 140E 145E 150E 155E
45N 50N 55N 60N
Ocean Data View
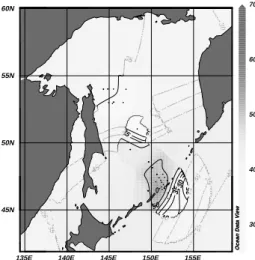
Fig. 6. Distribution of pCFC-12 on the potential density
sur-face of 27.4σθ in the southern Okhotsk Sea (cited from
Soya Current water. The fresh water supply to the Okhotsk Sea is ~0.026 Sv (Aota and Ishikawa, 1991) as excess precipitation and river run off over evaporation. Thirty seven % of the fresh water transport to the Okhotsk Sea is from the Amur River. The computed salt, nutrient and carbon budgets for the Okhotsk Sea are provided in Ta-ble 2. In the budget calculation differences in salinity, DIN, DIP and DIC between the subarctic Pacific and the Kuril Basin of the Okhotsk Sea (Fig. 7) averaged in the water column between 26.7–27.5σθ was used (Andreev
et al., 2002). The spatially averaged concentration of the
organic P, N and C in the upper sediment are respectively 0.06%, 0.12% and 1.2% (Bruevich, 1956; Bezrukov, 1960). Taking a mean sedimentation rate to be 0.01 cm yr–1 (Biebow and Hutten, 1999; Biebow et al., 2000) an-nually ~8 × 10¹⁰ mole C, 0.6 × 10¹⁰ mole N and 0.15 × 10¹⁰ mole P are converted into sediments. It is clear that the major contributor of P, N and C in the dissolved inor-ganic form is the Pacific Ocean. Annually, the Okhotsk Sea obtains ~0.04 × 10¹² mol P, 1.0 × 10¹² mol N and 4 × 10¹² mol of DIC from the subarctic Pacific. As for P and N, the riverine input is only about 2–3% of the total in-flux, much smaller than the contribution from the incom-ing water masses.
The residual flux of DIN (Table 2) is 0.4 ± 0.2 × 10¹² mol yr–1, which is taken to be the sedimentary denitrificaton rate. As the result of denitrification there is a significant decrease in N* ([NO3] + [NO2] – 16 × [PO4]) on the shelf (Gruber and Sarmiento, 1997) and
Derygin Basin. In the northern and western parts of the Okhotsk Sea N* decreases from –2 µmol–1kg–1 to –15 µmol–1kg–1 (Fig. 8). Data collected during the German-Russian project KOMEX (Kurilen-Ochotskishes Meer Experiment) (Biebow and Hutten, 1999; Biebow et al., 2000) show that in the surface sediments the DIN/DIP ratio decreases from 10–15 to 3 due to denitrification. This is equivalent to a spatially averaged denitrification rate of 0.26 ± 0.13 mol N m–2yr–1.
Strong winds coupled with intensive vertical mixing and inter-leaving in the winter enhance the oceanic pen-etration of excess CO2 in the Bering and Okhotsk Seas. Although these seas have a limited capacity to store the excess CO2, they act as a conveyer belt. That is, the dense shelf water formed in winter (0.5–0.9 Sv; Wong et al., 1998; Yamamoto et al., 2003) flows out to the deep ba-sins and enters the intermediate layer. The outflowing water from the highly biologically-productive shelves contains large amounts of DOC and POC (Nakatsuka et
al., 2002, 2003) and is laden with excess CO2. At the re-gion off the east coast of Sakhalin Island, the lateral ex-port of DOC and POC by the dense shelf water are much larger than the sinking POC flux from in-situ surface water (Nakatsuka et al., 2003). In the Okhotsk Sea, it seems that the DOC and POC accumulated in the shelf water are transported out of the shelf without significant removal at the shelf edge.
In addition to dense shelf water outflow, the water from the JES also imports excess CO2 into the
intermedi-Table 2. Salt, dissolved inorganic phosphorus (DIP), nitrogen (DIN), and carbon (DIC) budgets for the Okhotsk Sea (OS).
*Residual fluxes are calculated taking the water transport rate between the Okhotsk Sea and the subarctic Pacific to be 5 Sv (Talley, 1996).
20 ± 3 kg of salt, 0.04 ± 0.01 mole, 1.0 ± 0.1 mole and 4 ± 0.7 mole (1012, yr–1) are the accepted fluxes of, respectively, salt,
ate layer of the Okhotsk Sea. The water, called the Fore-runner of Soya Warm Current water from JES, has a den-sity of more than 26.8σθ in spring due to its high salinity and winter cooling, and can sink into the intermediate layer. It contains excess CO2 absorbed during its north-ward flow. According to Otsuki et al. (2003), CO2 flux transported to the intermediate layer by this water is about one tenth of that by dense shelf water. Subsequently, the intermediate water transports excess CO2 to the North Pacific Ocean (Chen, 1993b).
Further, these areas may have shown signs of cli-matic change. The warm Kamchatka Current intermedi-ate wintermedi-ater has warmed during the last decade while the upper layer in the Oyashio and the Okhotsk Sea has cooled and become fresher (Rogachev, 2000). Andreev and Kusakabe (2001) also demonstrated that the DO concen-trations in the intermediate waters of the Okhotsk Sea and the western Subarctic Gyre have decreased since the 1950s. Since the residence time of the intermediate water of the Okhotsk Sea is only several years (Yamamoto et
al., 2001, 2003), the inter-annual variability of the
for-mation rate or properties of the Okhotsk Sea Intermedi-ate WIntermedi-ater may directly affect the outflowing wIntermedi-ater which enters to the NPIW.
3.4 Japan/East Sea
The JES is the eighth largest marginal sea in the world and the fourth largest in the North Pacific. The average depth is 1667 m but the three basins, namely the Japan, Yamato and Ulleung Basins exceed 2500 m. The
maximum depth is 4036 m. The shelves are generally narrow except in the far north and far south. While the subsurface waters are characterized by the unique homo-geneity, called Japan/East Sea Proper Water (Uda, 1934), studies in recent years confirm that subsurface waters display small but distinctive oceanic characteristics with several water masses (Gamo and Horibe, 1983; Kim and Kim, 1996; Kim et al., 2001). Numerous results of hy-drological measurements show anomalously high concen-tration of dissolved oxygen, suggesting rapid turn over of the subsurface waters: tracer studies have shown that the turnover time of JES deep waters is on the order of 100 years (Watanabe et al., 1991; Chen et al., 1995a; Kim
et al., 1999). The mean inflow and source of N (1 × 10¹² mol N yr–1) is through the Tsushima/Korea Strait with an annual mean transport of 2–2.5 Sv (Yanagi, 2002; Lyu and Kim, 2003). The Tsushima current is a branch of Kuroshio and the transport is strong in summer and fall. About 80% of the inflow leaves the JES and enters the North Pacific through the Tsugaru Strait with a sill depth of 130 m. The rest flows into the Okhotsk Sea through the Soya Strait which is only 40 m deep. There is negligi-ble flow into the Okhotsk Sea through the 10 m-deep Tar-tar Strait.
The pCO2 studies of JES surface waters show super-saturation in summer and undersuper-saturation in winter with an annual air to sea invasion of 0.045 Gt C (Oh et al., 1999; Kang and Kim, 2003). This influx rate of 3.7 mol m–2yr–1 is more than twice the global average. With its rapid turn over time, the entire JES has been penetrated by excess CO2, totaling 0.31 ± 0.05 Gt C in 1992 (Chen
et al., 1995a; Kang, 1999). The ratio of CaCO3 dissolu-tion and the organic carbon decomposidissolu-tion vary from 0.05 at 300 m to about 0.17 below 2000 m. These values are
Fig. 7. Difference in salinity (·200) (×), dissolved inorganic
carbon (µmol kg–1) (䉭), DIN (·4, µmol kg–1) (䊊), DIP (·100,
µmol kg–1) (䊐) and silicate (∆SiO
4, µmol kg–1) (䉬) between
the Okhotsk Sea (Kuril Basin) and the subarctic Pacific
versus σθ. The errors bars shown are 84% confidence
inter-vals.
Fig. 8. Vertical profiles of ([NO3] + [NO2] – 16[PO4]) µmol
kg–1 and [NH
4] µmol kg–1 in the northwestern Okhotsk Sea
lower than the ratios of 0.14 and 0.36 found in the South and North Pacific, respectively (Chen et al., 1982; Chen, 1990), or 0.54 in the Bering Sea (Chen, 1993a). Diatom and silicoflagellates dominate the phytoplankton (Hong and Chen, 2002). As a result, the vertical gradient of SiO2 is several times that of calcium or alkalinity (Chen et al., 1995a).
Because the straits connecting the JES to the outside are all narrow and shallow, the deep waters have no di-rect exchange with the Pacific, the ECS and Okhotsk Sea. Since the deep waters of the JES are all formed inside the closed basin, they provide an unique opportunity to con-firm the Redfield Ratios based on the mass-balance method (Chen et al., 1996a). The consumption and pro-duction rates of CaCO3, OC, DO and nutrients are given in Table 3. The JES provides, furthermore, another unique environment to study the carbon cycle within the closed basin (Fig. 9; Kang et al., 2001; Kang and Kim, 2003). The estimated primary productions in the warm region and the cold region are 4.95 mol C m–2yr–1 and 5.07 mol C m–2yr–1, respectively (Kang and Kim, 2003). The ex-port production was estimated by the f-ratio of 0.36 in the warm region, obtained by the helium isotope method (Hahm and Kim, 2001).
3.5 South China Sea
The SCS is the largest marginal sea in the world and has an average depth of about 1350 m. The southern and southwestern regions are the shallow Sunda Shelf and the Gulf of Thailand, with an average depth of 50 m. The Sunda Shelf connects to the Indian Ocean through the Strait of Malacca, but the major connection is with the Java Sea through the Karimata and Gelasa Straits which are shallower than 50 m. The northern and northwestern regions are also wide shelves with connection to the ECS through the Taiwan Strait, which is also shallow, averag-ing 50 m-deep. The central and northeastern parts of the SCS are rather deep, over 5500 m at places. The only
deep connections with the outside are the 400 m-deep Mindoro Strait which leads to the Sulu Sea, and the 2200 m-deep Bashi Channel which opens to the Philippine Sea. The seasonally reversing monsoon winds play an impor-tant role in determining the upper ocean circulation. The combination of such variable atmospheric forcing and complex geometry contributes to the complicated dynam-ics of the flow in the SCS. There is no deep or intermedi-ate wintermedi-ater formation in the SCS. In addition, there is strong upwelling. As a result, the excess CO2 does not penetrate more than 1500 m and the entire SCS probably contains 0.43 (±0.1) Gt C anthropogenic carbon in 1994.
Particle fluxes in the SCS appear to be basically con-trolled by monsoon-related processes (Liu et al., 2002). Upwelling phenomena and wind-induced nutrient entrain-ment into the euphotic zone may account for the overall enhanced production of biogenic components in the cen-tral part of the basin. In the northern SCS, however, pro-ductivity is at comparatively low levels probably because of an Ekman-induced downward deflection of the thermocline in winter and reduced wind strengths in sum-mer. Here the seasonal flux signal seems to be related to the latitudinal extension of the monsoonal dust veils, yielding significantly higher lithogenic contributions. In response to the grater availability of mineral ballast, the fluxes of organic matter in the northern SCS are as high as at the central region. Increased carbonate fluxes dur-ing the NE monsoon may be due to a fallout of calcite from the dust plumes (Wiesner et al., 1996a, b).
Wiesner et al. (1996a, b) reported a fallout of vol-canic ash (9012 g m–2) from the 1991 paroxysmal explo-sion of Mount Pinatubo (Philippines) in mid- and deep water in the central SCS. The bulk of the ash arrived in the deep sea within less than 3 days after the release of the major eruption plume which means a subaqueous set-tling velocity of higher than 1670 m d–1. The recovery of the surface water ecosystem from this massive injection was very rapid as compared to the deep sea but probably
Table 3. Consumption or production rates of CaCO3, organic carbon, oxygen and nutrients in the deep North Pacific Marginal
Sea Basins (µmol kg–1yr–1).
was not stimulated by nutrients derived from in situ leach-ing of the ash in the mixed layer because the dissolution of glass is too slow. The amounts of pyroclasts that did remain suspended were also too low to have produced the enhanced flux observed during the post-eruption year. Chen et al. (2001) constructed a simple box model to balance fluxes in and out of the SCS (Fig. 10). Note the SCS exports P through the Bashi Channel because the import of nutrients by the nutrient-poor KSW is not enough to compensate the export by the relatively nutri-ent rich SCS Surface Water (SCSW). In addition, the outflowing intermediate water, with essentially all its P supplied by the deep water, turns northward after leaving the Bashi Channel. Subsequently this water upwells onto the ECS, providing P to the shelf water which is short of P relative to N. As stated before, rivers play only a rela-tively smaller role in sustaining the high productivity in the ECS. It is still not possible to separate the effects of nitrogen fixation (Wong, 2002) from denitrification but there is a net denitrification in both seasons, totaling 0.042 mol N m–2yr–1. This figure is smaller than that found in the ECS. Similar to P, the SCS exports a large amount of N through the Bashi Channel, both in the SCSW and in the intermediate water.
It is important to note that, similar to the ECS, the rivers flowing into the SCS have a very low phosphorus content. The DIN/DIP ratio is 86 which is far higher than the Redfield ratio of 16. On the other hand, the influx of seawater through the Sunda Shelf (only in the wet sea-son), and the year-round upwelling and inflow through the Bashi Channel and the Mindoro Strait bring in
seawater with a DIN/DIP lower than the Redfield ratio. These incoming seawater masses contribute the most to the productivity in the SCS. Although upwelling does occur in the SCS (Shaw et al., 1996; Chao et al., 1996a, b), in the dry season the intermediate water transports more N and P out of the SCS than the deep water brings in. The excess can only come from the decomposition of sinking organic particles.
The net burial of biogenic silica is taken as the re-sidual, and is 156 and 132 × 109 mol for 6 month for the wet and dry seasons, respectively. These fluxes are small as only the siliceous particles produced from dissolved Si in the SCS are taken into account. Aeolian dust parti-cles and suspended partiparti-cles, such as sand, transported by rivers are not included. Note the SCSW transport about 1 × 10¹² mol Si a year out of the SCS which is several times the riverine input. Much of this excess comes from upwelling of deep waters. Since there are no data avail-able, organic nutrients are not considered in the above calculations.
Chen et al. (2001) calculated the decomposition and dissolution rates of particles based on the mass-balance method. The rates of increase are as follows: 0.59 ± 0.12 (AOU), 0.054 ± 0.016 (nitrate), 0.0035 ± 0.001 (phos-phate) and 0.17 ± 0.05 (silicate), all in µmol kg–1yr–1. The one dimensional advection-diffusion model for wa-ters between about 800 and 3000 m where the θ/S plot is relatively linear results in an oxygen consumption rate of 0.38 ± 0.06 compared to 0.59 ± 0.12 µmol kg–1yr–1 ob-tained based on the mass-balance method. The nitrate, phosphate and silicate production rates obtained by the 1-D model are 0.045 ± 0.01, 0.005 ± 0.002 and 0.26 ± 0.07 µmol kg–1km–1, respectively. These are in reason-able agreement with the mass-balance estimations. These rates are listed in Table 3 and compared to the values in the Bering Sea and the JES. The rates are highest in the JES and lowest in the Bering Sea, the rates in the SCS
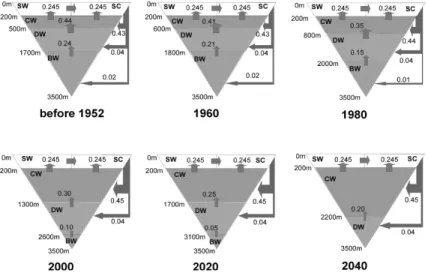
Fig. 9. Carbon cycle in the Japan/East Sea. Numbers denote
the size of the reservoirs and fluxes in Gt C and Gt C yr–1,
respectively.
Fig. 10. Schematic diagram for the annual nutrient budgets
(numbers in 109 mol yr–1) in the South China Sea (taken
being intermediate between these two. These differences are caused by the age of the water relative to their sources (Chen et al., 2001).
The saturation horizon of calcite is deeper than 2000 m in the SCS; thus little enhanced dissolution is expected due to the excess CO2 penetration (Chen and Huang, 1995). The saturation horizon of aragonite is 600 m, shal-lower than the excess CO2 penetration depth but deeper than the saturation horizon found in the Bering Sea. The upward migration of the saturation horizon would not affect the calcareous deposits on the SCS shelf to the de-gree that it affects the Bering Sea deposits.
3.6 Sulu Sea
Like most other deep basins in southeast Asia, the deep Sulu Basin is isolated from the neighboring seas by surrounding topography. Therefore, its hydrographic and dynamic characteristics are representative of an isolated deep basin. While the near-surface circulation is mainly governed by the seasonally reversing monsoon winds, the deep circulation is forced by an inflow of intermediate water from the SCS through the Mindoro Strait (sill depth 420 m), which supplies the intermediate and bottom wa-ters of the Sulu Sea (Wyrtki, 1961; Nozaki et al., 1999). Below 1000 m T, S, AOU, PO4, SiO2 and pH in the Sulu Sea are remarkably homogeneous (Fig. 11). Tracer data (Broecker et al., 1986) suggest renewal times of 50–100 yr.
Below the warm and fresh surface layer, the core of the Subtropical Lower Water from the Pacific Ocean can
be seen around 200 m depth as a very distinct salinity maximum. It lies well above the sill depth in the Mindoro Strait and its spreading is thus not hampered by topogra-phy. NPIW is the primary source for the intermediate and deep waters of the Sulu Sea. A low-salinity core originat-ing from this minimum can be traced across the Sulu Sea in the 600-to-1400 m depth layer. It is associated with a relative maximum in oxygen content and a vertically ho-mogeneous silicate concentration. Temperatures here are higher than in the corresponding layer in the SCS, pre-sumably due to tidally induced vertical mixing in the Mindoro Strait.
In the deep-water regime below about 2500 m depth, the vertical and horizontal gradients of the hydrographic properties are small. There is a tendency for the deep water in the northern Sulu Sea to be slightly fresher and warmer and to have higher oxygen content compared to the deep water in the south. The high temperature, low salinity, and high oxygen contents are indicative of an intrusion of NPIW in the deep northern Sulu Sea. Deep plume con-vection down the continental slope is likely the genera-tion mechanism. The maximum depth of the renewal de-pends strongly on the density of the water inflowing through the Mindoro Strait. The shallower the thermocline in the SCS, the denser the overflow water and the deeper the convection in the Sulu Sea. A possible mechanism for thermocline uplifting is the passage of tropical cyclones which may be responsible for the intermediate depth in-trusion in the Sulu Sea (Frische and Quadfasel, 1990).
The depth-integrated PP rates in the oceanic region
Fig. 11. Vertical distribution of θ, S, AOU, PO4, SiO2 and pH in the Sulu, South China and West Philippine Seas (Sulu Sea data
of the Sulu Sea (16 mol C m–2yr–1) is higher than the shoal area (14 mol C m–2yr–1), which is higher still than that across the Mindoro Strait (12 mol C m–2yr–1) (San Diego-McGlone et al., 1999). The biological productiv-ity is probably the major factor leading to the low sur-face water pCO2 value of around 250 µatm in summer (calculated based on the pH and TA data of Gamo et al., 1997).
3.7 Californian shelf and Gulf of California
The California shelves are quite narrow and have a maximum width of about 20 km. The shelf break is lo-cated at 100–200 m water depth and is intersected by can-yons. Local rivers supply 80% of the total sediment input (Eittreim et al., 2002) but there is little recent sedimenta-tion, and sediments on the shelf are largely relic deposits (de Hass, 1997). The Gulf of California shelves are also narrow, usually within 50 km wide on the eastern side and narrower on the western side. In the northern end the shelf reaches 150 km wide.
Like the Red Sea (Chen and Wu, 1991) the Gulf of California is a large evaporation basin because of the high aridity (Alvarez-Borrego, 1983). It is about 1000 km long and 150 km wide on the average, and has an area of 0.16 × 10⁶ km2 with an average depth of 813 m. The Colo-rado River used to be a major source of fresh water to the Gulf but there has been essentially no river water input except during the winter raining season due to the con-struction of dams. Because of the arid climate the salin-ity of the Gulf increases from below 35 in the south, to 35 in the northern gulf, and to about 37 in the Colorado River estuary. Strong tidal mixing (9 m tidal range in the northern gulf) generated upwelling which brings cool, less saline, low pH and very low oxygen but high TCO2 and nutrient-rich North Pacific Intermediate Water (>500 m) to the euphotic zone in the region of the Midrift Islands. The percent saturation of CaCO3 with respect to calcite and aragonite decreases with depth rapidly to undersaturation at about 300 and 70 m, respectively, in the central and southern regions of the Gulf (Alvarez-Borrego, 1983). Despite of the relatively high primary productivity, on the order of 30 mol C m–2yr–1, the sur-face pCO2 becomes 30 to 40 µatm supersaturated at the southern end of the Gulf and at times may become al-most 200 µatm supersaturated near the Midrift islands (Alvarez-Borrego and Lara-Lara, 1991; Hidalgo-Gonzalez
et al., 1997; Zirino et al., 1997). Because of strong
upwelling, excess CO2 penetrates to no more than 500 m and the Gulf of California contains only 0.015 ± 0.005 Gt of excess carbon.
Primary productivity on the California shelves show large seasonal and interannual variations. Sediments and organic matter are deposited on the slopes and fans of the continental borderland basins, notably the Santa Barbara
Basin where multiple blooms occur. Most of the organic matter is mineralized in the water column and the upper layer of the sediments. Organic matter consists of 25% terrigenous input and the concentrations in the sediments vary between 4 and 6% (Kemp, 1995; de Haas, 1997; de Hass et al., 2002). Only less than 2% of the PP reaches the seabed below 500 m and less than 1% is accumulated on the slope (Reimers et al., 1992; Pilskaln et al., 1996). On an annual to decadal scale, the dominant cause of variability in productivity is the El Niño-Southern Oscil-lation event (ENSO). The net effect of ENSO is to move warmer water onshore and reduce the strength of upwelling, hence nutrient supply. This has been docu-mented for the 1982–83 ENSO when cold water diatom flux in the Santa Barbara Basin decreased relative to non-ENSO years and warm water diatoms, radiolarians and foraminifera were recorded in the laminated sediments. Decadal to millennial cycles of bioturbation and preser-vation of laminated sediments driven by variation in oxy-gen minimum zone intensity has been ascribed to solar cycles affecting the longer-term alternation of El Niño and La Niña. However, no regular cyclicity in productiv-ity was identified in the laminated, diatomaceous sediments (Kemp, 1995). This is because surface nutri-ent concnutri-entrations and productivity remain high during an ENSO event due to strong upwelling and mixing asso-ciated with the tides (Alvarez-Borrego and Lara-Lara, 1991). Only about 4% of the silica deposited is supplied by rivers, with the rest coming from upwelling (Alvarez-Borrego, 1983). Smoak et al. (1999) detected more effi-cient scavenging during an ENSO winter.
3.8 Northwestern American shelf
The Northwestern American shelf is 25–60 km wide with the shelf break located at 150–200 m water depth. Several canyons intersect the shelf. North wind from May to September results in coastal upwelling in a narrow band whereas from October to April south wind results in downwelling. Local rivers discharge about 2.5 × 10¹¹ m3 of water per year, peaking in June. The Columbia River discharges about 17 × 106 tons of sediments and 0.6 × 10⁶ tons of terrigenous carbon per year. Of the latter about 80% is DOC and the remainder is POC (de Hass, 1997; Hill and Wheeler, 2002). When downwelling occurs the PP is smaller than 15 mol C m–2yr–1. In summer when upwelling occurs the PP is larger than 92 mol m–2yr–1. Total PP is about 54 mol C m–2yr–1. Most of the produced OC on the shelf is consumed before it reaches the sea floor (de Haas, 1997). The DMS concentration is about 4.1 nmol S (Uzuka et al., 1997).
Most of the particulate load of the Columbia River is deposited on the Washington shelf. Only a very small amount is deposited on the Oregon shelf. The accumula-tion rates on the Washington shelf range from 2.5–7.5 kg
m–2yr–1. Organic carbon concentrations on the shelf range from below 0.5% to above 1%, and the accumulation rates average 0.3 mol C m–2yr–1. On the slope and in the can-yons the average OC accumulation rates are, respectively, 1.2 and 5.3 mol m–2yr–1. About 25% of the preserved OC is of terrigenous origin. It has been reported above that canyons are major conduits of offshore transport of sediments in the ECS. It is also true here that most of the organic matter introducted onto the shelf is not stored locally, but is burried on the slope, in the canyons and on the abyssal plain (de Haas, 1997). The narrow shelves off the eastern coast of Japan also see the lithogenic par-ticles transported to the open ocean rapidly (Noriki et al., 1997).
3.9 Western Canadian shelf
The large (0.1 × 10⁶ km2) western Canadian shelf is relatively narrow (10–120 km wide) intersected by deep glacial channels. During autumn and winter general flow is down wind with strong storm mixing. During summer the flow over the shelf is dominated by eddies. Almost all the material supplied by rivers is deposited in the fjords, bays and straits before it can reach the shelf. As a result, the surface sediments on the shelf is mostly relic. The PP is moderate, at 12.5–16.7 mol C m–2yr–1. Organic carbon thus produced is the major source of OC on the shelf. Most of the OC, however, is mineralized in the water column or is exported offshore (de Haas, 1997).
4. Teleconnection between the East and South China Seas
The Taiwan Strait connects the East and South China Seas. The SCS is rather deep but because of its shallow depth, averaging only 50 m with no deep channels, the Strait does not permit exchange of waters between these two seas except for low-nutrient near-surface waters. In summer, the water flows northward through the Strait but, in winter, there is a southward flowing current along the coast of Fujien Province on the western side of the Strait. On the other hand, the Kuroshio feeds the SCS year-round. The nutrient-depleted near-surface Kuroshio wa-ter exchanges freely with the SCS all year. However, the nutrient-rich intermediate water, arbitrarily taken as the layer between 350 and 1350 m encompassing the core of the salinity minimum (Smin), seems only to flow out of SCS and forms the western portion of the Kuroshio (Chen and Huang, 1996). The core of the outflowing SCS Smin layer is at about 600 m, roughly 200 m shallower than the Smin core of the eastern part of the Kuroshio origi-nated from the west Philippine Sea. As a result, the now northward flowing SCS intermediate water is able to cross the ridge northeast of Taiwan to enter the Okinawa Trough, which is adjacent to the ECS continental shelf.
The KIW contributes up to 30% in the upwelling and
cross-shelf mixing at the East China Sea shelf break. The upwelled KIW actually originates from the SCS and is high in nutrients, thus contributing a great deal of nutri-ents to the shelf as compared with the much smaller riverine fluxes. Furthermore, P flux from the Changjing River could be identified only in the estuary. The N flux extends further but could still be identified only in the Yangtze River Plume. This suggests that the new produc-tivity in much of the ECS is influenced by the upwelled subsurface Kuroshio water. Any potential change in the upwelling rate would thus have a much larger effect than the change in the nutrient input from rivers (Chen and Wang, 1998).
5. Initial Synthesis
Almost without exception, the observational data and budget calculations for the North Pacific continental shelves suggest that although a small fraction of carbon is exported across the shelf-slope break, the principal fate of carbon produced on shelf is, in fact, oxidation on the shelf. Similar results have been reported for the North Sea and the Atlantic Bight. Upwelling seems to support most of the nutrient needed to support the new produc-tion and denitrificaproduc-tion. Even for bays with relatively large riverine input the riverine loading seems to support only a small percentage of new production (e.g. Yoshimura and Kudo, 2003). As a result, when upwelling is reduced new production is reduced as well (e.g. Kudela and Chavez, 2002).
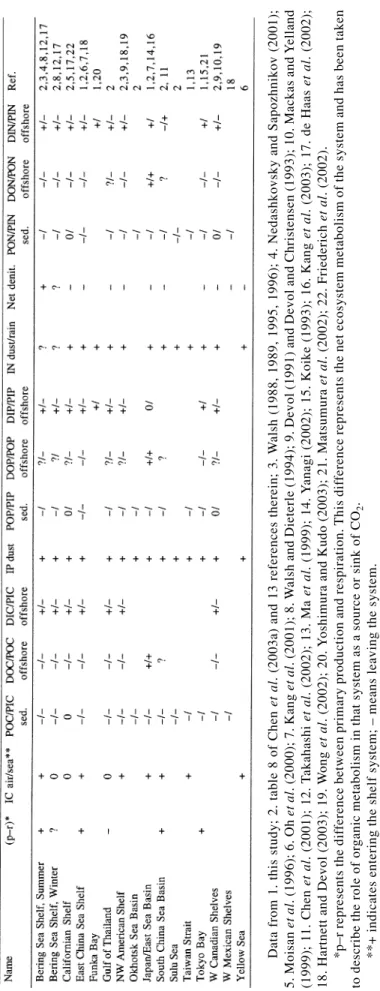
Table 4 summarizes the systems studied to exemplify similarities and differences in terms of the general typol-ogy characteristics explored. These include allocating systems on the basis of positive or negative estimates for a number of processes and fluxes, where the sign is taken as gains (+) or losses (–) with respect to the shelf, where p is production, r is respiration, Net denit. is denitrification minus nitrogen fixation. Smith and Mackenzie (1987) noted that the oceans are a net heterotropic system, that is, (p–r) is negative. (p–r), however, is rarely measured systematically on a cruise and is usually calculated based on the phosphorus budget (Smith and Hollibaugh, 1993; LOICZ, 1997). Most results indicate that (p–r) is posi-tive, that is, most continental margins in the North Pa-cific are exporting organic carbon because production is higher than respiration. Noteworthy is that even the To-kyo Bay, which receives much terrestrial input, is still a net exporter of organic matter because of the high PP (Matsumura et al., 2002).
As for the air-sea exchange of CO2, Table 4 indi-cates that most regions are absorbing CO2 from the at-mosphere or are nearly at equilibrium. As expected, most regions export particulate C, N and P to the sediments. Dissolved and particulate organic matter, as well as particulate inorganic matter are also transported offshore

![Fig. 8. Vertical profiles of ([NO 3 ] + [NO 2 ] – 16[PO 4 ]) µ mol kg –1 and [NH 4 ] µmol kg –1 in the northwestern Okhotsk Sea and Pacific.](https://thumb-ap.123doks.com/thumbv2/9libinfo/8772969.212802/18.892.485.783.102.359/fig-vertical-profiles-µmol-northwestern-okhotsk-sea-pacific.webp)