Socio-Economic Changes in the
Transition to an Information Economy:
The Influence of Informationalization on Occupations,
Employment, and Wage Structure in Taiwan
1Wei-Ching Wang
Department of Radio, TV, Film
The University of Texas at Austin, USA
[email protected]
Abstract
The purpose of this research is to investigate the likely changes in occupations, employment, and wage structure in the transition to an information economy in newly industrialized countries (NICs) such as Taiwan. This paper answers two broad questions in relation to the influence of informationalization in Taiwan’s economic society. First, to what extent has Taiwan made the transition to an information economy? And secondly, what changes have occurred in occupations, employment trends, and wage structure in Taiwan during this transition?
Keywords: Information Economy, Informationalization, Employment, Occupation, Wage Structure
[收稿]2007/08/28; [初審] 2007/12/03; [接受刊登] 2007/12/23
1
This paper was presented at International Communication Association’s 57th Annual Conference in San Francisco, CA
Introduction
NICs like Taiwan have been heavily investing in the deployment of information and communication technologies (ICTs) and informationalization for over two decades; however, there have been very few systematic studies examining whether countries like Taiwan have transitioned from an industrial to an information economy and what changes this transition has brought about in the labor market. This paper investigates two broad questions in relation to the influence of informationalization in Taiwan’s economic society: first, to what extent has Taiwan made the transition to an information economy; and second, what changes have occurred in occupations, employment trends, and wage structure in Taiwan during this transition?
Measuring the Information Economy in Taiwan
Beginning with the work of Fritz Machlup (1962), considerable research has measured how developed countries have made the transition to information economies (for example, Porat, 1977; Bell 1980; OECD 1981). However, very little research has focused on newly industrialized economies, such as that of Taiwan (Dordick & Wang, 1993; Katz, 1988). A major intent of the study is to determine the extent to which an NIC such as Taiwan has made the transition to an information economy, even as the process of transitioning to a fully developed information economy is ongoing. This paper begins with a discussion of three measures found in the literature that provide significant indications of the informationalization of an economy (for a full review of various measures used to measure the extent of informationalization in the economy see Dordick and Wang, 1993), and relates them to Taiwan’s economic changes and status. These measures are, first, the penetration of information and communication technologies in the
economy; second, changes in the sectoral composition of the economy; and third, the extent of the adoption of information technology in the labor force. Having examined the state of informationalization of the economy, the paper then examines three key areas in which the impact of informationalization in Taiwan can potentially be seen: first, changes in wage structure; second, trends in employment and unemployment; and third, changes in occupation structures.
1. Penetration of ICTs in the Economy
There is little doubt that Taiwan’s economy has experienced rapid and extensive informationalization over the past two decades (Wang, 1999; Zhang & Wang, 1994). According to the 2007 Information Technology Industry Competitiveness Index of the Economist Intelligence Unit (EIU),
Taiwan’s overall scores rank it 6th in the whole world. Its IT labor
productivity ranks 1st, IT research and development environment, 3rd; IT
human capital, 7th; broadband penetration, 8th; and governmental support for
IT industry development, 18th. Another important indicator, the World
Economic Forum’s Networked Readiness Index 2007, ranks Taiwan 13th in
the world, one place behind Hong Kong but one place before Japan, and
three places before Germany. Similarly, on the International
Telecommunication Union’s (ITU) “Digital Opportunity Index” (DOI) in
2005, Taiwan ranked 6th in the world; and in ITU’s 2004 “Digital Access
Index” (DAI), Taiwan ranked 9th. Taiwan scores high across the board on all
measures of the deployment of ICTs according to the ITU data. Taiwan’s global rankings for ICT service penetration rate in 2003 were as follows:
mobile telephony, 2nd; Internet access, 5th; broadband access, 5th; and local
telephony, 17th. Taiwan places in the top two or three NICs for the extent
of informationalization and compares very favorably to even high income countries. Taiwan’s penetration rates of mobile, Internet, broadband, and
local phone services are all higher than the averages for high income countries. In 2003, Taiwan had a mobile telephony penetration rate of 110.99%, as compared to the average for all high income countries, which was 71.03%. The comparable numbers for the other categories were as follows: Internet access, 34.56% and 24.51%; broadband access, 13.35% and 8.80%; and local telephony, 59.08% and 56.36%.
The informationalization process is also widespread and has impacted all business sectors and types of industries in Taiwan. According to data from the government’s Institute for Information Industry and Ministry of Economic Affairs, the production automation rate in all companies was 75% in 2006, and the use of computers in all business sectors was 93.50% in 2004 (Appendix, Tables 1.1-1.5). In manufacturing, usage was 93.70%; in finance and insurance, 98.40%; in professional, scientific and technical services, 97.40%; in transportation, storage and communication, 91.1%; and in trade, 92.5%. The average percentage of Internet use in all sectors was 81.10% in 2004. In manufacturing, Internet use was 79.10%; in finance and insurance, 96.70%; in professional, scientific and technical services, 92.50%; in transportation, storage and communication, 74.80%; and in trade, 78.90%. An analysis of corporate level data shows that 86.10% of all companies were connected to the Internet. For large enterprises (more than 30 employees), the connection rate was 96.20%; for mid-size enterprises, 85.60%; and for small enterprises (less than 5 employees), 76.50%. As for company websites, 35.7% of all companies have had their own websites. The percentage among large enterprises has even reached 70%. Furthermore, in 2004, 12.2% of all companies had adopted online purchasing and 7.6% of them provided online selling.
As measured by the penetration of ICTs and by information economy indexes, Taiwan has clearly made the transition to an information economy.
The penetration of ICTs is broad across the economy and deep within most industries and corporations. By many of these measures, Taiwan’s informationalization has outstripped even a number of high income or developed countries.
2. Sectoral Transformations of the Taiwanese Economy
Taiwan’s rise and current dominance in the knowledge/information intensive sector, including both knowledge intensive manufacturing and knowledge intensive service industries has had a significant positive impact on total GDP, which confirms the economic transformation of Taiwan. This paper demonstrates and provides calculations for the percentage of total GDP generated by knowledge intensive industries, labor intensive industries, and capital intensive industries (or others), based on OECD’s (2001)
definition of knowledge-based industries 2 , Ferguson and Galbraith’s
(Ferguson & Galbraith, 2001; Galbraith, 2000) categorization of industries, and the author’s adjustment for Taiwan’s specific situation. The result is shown in Table 1 and Figure 1. The Council for Economic Planning and Development, R.O.C. (CEPD) has also completed similar computations for the percentage of the total GDP contributed by only knowledge-based manufacturing and knowledge-based service industries. The results can be seen in the Appendix, Table 2. There is an inconsistency problem with CEPD’s data because of the problem of the changing definition of “knowledge-based economy” (see Appendix, Table 2), but the overall final percentage of the total GDP generated by knowledge intensive industries is
2
According to the OECD (2001), the knowledge/information-based manufacturing industries include aerospace, computer and data processing equipment, pharmaceuticals, telecommunications, semiconductors, scientific instruments, automobiles, electrical equipment, chemical products, machinery and other transport equipment. As to the knowledge/information-based service industries, they include transport and storage, communication services, finance, insurance and real estate, commercial services, social and personal services.
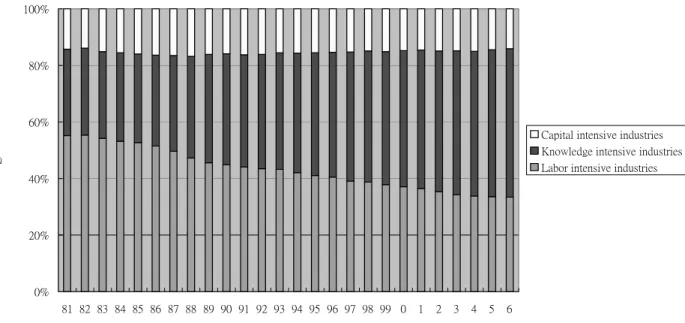
similar to the calculation results in this paper. Table1. Sectoral Percentage of Total GDP
Year Sectoral % 1981 1984 1987 1990 1993 1996 1999 2002 2005 2006 Knowledge-Intensive 30.59 31.28 33.86 39.20 41.20 44.16 47.02 49.76 51.94 52.45 Labor-Intensive 55.15 53.17 49.67 45.56 43.25 40.48 37.87 35.34 33.61 33.42 Capital-Intensive 14.25 15.55 16.47 16.10 15.55 15.36 15.11 14.90 14.45 14.12
Figure 1. Sectoral Transformation of Taiwanese Economy by GDP
0% 20% 40% 60% 80% 100% 81 82 83 84 85 86 87 88 89 90 91 92 93 94 95 96 97 98 99 0 1 2 3 4 5 6 Year Per cen ta ge o f G D P %
Capital intensive industries Knowledge intensive industries Labor intensive industries
Source: The author’s calculations according to the GBAS data
As we can see from Table 1 and Figure 1, in and around 1986 and 1987, labor intensive industries gradually lost their above 50% share of the total GDP, and instead, knowledge intensive industries gradually prevailed, for the first time surpassing labor intensive industries. Knowledge intensive industries became the biggest contributors to the total GDP in 1994 (42.23% vs 42.10%) and that percentage reached over 50% (50.82%) in 2003. In 1986 and before, several important historical developments marked Taiwan’s transition to a knowledge/information intensive economy. First, the
government’s industrial policies shifted from their previous focus on labor intensive manufacturing to knowledge and technique intensive industries, especially stressing information industries (for example, the “Ten Year Plan for Economic Development” and the “Enforcement Rules of the Statute for Upgrading Industries”). Second, the deregulation of some information service industries, such as finance and telecommunication, highly contributed to the growth of the information intensive service industries around this period of time. Third, the government promoted and offered crucial plans to found and encourage research of technologies and the development of knowledge industries (such as the establishing of the Institute for Information Industry, and the policy of the “Ten Year Plan of National Development of Scientific and Technical Development”) and also invited citizens abroad with advanced knowledge and technical skills to return to Taiwan to help develop and expand the information industries (such as the “Program of Nurturing and Recruiting High-Tech Professionals”). Moreover, because labor wages in Taiwan quickly climbed after 1980, the competitive capacity of Taiwan’s labor intensive industries relative to other countries was seriously threatened, which accelerated plant closings or transfers to other Asian countries. This industry change contributed to the advancement of the knowledge intensive sector in the economy after 1986.
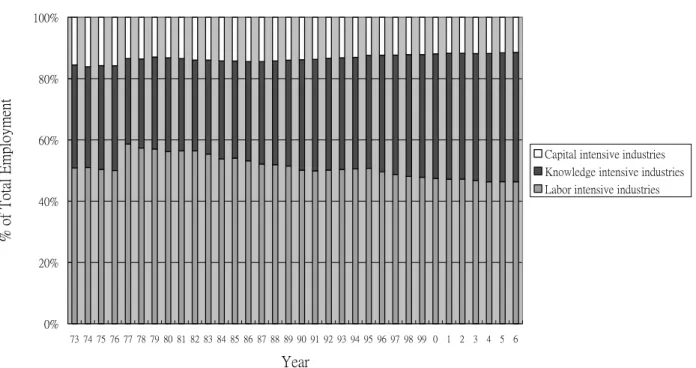
This shift in the composition of the GDP is also mirrored by changes in sectoral employment, with a slight difference. As Figure 2 displays, the number of employees in the knowledge intensive sector, as a percentage of total employment, has continuously and steadily risen, while the corresponding percentage of labor intensive sector employees has continued to decrease since 1988, a time consistent with the sectoral transformation in Taiwan’s economy. Nevertheless, unlike the sectoral transformation in the GDP, the knowledge intensive sector has not claimed the dominant percentage of total employment; rather, the labor intensive sector is still the
biggest contributor to total employment. For example, in 2006, the labor intensive sector counted for 46.33% and the knowledge intensive sector counted for 42.22% of total employment. This phenomenon can be easily explained by the weaker potential of knowledge intensive industries (the information industry for instance) to offer mass employment and to contribute to employment enhancement on the scale that the traditional labor intensive sector did. This difference could cause an unemployment problem, which we will discuss in section (2).
Figure 2. Sectoral Transformation of Taiwanese Economy by Employment
0% 20% 40% 60% 80% 100% 73 74 75 76 77 78 79 80 81 82 83 84 85 86 87 88 89 90 91 92 93 94 95 96 97 98 99 0 1 2 3 4 5 6 Year % of T ot al E m pl oym ent
Capital intensive industries Knowledge intensive industries Labor intensive industries
Source: The author’s calculations according to the GBAS data 3. Informationalization of Labor
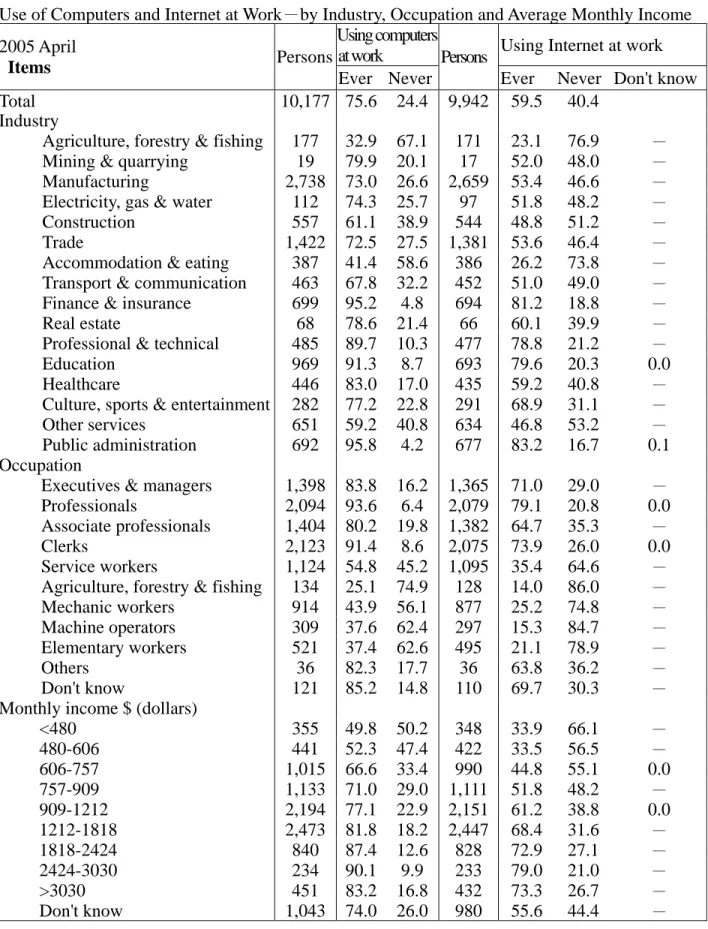
Having considered the scope of ICT use in various sectors of the economy, we now examine the use of ICTs among the labor force; such use is considered to be one of the most important indicators of information economy (OECD, 2004). A look at occupational data shows us the extent of the penetration of ICTs in the labor force. According to a 2005 DGBAS
survey (Appendix, Table 3), the average percentage of workers using computers at work in Taiwan was 75.6%. The highest use rate was for professional workers (93.60%), and the second highest was for clerks (91.40%). Workers in agriculture, forestry, and fishing had the lowest rate (25.10%); while the second lowest rate position was held by elementary workers and machine operators (37.40% and 37.60%, respectively). If we analyze these data by industry, public administration was the highest, with a usage percentage of 95.80%; and finance and insurance was the second, with a rate of 95.20%. The lowest rate was in the field of agriculture, forestry, and fishing, with 32.90%; and the field of accommodation and eating had the second lowest rate, 41.40%. If we analyze computer use rate at work by monthly income, there is a positive correlation between computer use at work and workers’ income (Appendix, Table 3); that is to say, the higher income, the higher the rate of computer use at work. The only exception was the group of the highest income (monthly income > $3030) whose computer use rate (83.20%) was lower than that of the second highest income group (monthly income between $2424 and $3030), whose computer use rate was the highest (90.10%). The lowest use rate was found in the group with the lowest monthly income (< $480), whose average rate was 49.80%.
The rates for Internet use at work were similar to those for general computer use. The average rate of use for all workers was 59.50%. Professional workers and clerks remained the two groups with the highest rate of use (use rate of 79.10% and 73.90%, respectively). Agriculture, forestry, and fishing workers, machine operators, and elementary workers were again the groups with the lowest rate of use (use rate of 14.00%, 15.30%, and 21.10%, respectively). Analyzing data by industry, we can see public administration, finance and insurance, and education are again the three groups with the highest use of the Internet at work, with Internet use rates of 83.20%, 81.20%, and 79.60%, respectively. Additionally, agriculture,
forestry and fishing; and accommodation and eating were again the two groups with the lowest use rates, which were 23.10% and 26.20%, respectively. Analyzing by income, the results for Internet use were identical to those for general computer use: the higher the income, the higher the rate of Internet use at work; the only exception again being that the group with the second highest income had the highest use rate (79.00%), while the group with the highest income had the second highest rate (73.30%) (Appendix, Table 3).
From analyzing these three indicators of informationalization—the penetration and adoption of ICTs in the economy, changes in the sectoral composition of the economy, and the extent of the adoption of information technology in the labor force—it is clear that Taiwan has made the transition to an information economy. However, the above analysis does not clearly indicate whether other economic changes that usually accompany this transition have also taken place in Taiwan. The next section, therefore, examines the correspondent impacts of this technological change on the labor market.
4. Information Economy and the Labor Market
Conversion to an information economy often has consequences in the labor market on wage structures, productivity, and occupational transformation.
(1). Transformation of the Wage Structure
A key outcome to consider when examining a newly formed information society is whether the society is economically more equal or unequal. It seems that more researchers tend to agree that the social trend moves society toward greater inequality (Castells, 1996c; Machin, 2003; Victor & Stephens, 1999). Some researchers claim that wage structures will
be polarized as ICTs lower the wage levels of those whose jobs are more easily replaced; likewise, those in professional occupations, who are difficult to replace, will enjoy higher wage levels (Castells, 1996c; Machin, 2003; Victor & Stephens, 1999). For example, Machin (2003) and other researchers (Krueger, 1993; Victor & Stephens, 1999) indicate that in the past 25 years or so in several countries, most notably the United States and United Kingdom, there was an apparent trend of earnings inequality and a move in favor of the skilled. They infer that ICTs, especially microcomputers, are likely the driving force behind these transitions, both because computer use spread rapidly during this period and because of a perception that the introduction of computers has led to a skill-biased technological change, shifting demand for labor toward more skilled workers and thus bringing up their relative wages.
Other scholars question the contribution of ICTs to changes in wage structure and increased economic inequality (Galbraith, 2000; Galbraith & Berner, 2001; Gittleman, 2003). In the case of the U.S., Galbraith (2000) argues that a causal association between computer usage and wage level is still unclear because the main income beneficiaries are not those with the greatest increase in ICT use, and the timing of the increase in inequality and the introduction of computers was not concurrent. Moreover, the increased adoption of ICTs has not noticeably contributed to increased productivity. He also points out that the causality may be directed from inequality in the wage structure to the use of computers rather than the reverse.
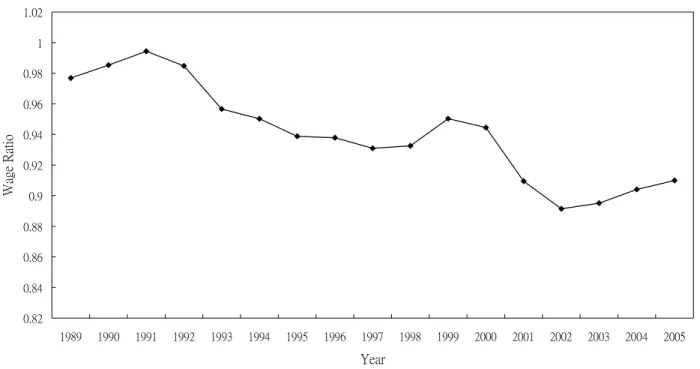
Now let us consider changes in the wage structure in Taiwan. Figure 3 shows the ratio of blue to white-collar workers’ average monthly wages. There is a clear trend of uneven decline for this ratio, with the lowest point reached in 2002, at 0.891. This means that after 1989, compared to white-collar workers, blue-collar workers’ wages have continued to fall, thus
increasing the wage inequality in Taiwan’s information economy age. Except the potential influence of ICT adoption on wages, two other possible reasons include the quick rise of IT industries whose labor intensive sectors were gradually moved to China, and Taiwan’s open immigrant labor policies. Both factors also resulted in the wage improvement of workers with professional knowledge/skills (mainly white-collar) and the wage decrease of workers who could be replaced by China and Southeast Asia’s workers, such as machine operators and elementary workers (physical labor workers, mainly blue-collar).
Figure 3. Monthly Wage Ratio, 1989-2005, Blue-Collar/ White-Collar
0.82 0.84 0.86 0.88 0.9 0.92 0.94 0.96 0.98 1 1.02 1989 1990 1991 1992 1993 1994 1995 1996 1997 1998 1999 2000 2001 2002 2003 2004 2005 Year Wage R atio
Source: The author’s calculations according to the GBAS data
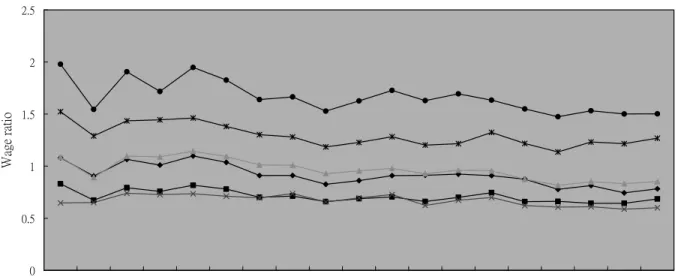
Figure 4 reveals the phenomenon of rising wages for professional skilled workers. The figure displays wage ratios over time, comparing other occupations to technicians or associate professionals. As we can see in this figure, the machine operators to technicians monthly wage ratio continually dropped from 1.09 in 1987 to 0.85 in 2005. The elementary workers to technicians monthly wage ratio fell from 0.83 to 0.68. Similarly, the clerks to
technicians and service workers to technicians wage ratios decreased from .08 to 0.78 and from 0.65 to 0.60.
Figure 4. Monthly Wage Ratio, 1987-2005, Other Occupations to Technicians
0 0.5 1 1.5 2 2.5 1987 1988 1989 1990 1991 1992 1993 1994 1995 1996 1997 1998 1999 2000 2001 2002 2003 2004 2005 Year Wa ge r at io
Clerk/ technicians Elementary/technicians Machine operater/ technicians Service worker/ technicians Professionals/ technicians Managers/technicians
Source: The author’s calculations based on the GBAS data
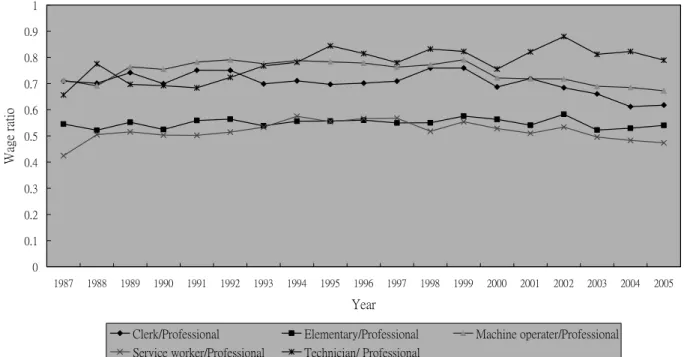
Figure 5 offers a slightly different perspective by displaying a ratio wage comparison of other occupations to professional positions, enabling us to further understand the wage inequality situation in Taiwan. As we can see in Figure 5, the wage ratio of machine operators to professionals rose substantially at the end of the 1980s and peaked in 1992; but from 1992 on, it continued declining from 0.79 to only 0.67 in 2005. The clerks to professionals wage ratio fell gradually and unevenly, from 0.709 in 1987 to around 0.617 in 2005. The wage ratios of elementary workers to professionals reveal greater fluctuations, with change rates as wide as 6% even over one year (such as 2001 and 2002, as well as 2002 and 2003), although from 1987 to 2005 the overall change was less than 0.5%, which seems to indicate no change. A wage comparison of service and sales workers with professionals reveals minor differences, although service and
sales workers’ wages were the lowest on average among all occupation categories. The wage ratio hit the highest point in 1994, reaching 0.575 but then slowly declined to 0.473 in 2005.
Figure 5. Monthly Wage Ratio, 1987-2005, Other Occupations to Professionals
0 0.1 0.2 0.3 0.4 0.5 0.6 0.7 0.8 0.9 1 1987 1988 1989 1990 1991 1992 1993 1994 1995 1996 1997 1998 1999 2000 2001 2002 2003 2004 2005 Year Wage ratio
Clerk/Professional Elementary/Professional Machine operater/Professional
Service worker/Professional Technician/ Professional
Source: The author’s calculations based on the GBAS data
From the above wage ratio comparisons we can observe an apparent wage deterioration in occupations requiring lower professional and technical skills, as compared with more professional or semi-professional jobs. Although this shift is a gradual rather than dramatic one, it has worsened Taiwan’s economic inequality since the beginning of the 1990s, and especially since 2000.
(2). Information Economy and Unemployment
When considering the dynamic relationships between information economy and unemployment, scholars have diverse observations, viewpoints, and explanations. These arguments can be generally categorized into four
different groups.
A. Enhancement of employment and international competitiveness
According to these arguments, the adoption of new production technologies such as ICTs is claimed to improve productivity and accordingly to stimulate market demand, which in turn generates higher output and employment. Another more convincing explanation transforms this idea by deploying a global competitive viewpoint. Some believe that new technology, rapidly accepted, will increase productivity and thereby international competitive edge, which will be translated into market growth and in turn more employment (Jennie, 1983). Furthermore, the emergence of ICT industries such as hardware and software industries, Internet service providers (ISPs), and the online-game industry, has also created a great number of jobs (OECD, 2002). Additionally, Soete (2001) indicates that the increased number of jobs created by the development of ICTs in the service sector is able to “absorb” the decreased number of employees in the manufacturing and agriculture sectors replaced by new technologies, resulting in an increase in employment.
B. Reduction of employment
Although agreeing with the technological effects on productivity improvement, some scholars oppose the argument of employment enhancement due to ICT adoption; by contrast, they report that there is a correspondence between technological use (improved productivity) and an increase in unemployment (Aghion & Howitt, 1998; Cyert & Mowery, 1989; Mills, 1938). For example, Webster and Robins (1986a) state that ICTs will bring about further unemployment due to five factors: first, even in areas of economic growth, employment does not necessarily expand; second, ICTs are being introduced overwhelmingly to save on expenditures in order to
increase profitability and/or efficiency rather than to increase employment; third, in all advanced capitalist societies the new technology is being introduced to meet the threat of other nations, possibly resulting in cheaper production, less employment, and no overall economic change; fourth, service sector employment is not increasing at the moment and is likely in future to decline in significant areas because of the application of ICTs; and finally, demographic trends exacerbate the unemployment problem brought on by ICTs.
C. Long-term balance of employment and unemployment
Distinct from the employment and unemployment viewpoints, some researchers maintain an argument that an employment equilibrium will be achieved in the long term. They believe that the market price mechanism will ensure that demand and supply of labor eventually adjust to one another, and therefore long-term unemployment caused by technologies will be impossible. Moreover, the employment impact of ICTs will be one of swings and roundabouts, with job loss here and job gain there, but in the end some sort of equilibrium will be achieved (Sleigh et al., 1979).
D. Differences by region, industry, or occupation
Some scholars, such as Castells (1996c), maintain there is no systematic structural relationship between the diffusion of ICTs and the evolution of employment levels in the economy as a whole. He indicates that ICT impact on employment varies in different countries, regions, and industries, because of the mediation of several macro-economic factors. Using another approach, Galbraith (2000) deploys his analysis by dividing the economy into different sectors. He first points out that the technology/worker relationship in the capital sector is more complementary and interdependent. Thus, workers in the capital sector are more difficult to
replace with machines. However, in the consumer goods sector, technology and machines can take the place of workers because the technology/worker relationship is more interchangeable. And finally, the hardest hit by technologies is the service sector. Workers in the service sector are lower-skilled and are the easiest to replace with technology (Galbraith, 2000).
E. Taiwan’s information economy and unemployment
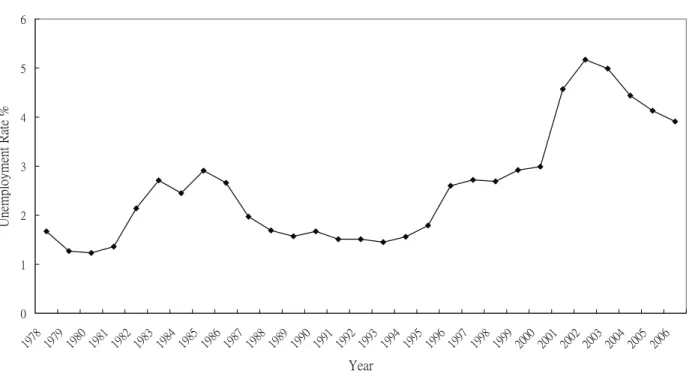
Figure 6 shows us unemployment trends in Taiwan from 1978 to 2006.
If we consider Taiwan’s industrial history, we see that before the 1980s (especially in the 1960s and 1970s), Taiwan had a very low unemployment rate because of its strong labor intensive industries such as clothing and textiles. But in the 1980s, Taiwan underwent a dramatic industrial transformation from labor intensive manufacturing to a knowledge/ information intensive economy, which worsened the unemployment problem. For example, information industries are mainly technique/ knowledge intensive; that is, compared to traditional labor intensive industries, they hire fewer workers, especially lower skilled workers. Moreover, in the first half of the 1990s, Taiwan opened its doors to immigrant workers from Southeast Asian and also began to allow domestic investment in China in order to help the industrial upgrade to information intensive and hi-tech industries, resulting in both the replacement of lower skilled domestic workers and also the so-called “second wave” of exporting the labor intensive departments of Taiwanese information industries. These factors are believed to have worsened the unemployment problem after 1990. Likewise, some information/knowledge intensive service industries, like finance and telecommunications, experienced labor saturation and were not able to absorb the redundant labor force released from the manufacturing industries due to plant relocations to China, making the unemployment situation even
worse. As a result, during the world recession from 2000 to 2003, Taiwan’s unemployment rate hit a historical record at 5.17% in 2001. After 2003, although the economy steadily returned to normal and the unemployment rate gradually declined, the unemployment rate was still as high as 3.91% in 2006, much higher than in the 1980s, at around 1.23%. Thus, we can observe in Taiwan’s case that the information economy has not significantly enhanced Taiwan’s employment; on the contrary, it may have worsened Taiwan’s unemployment problem.
Figure 6. Unemployment Rate, Taiwan, 1978-2006
0 1 2 3 4 5 6 1978 1979 1980 1981 1982 1983 1984 1985 1986 1987 1988 1989 1990 1991 1992 1993 1994 1995 1996 1997 1998 1999 2000 2001 2002 2003 2004 2005 2006 Year Une m pl oy m ent Rat e %
Source: The GBAS data
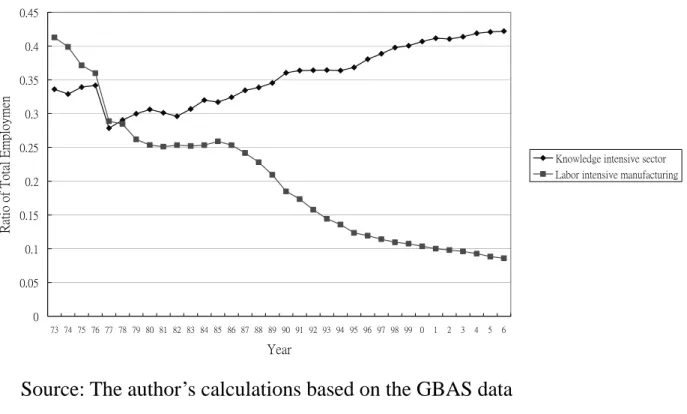
Supporting the argument above, Figure 2 and Figure 6 both show us that compared to traditional labor intensive manufacturing, which offered Taiwan almost “full employment” during the 1960s and 1970s, the information/ knowledge intensive economy has weak potential for offering our society mass employment. Section 2 already indicated that although the information/knowledge intensive sector has already contributed the most
to the total GDP, its contribution to employment still lags behind the labor intensive sector (including labor intensive manufacturing and labor intensive service). Specifically, Figure 6 indicates that after Taiwan’s industrial transition from labor intensive manufacturing to a technique/ information intensive economy, the employment ratio (of total employment) of the knowledge intensive sector (including both manufacturing and service) rose from 0.336 in 1977 to only 0.422 in 2006, increasing only 0.086; in contrast, for labor intensive manufacturing itself (not even including labor intensive service or other industries), the amount of the declining ratio was as much as 0.327 ( dropping from 0.413 to 0.086). The increase in the employment ratio of the knowledge intensive sector (0.086) lags far behind the employment decline in labor intensive manufacturing (0.327). Moreover, because the available statistical data was only from 1977, not from the peak period of labor intensive manufacturing, 1960-1970, the contribution of labor intensive manufacturing to the total employment is still underestimated. However, overall we can see that so far Taiwan’s information economy has not contributed as much to employment as labor intensive manufacturing did in the 1960s and 1970s, and one can observe a gradually worsening problem of unemployment after 1980 when the information economy prevailed.
Figure 7. Information Economy and Employment Contribution 0 0.05 0.1 0.15 0.2 0.25 0.3 0.35 0.4 0.45 73 74 75 76 77 78 79 80 81 82 83 84 85 86 87 88 89 90 91 92 93 94 95 96 97 98 99 0 1 2 3 4 5 6 Year Ra ti o of Tot al Emp loyme n
Knowledge intensive sector Labor intensive manufacturing
Source: The author’s calculations based on the GBAS data (3). Occupational Transformation of the Labor Force
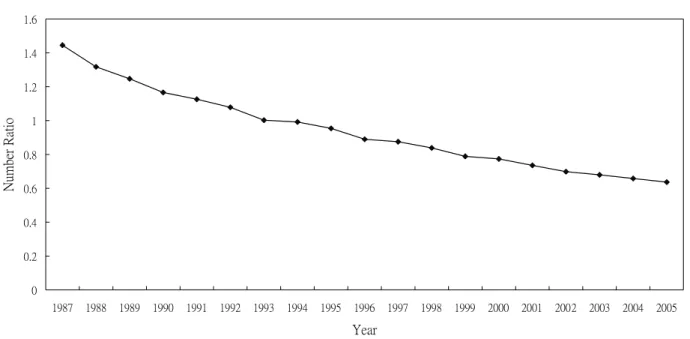
According to information society scholars, the occupations in an information economy will shift largely from blue-collar/manual/ routine workers to white-collar/knowledge/non-routine workers (Bell, 1980; F. Machlup, 1962). Take the U.S.’s employment pattern shifts as an example. Martin’s (1998) research did find a transition from a majority employment in manual work (primarily blue-collar and agricultural) to a majority employment in knowledge work (primarily white-collar). Moreover, Castells (1996b) argues that in an information economy society, the numbers of higher level and lower level workers might both increase, while the number of middle level management workers might decline, because the use of ICTs can replace management workers. This phenomenon is called polarization.
Figure 6. Employment Ratio, Blue-Collar Workers to White-Collar Workers, 1987-2005 0 0.2 0.4 0.6 0.8 1 1.2 1.4 1.6 1987 1988 1989 1990 1991 1992 1993 1994 1995 1996 1997 1998 1999 2000 2001 2002 2003 2004 2005 Year Nu mb er R atio
Source: Author’s calculation according to the GBAS data
The Taiwan data reveal that this was indeed the case there as well. According to DGBAS data and the calculations of this research, displayed in Figure 6, the decreasing trend of the blue to white-collar employment ratio is readily apparent. The ratio has continued to decline along an almost straight line, from 1.44 in 1987 to 0.636 in 2005.
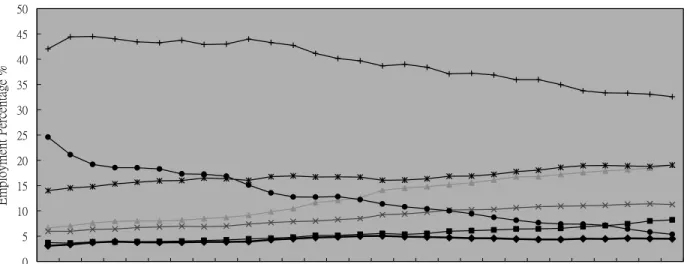
Figure 7 displays percentages of total employment for all occupations. The percentage of total positions filled by managers and executives in all occupations actually decreased slightly from 1991 at 4.84% to 2006 at 4.47%. Unlike the predictions, numbers of lower level workers such as elementary workers and machine operators declined a lot. In the same period, number of elementary worker positions fell considerably from 12.82% to 5.35%, and machine operators declined from 40.14% to 32.56%. The possible reason for this might be the government’s immigrant labor open policies. At the same time, as predicted in the literature on information economies, the occupations of professionals and technicians were enhanced;
we can observe from Figure 7 that professional occupations as a percentage of total occupations increased from 1991 at 5.15% to 2006 at 8.22% and technician and associate professionals increased greatly from 1991 at 12.08% to 2006 at 19.08%. Although the total percentage of lower level jobs (including clerks, service workers, elementary workers, and machine operators) declined from 77.94% to 68.22%, the population of lower level workers is still comparatively larger than the higher professional and managerial class.
Figure 7. Employment Percentages of All Occupations
0 5 10 15 20 25 30 35 40 45 50 1978 1979 1980 1981 1982 1983 1984 1985 1986 1987 1988 1989 1990 1991 1992 1993 1994 1995 1996 1997 1998 1999 2000 2001 2002 2003 2004 2005 2006 Year Emplo yme nt Pe rce nta ge %
Business executives and managers Professionals Technicians & associate professionals
Clerks Service workers & sales workers Elementary occupations
Production machine operators
Source: The GBAS data Conclusions
According to the above analysis, we can see that the extent of informationalization of the society, industry, economy, and labor force in Taiwan is very high, especially compared to other countries. Thus, it seems fair to say that Taiwan can already be considered an information economy society.
As a result of the conversion to an information economy society, according to the data analyzed above, Taiwan does exhibit changes in industries, wage structure, employment, and occupations. First, the knowledge/information intensive sector has become the most important contributor to the total GDP, although it is the labor intensive sector that accounts for the biggest share of total employment. Second, ICT use by Taiwanese workers did correspond to occupational and income hierarchy; that is, higher level workers and those with higher incomes used ICTs at work more than lower level workers. Third, as predicted by some information and network society researchers, occupations did shift from blue-collar to white-collar work, and jobs shifted from labor intensive to knowledge/information intensive. Fourth, wage differences between blue-collar and white-collar workers and between professional and less professional occupations continue to enlarge, contributing to the continuously increasing economic inequality in Taiwan. Fifth, in line with the assertion of some scholars that there is a positive relationship between informationalization and unemployment, we observe that information intensive industries do not contribute as much to Taiwan’s employment as traditional labor intensive manufacturing did in the 1960s and 1970s, and Taiwan’s unemployment rate did grow considerably after 1980 when the information economy became predominant. Sixth, just as information economy researchers have predicted, the importance of managers has declined but only to a very slight extent; the employment percentage of managers declined somewhat from 4.84% in 1991 to 4.47% in 2006. Seventh, although higher level jobs have increased in Taiwan in the last two decades, as information society scholars have predicted, lower level job opportunities have not increased as expected because of Taiwan’s immigrant worker policies and open policies for investing China. Thus, the phenomenon of polarization has not occurred in Taiwan.
Compared to other developed or developing countries, NICs such as Taiwan had very low wage inequality and unemployment rates before ushering in the information economy age. This was due to Taiwan’s strong labor intensive manufacturing, which also made the later labor market transition (the increase of wage disparity and unemployment rate) seem more dramatic than for other countries. Scholars like Castells (Castells, 1996a; 1996c) or Webster and Robins (1986b) believe that informationalization (or using Castells’ term, “ informationalism”) is responsible for these socio-economic changes, and some have observed that the state and its policies seem rather powerless to control the situation. However, other scholars point out contrasting situations in other information economy entities, such as the higher inequality growth of the U.S. in contrast to the lower inequality growth of Germany, to show that governments’ policies can play a crucial role in influencing these results (Freeman, 1999; Galbraith, 2000). However, unlike other countries, NIC governments such as the Taiwan government usually play a more active role in directing the country’s economic development (the developmental state model) and it is also fair to say that the transformation to an information economy was also a result of the government’s industrial policies. Thus, other information economy entities, the government in Taiwan is and should be expected to take more responsibility for the negative socio-economic outcome of the information economy development, and to even be able to prevent the negative outcome. From the experiences of other countries such as Germany, Norway, or Belgium, policies are a possible and feasible way to prevent the above-mentioned problems resulting from the rise of an information economy.
Table 3 Unit: persons ; % Use of Computers and Internet at Work-by Industry, Occupation and Average Monthly Income
Using computers
at work Using Internet at work 2005 April
Items Persons
Ever Never
Persons
Ever Never Don't know
Total 10,177 75.6 24.4 9,942 59.5 40.4
Industry
Agriculture, forestry & fishing 177 32.9 67.1 171 23.1 76.9 - Mining & quarrying 19 79.9 20.1 17 52.0 48.0 -
Manufacturing 2,738 73.0 26.6 2,659 53.4 46.6 -
Electricity, gas & water 112 74.3 25.7 97 51.8 48.2 -
Construction 557 61.1 38.9 544 48.8 51.2 -
Trade 1,422 72.5 27.5 1,381 53.6 46.4 -
Accommodation & eating 387 41.4 58.6 386 26.2 73.8 - Transport & communication 463 67.8 32.2 452 51.0 49.0 - Finance & insurance 699 95.2 4.8 694 81.2 18.8 -
Real estate 68 78.6 21.4 66 60.1 39.9 -
Professional & technical 485 89.7 10.3 477 78.8 21.2 -
Education 969 91.3 8.7 693 79.6 20.3 0.0
Healthcare 446 83.0 17.0 435 59.2 40.8 -
Culture, sports & entertainment 282 77.2 22.8 291 68.9 31.1 - Other services 651 59.2 40.8 634 46.8 53.2 - Public administration 692 95.8 4.2 677 83.2 16.7 0.1 Occupation
Executives & managers 1,398 83.8 16.2 1,365 71.0 29.0 - Professionals 2,094 93.6 6.4 2,079 79.1 20.8 0.0 Associate professionals 1,404 80.2 19.8 1,382 64.7 35.3 -
Clerks 2,123 91.4 8.6 2,075 73.9 26.0 0.0
Service workers 1,124 54.8 45.2 1,095 35.4 64.6 - Agriculture, forestry & fishing 134 25.1 74.9 128 14.0 86.0 - Mechanic workers 914 43.9 56.1 877 25.2 74.8 - Machine operators 309 37.6 62.4 297 15.3 84.7 - Elementary workers 521 37.4 62.6 495 21.1 78.9 -
Others 36 82.3 17.7 36 63.8 36.2 -
Don't know 121 85.2 14.8 110 69.7 30.3 -
Monthly income $ (dollars)
<480 355 49.8 50.2 348 33.9 66.1 - 480-606 441 52.3 47.4 422 33.5 56.5 - 606-757 1,015 66.6 33.4 990 44.8 55.1 0.0 757-909 1,133 71.0 29.0 1,111 51.8 48.2 - 909-1212 2,194 77.1 22.9 2,151 61.2 38.8 0.0 1212-1818 2,473 81.8 18.2 2,447 68.4 31.6 - 1818-2424 840 87.4 12.6 828 72.9 27.1 - 2424-3030 234 90.1 9.9 233 79.0 21.0 - >3030 451 83.2 16.8 432 73.3 26.7 - Don't know 1,043 74.0 26.0 980 55.6 44.4 - Source:Data from the Directorate for General Budget, Accounting and Statistics, R.O.C
References
Aghion, P., & Howitt, P. (1998). Endogenous Growth Theory. Cambridge, MA: MIT Press.
Bell, D. (1980). "The social framework of the information society," In T. Forester (eds.) The Microelectronics Revolution: The Complete Guide
to the New Technology. Pp. 500-549. Cambridge, MA: MIT.
Castells, M. (1996a). "The new economy: informationalism, globalization, networking," In The Rise of the Network Society. Pp.77-162. Oxford: Blackwell.
Castells, M. (1996b). The Rise of the Network Society. Oxford: Blackwell. Castells, M. (1996c). "The transformation of work and employment:
Networkers, jobless, and flextimers," In The Rise of the Network
Society. Pp.201-326. Oxford: Blackwell.
Cyert, R., & Mowery, D. (1989). “Technology, employment and U.S. competitiveness,” Scientific American, 260(5), 42-54.
Dordick, H. S., & Wang, G. (1993). The Information Society: A Retrospective
View. Newbury Park: CA: Sage.
Ferguson, T., & Galbraith, J. K. (2001). "The American wage structure: 1920-1947," In J. K. Galbraith & M. Berner (eds.) Inequality and
Industrial Change- A Global View Pp. 33-78. NY: Cambridge
University Press.
Freeman, R. B. (1999). "The new inequality in the United States," In A. Fishlow & K. Parker (eds.) Growing Apart: The Causes and
Consequences of Global Wage Inequality Pp. 21-66. New York, NY:
Council on Foreign Relations.
Galbraith, J. K. (2000). Created Unequal. Chicago: University of Chicago Press.
Galbraith, J. K., & Berner, M. (eds.) (2001). Inequality and Industrial
Gittleman, M. (2003). "Who uses computers and in what ways: Effects on the earnings distribution," In D. C. Jones (eds.), New Economy
Handbook Pp.523-544. San Diego, CA: Academic Press
Katz, R. L. (1988). The Information Society: An International Perspective. New York: Praeger.
Krueger, A. B. (1993). “How Computers have changed the wage structure: Evidence from micro data, 1984-1989,” Quarterly Journal of
Economics (Feb. 1993), 33-60.
Machin, S. (2003). "Skill-biased technical change in the new economy,". In D. Jones (eds.), New Economy Handbook Pp. 565-581. San Diego, CA Academic Press
Machlup, F. (1962). The production and distribution of knowledge in the United States. Princeton, NJ: Princeton University Press.
Martin, S. B. (1998). “Information technology, employment, and the information sector: Trends in information employment 1970-1995,”
Journal of the American Society for Information Science, 49(12),
1053-1069.
Mills, A. (1938). Employment opportunities in manufacturing industries in
the U.S. New York: National Bureau of Economic Research Bulletin no.
70.
OECD. (2001). OECD Science, Technology and Industry Scoreboard: Towards a Knowledge-based Economy. Paris: Organization for Economic Cooperation and Development.
OECD. (2004). OECD The Economic Impact of ICT -Measurement,
Evidence, and Implications. Paris: Organization for Economic
Cooperation and Development.
Soete, L. (2001). “ICTs, knowledge work and employment: The challenges to Europe,” International Labour Review, 140(2), 143-163.
forms," In G. DeSanctis & J. Fulk (eds.) Shaping Organization Form:
Communication, Connection, and Community Pp. 447-452. Thousand
Oaks, CA: Sage.
Wang, H. H. (1999). “ICT and economic development in Taiwan: Analysis of the evidence,” Telecommunications Policy, 23, 235-243.
Webster, F., & Robins, K. (1986a). Information Technology: A Luddite
Analysis. Norwood, NJ: Alex Publication Corporation.
Webster, F., & Robins, K. (1986b). “IT and work,” In Information
Technology: a Luddite Analysis Pp. 83-181. Norwood, NJ: Alex
Publication Corporation.
Zhang, H. F., & Wang, B. (1994). “Taiwan information industries' past, present, and future,” Journal of Library and Information, 2, 30-36.