行政院國家科學委員會專題研究計畫 成果報告
雙品牌下消費者基礎的品牌權益: 一個特定的態度性衡量
研究成果報告(精簡版)
計 畫 類 別 : 個別型 計 畫 編 號 : NSC 99-2410-H-004-225- 執 行 期 間 : 99 年 08 月 01 日至 100 年 10 月 31 日 執 行 單 位 : 國立政治大學企業管理學系 計 畫 主 持 人 : 李嘉林 計畫參與人員: 碩士班研究生-兼任助理人員:丘青鎧 大專生-兼任助理人員:陳偉彤 大專生-兼任助理人員:曾柏竣 公 開 資 訊 : 本計畫可公開查詢中 華 民 國 101 年 01 月 29 日
中 文 摘 要 : 由於雙品牌是一個相對新的品牌策略,因此研究學者們對於 雙品牌策略是否能夠成功的相關探討仍為數不多,並且對於 如何衡量雙品牌的價值 – 品牌權益 – 也仍不清楚。 我們認為,除了傳統衡量品牌權益的方法以外,也可試圖建 立一個行為基礎的態度性衡量來評估消費者基準的品牌權 益,並同時可彌補過去文獻中的一個缺口。這個特定的衡量 是從李與戴克(2009)的數學模型延伸而來,而此量化衡量被 用在實驗中來測試兩個重要的研究假說。此實驗採用 2 (在 耐用度的屬性水準上兩品牌的差異) × 2 (在風格的屬性水準 上兩品牌的差異) 的實驗設計。兩個研究假說在實驗中皆獲 得部分支持。 本研究的兩個研究假說試圖為實務品牌經理人回答兩個重要 的問題: 第一:若雙品牌的品牌權益可能是兩個聯盟品牌的加 權平均,為何高品牌權益的聯盟品牌仍會與低品牌權益的聯 盟品牌聯盟;第二:到何種程度聯盟品牌彼此在結盟後不會拆 夥 — 尤其是當聯盟後的權益比聯盟前的權益小。本研究有 兩個主要貢獻:第一:本研究利用期望價值模型將顧客對於聯 盟品牌的態度強弱連結到聯盟品牌的消費者基礎權益大小; 第二:本研究所提供的簡化指標將延伸過去在雙品牌領域中討 論品牌價值評估的知識。 中文關鍵詞: 消費者基準的品牌權益,雙品牌,實驗法,期望-價值模型 英 文 摘 要 : Since co-branding is a relatively new phenomenon, the
explicit findings of co-branding success are still limited and the ways to evaluate what the co-brand is worth – brand equity – are still obscure.
We argue that, except the use of traditional
approaches of measuring brand equity in co-branding field, we can also try to build a behavioral-based attitudinal measure for evaluating consumer-based brand equities (CBBE) of the co-brand and the
partnering brands, and this can also fill a void in the literature. The proposed measure is originated by adapting the Lee and Decker (2009)’s mathematical model, and this quantitative measure is utilized to test two important research hypotheses in an
experiment. The experiment employed a 2 (the difference of attribute levels on durability) × 2 (the difference of attribute levels on style) design. The two research hypotheses are not fully supported
in our experiment.
Our results answered two important managerial questions for branding managers: first, to what extent a high-equity brand wants to ally with a low-equity brand, since the low-equity of the co-brand may be just a weighted average; secondly, to which degree one of the partnering brands can agree on not
breaking up the alliance, especially when its post-alliance equity is smaller than its pre-post-alliance equity. The present study has two major contributions to the strategic branding field: first, we use the expectancy-value model to connect attitudinal favorability to the measure of respective CBBE; secondly, we advance existing knowledge of brand value evaluation in the field of co-branding by offering a relatively simplified measure.
英文關鍵詞: Consumer-based brand equity, Co-branding, Experiments, Expectancy-value model
行政院國家科學委員會補助專題研究計畫
成果報告
雙品牌下消費者基礎的品牌權益: 一個特定的態度性衡量
計畫類別:□個別型計畫
計畫編號:NSC 99-2410-H-004-225
執行期間:民國 99 年 8 月 1 日至 100 年 10 月 31 日
執行機構及系所:國立政治大學企業管理學系
計畫主持人:李嘉林 助理教授
計畫參與人員:學士級兼任助理 陳偉彤
學士級兼任助理 曾柏竣
碩士級兼任助理 丘青鎧
成果報告類型(依經費核定清單規定繳交):□ 精簡報告
本計畫除繳交成果報告外,另須繳交以下出國心得報告:
□赴國外出差或研習心得報告
□赴大陸地區出差或研習心得報告
□出席國際學術會議心得報告
□國際合作研究計畫國外研究報告
處理方式: 本計劃可立即公開查詢
中 華 民 國 一 百 零 一 年 一 月 三 十 日
Consumer-based Brand Equity in Co-branding:
A Specific Attitudinal Measure
Chia-Lin Lee*
* Contact details:
Assistant Professor of Marketing,
Department of Business Administration, National Chengchi University,
Address: No.64, Sec. 2, Zhi Nan Rd., Wenshan District, Taipei City 11605, TAIWAN
Phone: +886-2-29393091 Ext. 88180
Email: [email protected]
1. Introduction and Research Objective (前言及研究目的)
The examples of successful co-branding alliances include Oral-B Rembrandt whitening pen and
Sony-Ericsson mobiles. Rao and Ruekert (1994) have inferred that the success of co-branding may be
evaluated by measuring the aggregated brand value. However, since co-branding is a relatively new phenomenon (Hadjicharalambous, 2006), revelant studies with regard to co-branding success are still limited (Hadjicharalambous, p.372, 2006), and, thus, the ways to measure the success – to evaluate what the co-brand is worth – are still obscure. To our knowledge, the following two research questions have remain unresolved in this scientific field:
(1) Does the value, if measurable, of the composite brand (i.e., the co-brand) exceed the value of each
of the partnering brands (i.e., two constituent brands)?
(2) Does the value of one partnering brand increase after the alliance (e.g., Sony in Sony-Ericsson
alliance)?
According to Keller and Lehmann (2006), measuring brand equity (value) is still an important issue of branding research in the near future. Among the various types of brand equities, Consumer-Based Brand Equity (CBBE) (Keller, 1993) has been discussed extensively in branding field. Since the value of one brand can be estimated by its brand equity, the objective of this proposed study is to initiate a specific attitudinal measure of CBBE for estimating brand value in the filed of co-branding, and to answer the two research questions listed above.
The remainder of this paper is organized as follows. The current section highlights backgrounds and the research objective. We will proceed by taking reviews of existing relevant literature and by concluding two important research hypotheses from previous studies in section 2. In section 3, we will offer a brief review of the Lee and Decker (2009) model and list the procedures of performing an experiment. In section 4, we will present the results. Finally we discuss contributions and future research directions in section 5.
2. Literature Review and Research Hypotheses (文獻探討及研究假說)
Brand equity can be defined as “a set of brand assets and liabilities linked to a brand, its name and symbol,
that add to or subtract from the value provided by a product or service to a firm and/or to that firm's customer” (Aaker, p.15, 1991). Numerous academic studies have shown different scales for measuring brand
equity (e.g., Aaker, 1991; Park and Srinivasan, 1994). Generally speaking, brand equity can be estimated from three major perspectives (Keller and Lehmann, 2006), namely consumer-based (e.g., Washburn et al., 2000), company-based (e.g., Hoeffler and Keller, 2003) and financial-based (e.g., Ambler, 2004).
Among others, consumer-based (or customer-based, see Boonghee and Donthu, 1997) brand equity (CBBE) has garnered a large amount of attention recently (Washburn et al., 2004). CBBE is defined as “the differential
effect of brand knowledge on consumer response to the marketing of the brand” (Keller, p.2, 1993). The
studies relevant to CBBE usually discuss the perceived brand value by studying consumers’ attitudes towards that brand (Kartono and Rao, 2009). We argue that CBBE is the most important measure in the co-banding context, because (1) the composite brand is a combination of two brands and ultimately the brands are “owned” in the hearts of consumers (Leuthesser et al., 2003), and (2) the value of one co-brand often comes from consumers’ favorable evaluation of that brand (Hadjicharalambous, 2006).
However, to the author’s knowledge, there are only four discussions revelant to the measure of CBBE in co-branding context. Based on associative-learning framework (Van Osselaer and Janiszewski, 2001), Washburn et al. (2000, 2004) have provided a qualitative and attitudinal measure to evaluate CBBE of the composite brand as well as the changes of CBBE of the partnering brands (i.e., pre- and post-alliance). From a sigaling perspective, Washburn et al. (2000) have claimed that consumers can transfer the associations of the two constituent brands to the alliance, and that the strength of the association can represent the magnitude of brand equity. In their empirical experiment eight hypotheses were tested to observe how the high-equity (low-equity) brand can be affected after forming an asymmetric alliance (i.e., a high-equity with a low-equity brand). Their results – similar to Rao et al. (1999) – indicated that the low-equity brand is enhanced by the asymmetric partnership rather than the high-equity brand. Surprisingly, their findings revealed that it is difficult to damage the high-equity brand, even when it is paired with a lower one.
From the viewpoint of economics of information theory, Washburn et al. (2004) explored how CBBE of the partnering brands influences consumer evaluations of the search, experience, and credence attribute performance of the co-brand, and how one partner’s CBBE affects the other’s through a partnership. Their experimental results showed that a trial on co-branded product can moderate CBBE of partnering brands for experience attributes, and that a high-equity brand can enhance its perception when allying with another high-equity brand. Hao (2008) introduced an integrated two-factor congruence framework (i.e., expectancy congruence and relevancy congruence) to explore the decisive factors of partner selection. His empirical study supported the positive impacts of congruence on the favorability of the composite brand, and also reported that choosing a congruent partner can enlarge the focal brand’s equity. In addition, a recent article (Besharat, 2010) also utilized the measure of CBBE to investigate the effectiveness of co-branding as well as brand extension tactics.
Although Washburn et al. (2000, 2004) opened a new chapter of applying the attitudinal measure in measuring CBBE of co-branded products, the authors totally ignored the behavioral content behind such an attitudinal measure – the process of consumer evaluations of co-branding. Marketing researchers have long been concentrated on the psychological and behavioral changes in the context of co-branding. Park et al. (1996), for example, stated that the attribute complementarity plays an important role in consumer evaluations. In their experiments, the hypothetical co-branded cakemix is used and the results showed that, similar to brand extension, a co-branding alliance with the attribute complementarity (i.e., a better product fit) produces a positive effect on consumer attitudes toward the co-brand and thus can lead to the effectiveness of a co-branding strategy.
A considerable amount of attention has been paid to attitudinal favorability of the co-brand and the partnering brands after the alliance has established (e.g., Simonin and Ruth, 1998; Baumgarth, 2004), but discussions regarding the change of the core unit in consumer evaluations – belief revision – are rather limited. Hillyer and Tikoo (1995) argued that, through a co-branding alliance (e.g. Sony-Ericsson), the beliefs of attribute performance of the second brand (e.g., Ericsson) can lead to an enhancement or impairment on the beliefs of the primary brand (e.g., Sony). Geylani et al. (2008) further claimed that the beliefs of the partnering brands are changing after co-branding. They initiated a mathematical model to describe how consumers
receive new attribute information from the co-branded product and use their perceptions of the co-branded product to update their original beliefs of the partner brands.
Lee and Decker (2009) is a seminal piece in providing a detailed explanation of the connections between belief revision (i.e., belief dilution and enhancement) to attitude formation by using the expectancy-value model (Bass and Talarzyk, 1972) in the co-branding context. Their analysis focused on a specific type of co-branding – “functional co-branding alliance” (Cooke and Ryan, 2000), and they argued that a functional co-branding alliance has two effects on consumer evaluations: (1) the incongruent attribute information causes confusions about the true levels of the co-branded products and (2) consumers update their attitudes towards the partnering brands and the co-branded products by using the co-branding beliefs.
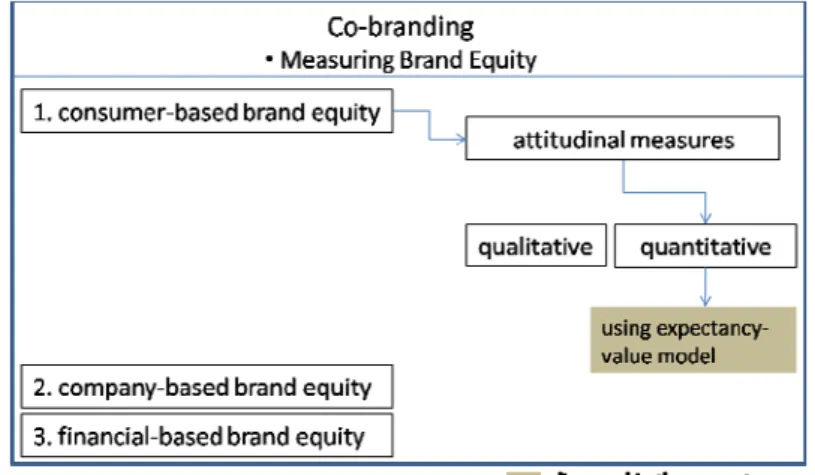
The present study tries to adapt Lee and Decker (2009)’s expectany-value model to further connect attitudinal favorability of the composite brand and the partnering brands to their respecitve CBBE. That is, the higher level of attitudinal favorability, the larger the CBBE. Hence, we attempt to provide a behavioral-based attitudinal measure of CBBE in this scientific field. Na et al. (p. 171, 1999) have supported our arguments. They suggested that, from the consumer perspecitve, a multi-attribute approach (e.g., expectancy-value model) for measuring brand equity is required. Therefore the Lee and Decker (2009) model could be considered a new and adequate way to estimate CBBE quantitatively. The scope of the present research is shown in Fig. 1.
Figure 1: Research Scope
which is adapted from Lee and Decker (2009).
The first hypothesis relates to the synergy effect. According to Rao and Ruekert (p.87, 1994), the purpose of co-branding can be illustrated by the following sentence:
“brand names are valuable assets, they maybe combined with other brand names to form a synergistic
alliance in which the sum is greater than the parts,”
That is, in an ideal situation, a brand alliance should provide an overall better result than if each brand works individually. This could infer that the CBBE (value) of the co-brand should be larger than or at least equal to the CBBE (value) of each of the partnering brands. However, a previous theoretical study may show a completely opposite direction – Geylani et al. (p. 734, 2008) found that the attribute levels of the co-brand may be located between each of the partnering brands (i.e., a weighted average). That is, ceteris paribus, by utilzling Lee and Decker (2009)’s expectancy-value model, the level of attitudinal favorability (CBBE) of the co-brand is possible to be smaller than the level of attitudinal favorability (CBBE) of one of the partnering brands. Therefore, we intend to test the following hypothsis:
H1: The equity of the co-brand is a weighted average of the pre-alliance equities of the partnering brands.
The second hypothesis involves a possible unobserved effect on the partnering brands. Hao (2008) has argued that
“brand alliances are not always a win-win phenomenon and potential negative effects could occur on both
sides…”.
By this argument, we claim that those negative effects may generate dilutions on the equities of the partnering brands. Similarly, Geylani et al. (p.742, 2008) concluded that each of the partnering brands may also encounter a negative impact on consumers’ association with specific attributes. That is – consumers may
have negative updates on the attribute levels of partnering brands. Finally the post-alliance attribute levels are possible to be more negative than the pre-alliance levels. Hence, ceteris paribus, by using the Lee and Decker (2009)’s expectancy-value model, this could imply:
H2: For one partnering brand, its post-alliance equity is smaller than its pre-alliance equity.
3. Research Method (研究方法)
The goal of the current research is to validate the two hypotheses derived from previous studies by utilizing a quantitative measure, which is adapted from the Lee and Decker (2009) model.
In particular, we want to test whether consumers react in correspondence with the two hypotheses. For that purpose, the experiment could be a better method (e.g., Amaldoss and Rapoport, 2005). In this section, we will provide a brief review of the Lee and Decker (p. 239, 2009) model first and then show the procedures for adapting their model into our experiment.
3.1 A brief summary of the Lee and Decker (2009) Model
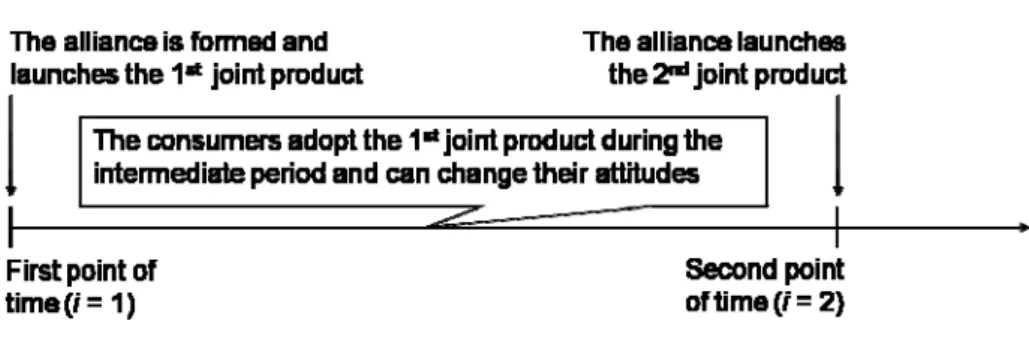
Lee and Decker (2009) demonstrated how consumers change their attribute beliefs and brand attitudes after the alliance is formed (i.e., i = 2 in Fig. 2).
Figure 2: Timeline
firms (cf. Balachander and Stock, 2009). The only difference among all the firms (brands) is the different perceived performance level of product-related attributes (e.g., tastes, shapes, colors). In addition, two firms (or brands), named A and B, are the prospective partners to form a “functional co-branding alliance”.
Similar to Venkatesh et al. (2000), Lee and Decker (2009) assumed that initially the market of interests has two preference segments of sizes MR 1 (MR 1 > 0) that prefer A and B, respectively. Two relevant product-related attributes, namely x and y, are used to characterize brand A and B. The preference of the two preference segments (i.e., group G, G{a, b} and indicates groups) at time i is formulated as a relative score composed of group G’s relative weights of attribute importance wK,G> 0 (K{x, y} and indicates attributes), and group G’s belief of each attribute of each brand PRK i,G> 0 (for notational simplicity, each element for attributes, groups, and brands will not be specified in the remaining sections of this proposal). By the expectancy-value model, G’s preference (or attitude) score RG i can be expressed as:
K G , K i R G , K G i R w P . (1)Assuming that attribute x is salient to A whereas y is salient to B. Hence, the initial attribute level of x (y) of
A (B) can be assumed to be larger than the initial (i = 1) level of x (y) of B (A):
x B x A P P 1 1 , (2) y A y B P P 1 1 . (3)
Besides, let D denote the initial attribute-level difference of attribute K between A and B. Hence, K
x B x A x P P D 1 1 , (4) y A y B y P P D 1 1 , (5) DDx Dy. (6)
In addition, they assumed that a better fit exists (i.e., attribute-level difference is positive, D > 0). Group G’s relative weight of attribute importance of attribute K is quantified as wK,G
0 ,1, andwx,a wy,a, where
1 K a K, w , (7) wy,b wx,b, where w K b K, 1
. (8) Eqs. (7) and (8) show that group a (b) considers attribute x (y) to be more important.They addressed what happens to the consumers when (after) they experience the first co-branded product. It is known that product experience causes consumers to revise their existing beliefs (Sheinin, 2000) and the revision process is complicated in co-branding (James, 2005) – a combination and a modification.
The combination means that pre-alliance beliefs are integrated into co-branding beliefs (James, 2005; Geylani et al., 2008). Co-branding beliefs in their model are formulated as:
x B x B x A x A x AB P P P 1 1 1 , where
xR
0,1 and
1 R x R , (9) PABy 1 yAPAy 1 ByPBy 1 , where
Ry
0,1 and
1 R y R . (10)In Eqs. (9) and (10),
KR denotes the relative contributing weight of each attribute of each brand to co-branding beliefs. A random term is added to represent the confusions that we discussed above.Finally, post-alliance (i.e. at time i = 2) beliefs about the partnering brands for the consumer group G can be given by
K R G , K R K AB G , K R G , K R P P P 2 1 1 1 , where
RK,G
0,1. (11)The rationale behind Eq. (11) is relevant to the model of accommodation (cf. Thorbjørnsen, 2005): co-branding beliefs are associated with pre-alliance beliefs and a revision of pre-alliance beliefs occurs. The
updating weight,
RK,G, determines the degree of revisions.Although Lee and Decker (2009) offered a detailed explanation of behavioral content of consumer evaluations in co-branding, they did not further apply their model to measure the respective CBBE of the composite brand and the two constituent brands.
We claim that the attitude score, RG i (cf. Eq. (1)), can be employed as a quantitative and attitudinal measure of CBBE – the larger the RG i , the higher the CBBE.
3.2 Procedures of Experiment
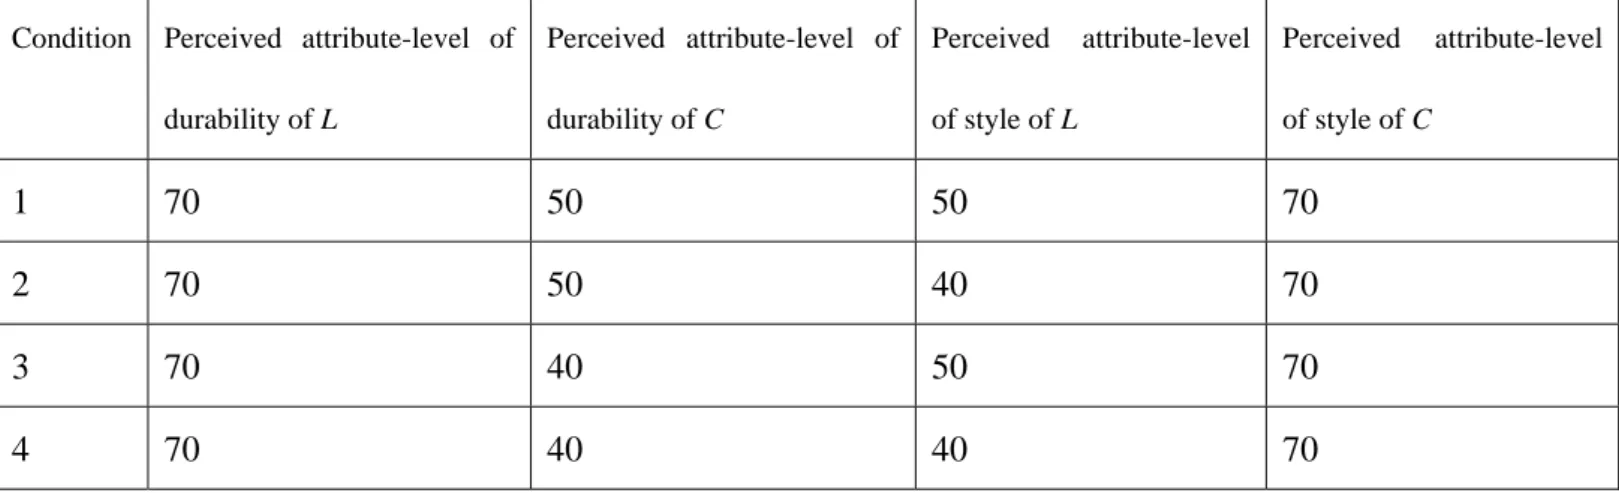
Our experiment is composed of the construction of a history of experience with two hypothetical briefcase brands, namely L and C (corresponding respectively to the notations of A and B in Lee and Decker, 2009), and they will release a co-branded briefcase (L’s-C’s briefcase). Since style and durability are identified as the most important attributes for eva1uating briefcases (see Ahluwalia and Gurhan-Canli, 2000), we assume that each consumer will evaluate the two brands by durability and style, corresponding to attribute x and y in Lee and Decker (2009). Assuming further that L’s salient attribute is durability, and C’s salient attribute is style.
Subjects were exposed to histograms referred as their experiences of the two partnering brands. To simplify the process, we will not take the heterogeneity between groups into considerations (cf. Eqs. (7) and (8)). Our experiment is a design (cf. p. 736, Geylani et al., 2008). That is, we release the assumption of equal attribute-level difference (cf. Eq. (6)). The first (second) factor is the difference (i.e., one-dimension Euclidean distance) between the initial attribute-level of the partnering brands on durability (style) (i.e., D and x D ). y
Table 1: Experiment Conditions (the scores are out of 100)
Condition Perceived attribute-level of durability of L Perceived attribute-level of durability of C Perceived attribute-level of style of L Perceived attribute-level of style of C 1 70 50 50 70 2 70 50 40 70 3 70 40 50 70 4 70 40 40 70
That is, condition 1 is a small difference condition and condition 4 is a large difference condition. Conditions 2 and 3 are mixed with small and large difference conditions.
The participants were presented with two histograms showing previous durability and style perceptions of the two constituent brands. That is, the histogram showed a freguency chart of the perceived durability (or style) scores rated by one hundred users. After the participants read the chart, the perceived attribute-level was measured by the question, “I would expect the durability (style) of a product of L’s (C’s) (cf. PRK(1) in Eq. (1)) to be ” (i.e., from 0 to 100, see Rust et al., 1999; Geylani et al., 2008).
Besides, the weight of attribute importance of each attribute (cf. w in Eq. (1)) was measured by asking a K representative sample of consumers to divide 100 points between the two attributes, according to how important each attribute is to them. The number of points assigned to each attribute can be used as an indicator of the relative importance of that attribute (cf. Wilkie and Pessemier, 1973; Mackenzie, 1986).
An ad stimuli (motivated from Simonin and Ruth (1998) and Geylani et al. (2008)) that described the co-branding alliance came immedialtely after the presentation of histograms (see Appendix 1 for the advertisement). To clear short-term memory, subjects are asked to complete am unrelated filler task for about 10 minutes.
Then we measured the perceived mean of the co-branded product on both attribute dimensions (cf. PABK 1
in Eqs. (9) and (10)) by the following question: “I would expect the durability (style) of a product of L’s-C’s to be .”
Participants were asked again about the question listed above to express their perceived attribute-level of the partnering brands, and hence finally we can compute the CBBE (value) of the composite brand and the pre- and post-CBBE of the partnering brands, R i (cf. Eq. (1)).
4. Results (結果)
Prior to the experiment, three pretests were conducted to develop stimulus materials. The purpose of the first pretest is to assure that the participants know well about our histograms of perceived attribute-levels: a histogram was shown, and the exact counts in correspondence with the bins of the histogram were generated. Then the participants were asked if the intepretation of the histogram was clear to confirm that everyone realized how to read it (see Appendix 2 for the histogram). The result shows that all the participants (n=159) were able to recognize and answer the corresponding attribute-level in the histogram.
The purpose of the second pretest is to re-confirm that durability and style are important attributes of briefcases (see Appendix 3 for the 9-point likert scale). The result of the second pretest confirms the importance of durability and style when purchasing a briefcase (average rating of durability is 7.5; average rating of style is 7.12; n=49). Finally the third pretest is to assure that the participants know well about allocating the weight of attribute importance of each attribute. The result of the third pretest indicates that all the participants (n=49) successfully divided 100 points to the two attributes, namely durability and style respectively (see Appendix 4 for the allocation).
One hundred and nine undergraduate students partcipated in our experiment, and they are chosen from a large university in Taipei, Taiwan. In condition 1, the number of participants is twenty-six students; in condition 2, the number of participants is thirty students; in condition 3, the number of participants is twenty-four students; in condition 4, the number of participants is twenty-nine students.
Hypothesis 1 (H1) predicts that the equity of the co-brand is a weighted average of the pre-alliance equities of the partnering brands. Mathematically speaking, H1 argues that, for each participant, the CBBE of the co-brand (e.g., LC 1 ) is a weighted average of the CBBEs of the partnering brands ( and L 1 C 1 ). Due to the limitation of small sample size (i.e., in four conditions the sample sizes are all smaller than 36), we use the Kolmogorov-Smirnov one sample test (non-parametric analysis; similar to goodness-of-fit of chi-square test for a large sample size) to test our hypotheses in each condition. The drawback of this method is the lack of strong statistical power, and the implicit assumption of this method is the equal possibility of the two different outcomes: “a weighted average” and “not a weighted average”. That is, we check if
1 (1) )
1
( AB A B
or A(1)AB 1 B(1) for the outcome of “a weighted average”.
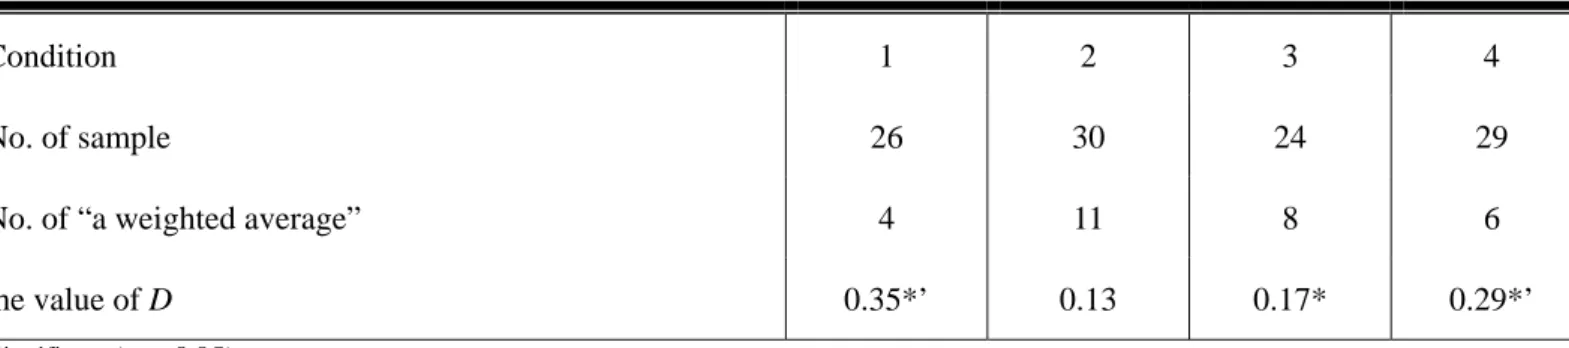
The results show that H1 is supported ( 0.05) in conditions 2 and 3 (D is 0.13 and 0.17 respectively). In condition 1 and 4, the value of D is 0.35 and 0.29 respectively, and therefore the results do not support H1. In conclusion, H1 is partly supported. Table 2 shows the testing results of H1.
Table 2: Testing Results of H1
Condition 1 2 3 4
No. of sample 26 30 24 29
No. of “a weighted average” 4 11 8 6
the value of D 0.35*’ 0.13 0.17* 0.29*’
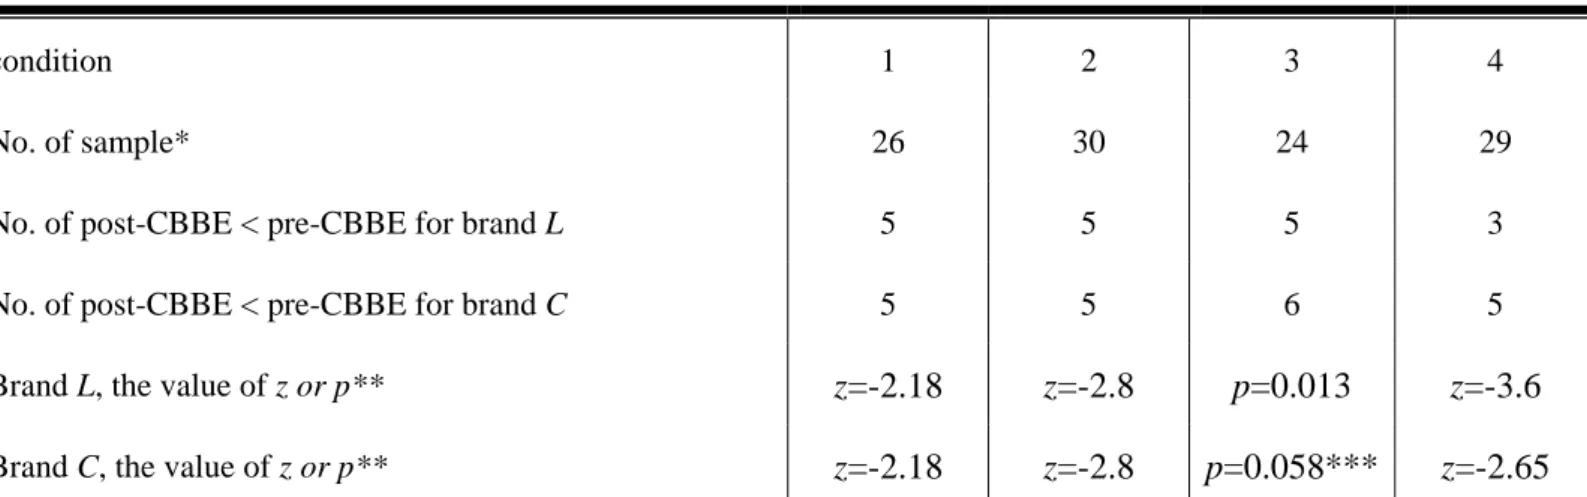
Hypothesis 2 (H2) predicts that, for one partnering brand, its post-alliance equity is smaller than its pre-alliance equity. Mathematically speaking, H2 claims that, for each participant, the CBBE of one partnering brand after the alliance (i=2) (e.g., L 2 for brand L) will be smaller than the CBBE before the alliance (i=1) (e.g., C 1 for brand C). Similarly, because of the limitation of small sample size, we use the
*Significant (0.05)
’Please note that the statistical significance here means that an apparent difference exists between the two outcomes, and in other words the
participants incline to conjecture that CBBE of the co-brand is not a weighted average of CBBE of partnering brands. Hence, conditions 1 and 4 do not support H1; conditions 2 and 3 support H1.
sign test (non-parametric analysis) to test H2 in each condition. The drawback of this method is the lack of strong statistical power. So, for H2, we check whether L 2 L(1) and C 2 C(1).
Surprisingly, H2 is not supported in most of the cases by our results ( 0.05), and is only supported for brand C in condition 3 (p=0.058). In condition 1, for brand L, z=-2.18; for brand C, z=-2.18. In condition 2, for brand L, z=-2.8; for brand C, z=-2.8. In condition 3, for brand L, p=0.013. In condition 4, for brand L,
z=-3.6; for brand C, z=-2.65. In conclusion, in most of the cases, the post-alliance CBBE is larger than the
pre-alliance CBBE for the partnering brand. Table 3 shows the testing results of H2.
Table 3: Testing Results of H2
condition 1 2 3 4
No. of sample* 26 30 24 29
No. of post-CBBE < pre-CBBE for brand L 5 5 5 3 No. of post-CBBE < pre-CBBE for brand C 5 5 6 5 Brand L, the value of z or p** z=-2.18 z=-2.8 p=0.013 z=-3.6
Brand C, the value of z or p** z=-2.18 z=-2.8 p=0.058*** z=-2.65
5. Discussion, Contribution, and Future Research Direction (討論、貢獻與未來研究建議)
According to the results of this study, H1 is partly supported. As we mentioned in section 2, currently in co-branding research, scholars have two completely different findings towards this issue. Park et al. (1996) found that a co-branding alliance with an attribute complementarity (i.e., product fit) could maximize the attitudinal favorability (i.e., 1+1>2); on the contrary, by using an expectancy-value modeling approach, Geylani et al. (2008) inferred that the co-brand may not always generate the synergy effect (i.e., 1+1<2). Our results confirm the two different arguments.
*The number of sample includes the equal value of post- and pre-CBBE. However, when testing the equal value (i.e., 0) will be deleted. **When the sample size is smaller than 25, we should use p instead of z.
Besides, from our experiment, the results also show that and H2 is not fully supported in all the cases. An explanation of our results can relate to the positive spillover effect – our findings do echo Hillyer and Tikoo (1995) and Washburn (2004). Hillyer and Tikoo (1995) have suggested that each of the partnering brands is able to increase its perceived value (e.g., CBBE) after the alliance. Following by this argument, Washburn et al. (p. 495, 2004) claimed that two high-equity brands paired together will each have higher brand-equity ratings than prior to the pairing.
In summary, we argue that both hypotheses are important since they are related to two essential decisions respectively: (1) the motives of forming a co-branding alliance and (2), once the partnership is established, the timing for one partnering brand not to sustain the partnership (cf. Venkatesh et al., 2000). Similar to Na et al. (1999), the current research tried to use a multi-attribute approach to build an attitudinal measure of brand equity; different from Washburn et al. (2000, 2004) and Geylani et al. (2008), we discuss the process of belief revisions in the context of co-branding and connect attitudinal favorability to the measure of consumer-based brand equity.
This research has two distinct contributions to the research field of strategic branding. First of all, to our knowledge, we are the first to connect the attitudinal favorability to the measure of consumer-based brand equity in co-branding context. Therefore, this study advances existing knowledge of brand value evaluation by offering this relatively simplified measure. Moreover, our experiment can provide a solid basis for further investigations on preference measurement (e.g., adaptive conjoint analysis (ACA), analytical hierarchy process (AHP)). For marketers, our promising implications will stem from the hypotheses.
A critical limitation of the present study is the small sample size. Due to this limitation, we use two methods of non-parametric analysis, and in doing so, we lose to have a strong statistical power of our tests. Besides, we did not measure the perceived standard deviation of attribute-level for each participant (cf. p.736, Geylani et al., 2008) in our experiment, and this could influence the statistical significance of H1 and H2. Future research could complete this task. Finally, in this study we always assume a better product fit (i.e., attribute complementarity) exists in a co-branding alliance. However, we do not investigate and discuss the changes of CBBE under the conditions of a congruent/similar brand pair (cf. Walchli, 2007) and an extremely
different brand pair (cf. Geylani et al., 2008), which are worthy of considerations in future studies.
References
Aaker, D. A. (1991), Managing Brand Equity. New York: The Free Press.
Ahluwalia, R. and Gurhan-Canli, Z. (2000), “The Effects of Extensions on the Family Brand Name: An Accessibility-Diagnosticity Perspective,” Journal of Consumer Research, 27(3), 371-381.
Amaldoss, W. and Rapoport, A. (2005), “Collaborative Product and Market Development: A Theoretical and Experimental Investigation,” Marketing Science, 24, 396-414.
Ambler, T. (2004), Marketing and the Bottom Line. London, United Kingdom: Prentice Hall.
Balachander, S. and Stock, A. (2009), “Limited Edition Products: When and When Not to Offer Them,”
Marketing Science, 28(2), 336-355.
Bass, F. M. and Talarzyk, W. W. (1972), “An Attitude Model for the Study of Brand Preferences,” Journal of
Marketing Research, 9(1), 93-96.
Baumgarth, C. (2004), “Evaluations of Co-brands and Spill-over effects: Further Empirical Results,” Journal
of Marketing Communications, 10(2), 115-131.
Besharat, A. (2010), “How Co-branding versus Brand Extensions Drive Consumers' Evaluations of New Products: A Brand Equity Approach,” Industrial Marketing Management, doi:10.1016/j.indmarman.2010.02.021.
Boonghee, Y. and Donthu, N. (1997), “Developing and Validating an Overall Brand Equity Scale,"
Proceedings of American Marketing Association, AMA Summer Educators’ Conference, Chicago, United
States.
Cooke, S. and Ryan, P. (2000), “Global and Transnational Brand Alliances: A Conceptual Investigation of Typologies,” Marketing in a Global Economy Proceedings, 336-342.
Geylani, T., Inman, J. J. and Hofstede, F. T. (2008), “Image Reinforcement or Impairment: The Effects of Co-branding on Attribute Uncertainty,” Marketing Science, 27(4), 730-744.
Hadjicharalambous, C. (2006), “A Typology of Brand Extensions: Positioning Cobranding as a Sub-case of Brand Extensions,” Journal of American Academy of Business, 10(1), 372-377.
Hao, W. (2008), Brand Alliances: An Examination of Partner Brand Selection in a Congruence Paradigm. Unpublished doctoral dissertation, Kent State University.
Hillyer, C. and Tikoo, S. (1995), “Effect of Cobranding on Consumer Product Evaluations,” Advances in
Consumer Research, 22(1), 123-127.
Hoeffler, S. and Keller, K. L. (2003), “The Marketing Advantages of Strong Brands,” Journal of Brand
Management, 10(6), 421-445.
James, D. (2005), “Guilty through Association: Brand Association Transfer to Brand Alliances,” Journal of
Consumer Marketing, 22(1), 14-24.
Kartono, B. and Rao, V. R. (2009), “Linking Consumer-based Brand Equity to Market Performance: An Integrated Approach to Brand Equity Management,” Johnson School Research Paper Series No. #23-09. Available at SSRN: http://ssrn.com/abstract=1401183.
Keller, K. L. (1993), “Conceptualizing, Measuring, and Managing Customer-based Brand Equity,” Journal
of Marketing, 57(1), 1-22.
Keller, K. L. and Lehmann, D. R. (2006), “Brands and Branding: Research Findings and Future Priorities,”
Marketing Science, 25(6), 740-759.
Lee, C.-L. and Decker, R. (2009), “Modeling the Effect of Belief Revisions on the Success of Co-branding,”
Journal of Applied Economic Sciences, 4(2), 235-253.
Leuthesser, L., Kohli, C. and Suri, R. (2003), “2+2=5? A Framework for Using Co-branding to Leverage a Brand,” Brand Management, 11(1), 35-47.
Mackenzie, S. B. (1986), “The Role of Attention in Mediating the Effect of Advertising on Attribute Importance,” Journal of Consumer Research, 13(2), 174-195.
Na, W. B., Marshall, R. and Keller, K. L. (1999), “Measuring Brand Power: Validating a Model for Optimizing Brand Equity,” Journal of Product and Brand Management, 8(3), 170-184.
Panda, T. K. (2002), “Strategic Advantage through Successful Co-branding,” Pratibimba, 2(2), 27-31.
Park, C. W., Jun, S. Y. and Shocker, A. D. (1996), “Composite Branding Alliances: An Investigation of Extension and Feedback Effects,” Journal of Marketing Research, 33(4), 453-466.
Park, C. W. and Srinivasan, V. (1994), “A Survey-based Method for Measuring and Understanding Brand Equity and Its Extendibility,” Journal of Marketing Research, 31(2), 271-288.
Rao, A. R., Qu, L. and Ruekert, R. W. (1999), “Signaling Unobservable Product Quality through a Brand Ally,” Journal of Marketing Research, 36(2), 258-268.
Rao, A. R. and Ruekert, R. W. (1994), “Brand Alliances as Signals of Product Quality,” Sloan Management
Rust, R. T., Inman, J. J., Jia, J. and Zahorik, A. (1999), “What You Don't Know About Customer-Perceived Quality: The Role of Customer Expectation Distributions,” Marketing Science, 18(1), 77-92.
Sheinin, D. A. (2000), “The Effects of Experience with Brand Extensions on Parent Brand Knowledge,”
Journal of Business Research, 49(1), 47-55.
Simonin, B. L. and Ruth, J. A. (1998), “Is a Company Known by the Company It Keeps? Assessing the Spillover Effects of Brand Alliances on Consumer Brand Attitudes,” Journal of Marketing Research, 35(1), 30-42.
Thorbjørnsen, H. (2005), ”Brand Extensions: Brand Concept Congruency and Feedback Effects Revisited,”
Journal of Product and Brand Management, 14(4), 250-257.
Van Osselaer, S. M. J. and Janiszewski, C. (2001), “Two Ways of Learning Brand Associations,” Journal of
Consumer Research, 28(2), 202-223.
Venkatesh, R., Mahajan, V. and Muller, E. (2000), “Dynamic Co-marketing Alliances: When and Why Do They Succeed or Fail,” International Journal of Research in Marketing, 17(1), 3-31.
Walchli, S. B. (2007), “The Effects of Between-partner Congruity on Consumer Evaluation of Co-branded Products,” Psychology and Marketing, 24(11), 947-974.
Washburn, J. H., Till, B. D. and Priluck, R. (2000), “Co-branding: Brand Equity and Trial Effects,” Journal of
Consumer Marketing, 17(7), 591-604.
Washburn, J. H., Till, B. D. and Priluck, R. (2004), “Brand Alliance and Customer-based Brand-equity Effects,” Psychology & Marketing, 21(7), 487-508.
Wilkie, W. L. and Pessemier, E. A. (1973), “Issues in Marketing’s Use of Multi-attribute Attitude Models,”
Appendix 2: Histogram Suppose you are planning to purchase brand U’s briefcase during this coming weekend. Brand U’s briefcase has only one product type. The perceived quality scores of 100 users of brand U’s briefcase are given below as a histogram. These scores in the histogram are out of one hundred, 100 being the highest score. The horizontal axis of the histogram gives the perceived quality score of brand U’s briefcase; the vertical axis shows the frequency of each of these scores occurred, that is how many people perceived the same score. 0 5 10 15 20 25 30 35 40 110 20 2 303 404 505 606 70 7 Frequency Perceived quality score of brand U’s briefcase This survey is about a purchase decision of a briefcase (公事包;背包) and is conducted by Prof. Chia‐Lin Lee at NCCU (政大). Please help to fill it out. Thanks!
According to this histogram you gave to this briefcase a quality score of _________ .
Appendix 3: Importance Check Suppose you are planning to purchase a briefcase tomorrow, how much importance would you give to each of the following two product‐related attributes? Durability (耐久性)
(1 indicates not important at all while 9 indicates extremely important)
1
2
3
4
5
6
7
8
9Style(風格)
(1 indicates not important at all while 9 indicates extremely important)
1
2
3
4
5
6
7
8
9
1 Appendix 4: Importance Allocation of Two Attributes Suppose you are planning to purchase a briefcase during this coming weekend. Brand L and C both have a good reputation on its briefcase products and brand L and C has only one product type of its briefcase respectively.
Now suppose you will choose and evaluate brand L’s and C’s briefcases by following two product attributes: durability and style, and if you can divide 100 points between the two attributes, according to how important each attribute is to them. How will you allocate those points? Attribute Importance Durability Style This survey is about a purchase decision of a briefcase and is conducted by Prof. Chia‐Lin Lee at NCCU. Please help to fill it out. Thanks!
1 Appendix 5: Experiment Questionnaire Suppose you are planning to purchase a briefcase during this coming weekend. Brand L and C both have a good reputation on its briefcase products and brand L and C has only one product type of its briefcase respectively.
Now suppose you will choose and evaluate brand L’s and C’s briefcases by following two product attributes: durability and style, and if you can divide 100 points between the two attributes, according to how important each attribute is to them. How will you allocate those points? Attribute Importance Durability Style This research is to study a purchase decision of a briefcase and it is conducted by Assistant Professor Chia‐Lin Lee at National Chengchi University. Please help to fill it out. Thank you for your help.
2 Now supposed the perceived durability scores of 100 users of brand L’s briefcase are given below as a histogram. These scores in the histogram are out of one hundred, 100 being the highest score. The horizontal axis of the histogram gives the perceived durability score of brand L’s briefcase; the vertical axis shows the frequency of each of these scores occurred, that is how many people perceived the same score. Supposed the perceived style scores of 100 users of brand L’s briefcase are given below as a histogram. According to this histogram you gave to L’s briefcase a durability score of _________ . According to this histogram you gave to L’ briefcase a style score of _________ . 0 10 20 30 40 1 2 3 4 5 6 7 0 10 20 30 40 1 2 3 4 5 6 7 40 50 60 70 80 90 100 frequency perceived durability score of brand L’s briefcase frequency perceived style score of brand L’s briefcase 20 30 40 50 60 70 80
3 Now supposed the perceived durability scores of 100 users of brand C’s briefcase are given below as a histogram. These scores in the histogram are out of one hundred, 100 being the highest score. The horizontal axis of the histogram gives the perceived durability score of brand C’s briefcase; the vertical axis shows the frequency of each of these scores occurred, that is how many people perceived the same score. Supposed the perceived style scores of 100 users of brand C’s briefcase are given below as a histogram. According to this histogram you gave to C’s briefcase a durability score of _________ . According to this histogram you gave to C’s briefcase a style score of _________ . 0 10 20 30 40 1 2 3 4 5 6 7 0 10 20 30 40 1 2 3 4 5 6 7 20 30 40 50 60 70 80 frequency perceived durability score of brand C’s briefcase frequency perceived style score of brand L’s briefcase 40 50 60 70 80 90 100
After you see the co‐branded L’s & C’s briefcase, You would expect The durability score of a product of L’s‐C’s to be The style score of a product of L’s‐C’s to be ** Fill in the grid so that every row, every column, and every 2 x 2 box contains the digits 1 through 4. There is only one solution. You can find it by logic.
After you see the co‐branded L’s & C’s briefcase, you would expect (1) The durability score of L’s briefcase to be The style score of L’s briefcase to be (2) The durability score of C’s briefcase to be The style score of C’s briefcase to be
Marketing Science 11- Acceptance of your
Abstract Submission
李嘉林 <[email protected]>
[email protected] <[email protected]>
2011年2月24日下午
9:53
回覆: [email protected]
收件者: [email protected]
The 2011 INFORMS Marketing Science Conference promises to be an exciting event,
with over 600 high-quality abstracts submitted and a number of very interesting special
sessions. We are pleased to accept the abstract of the paper on which you are the
primary presenter. Please communicate this information to your co-author(s), if any. The
quality and range of the abstracts point to an exciting conference ahead of us.
The conference will be held at the Intercontinental Hotel in Houston starting Thursday,
June 9, 2011, and ending the evening of Saturday, June 11, 2011. The Doctoral
Consortium, open for up to 100 registered doctoral students, precedes the conference.
REGISTRATION:
At this time we wish to remind you that the early registration deadline is March 15.
***All presenters need to register by this early deadline of March 15 for their papers to
be scheduled. This is a conference policy instituted as of 2004. Presenters that register
after March 15
thwill NOT be scheduled. Of course, you can still register later and attend
as a non-presenter.
Registration can be conducted on the Marketing Science Conference website. A link to
this site is provided below. INFORMS can also be contacted by e-mailing
[email protected]
, by phone
443-757-3591
or
1-800-446-3500
, by fax
443-757-3515
. For more information on the conference, check the conference webpage:
http://business.rice.edu/MarketingConference2011_registration.aspx
ACCOMMODATIONS:
Make your reservations now at the InterContinental Houston by phone, call
+1-713-627-7600
and mention Group Code GM1 and you will get the conference rate of $139 per
night or by going to the conference web page:
http://business.rice.edu/marketingconference2011_conference.aspx
If you require an invitation letter with the title of your paper please contact Ellen Tralongo
Appendix 6: INFORMS MARKETING SCIENCE CONFERENCE ACCEPTANCE LETTERThe Marketing faculty of Jesse H. Jones Graduate School of Business at Rice University
looks forward to hosting you in Houston, Texas in June!
ICABE REF 759
李嘉林 <[email protected]>
El. Thalassinos <[email protected]>
2011年6月24日下午10:57
收件者: [email protected]
Dear Colleague,
I am glad to inform you that your paper has been accepted for presentation in ICABE
2011. For all future contacts with the organizers make sure to refer to the unique
reference number 759 assinged to your submission.
Thank you for considering ICABE and ERSJ as a possible outcome of your scientific
research.
With my best regards,
Professor El Thalassinos
Chair Jean Monnet
University of Piraeus, Greece,
www.unipi.gr
Dept. of Maritime Studies,
www.maritime-unipi.gr
Karaoli & Dimitriou 40
185-34 Piraeus, Greece
tel:
+30-210-414-2543
or 2525
fax:
+30-210-414-2571
mobile:
+30-694-700-0960
General Editor, European Research Studies Journal
www.ersj.eu
Chairman, ICABE
www.icabe.gr
國科會補助專題研究計畫成果報告自評表
請就研究內容與原計畫相符程度、達成預期目標情況、研究成果之學術或應用價
值(簡要敘述成果所代表之意義、價值、影響或進一步發展之可能性)
、是否適
合在學術期刊發表或申請專利、主要發現或其他有關價值等,作一綜合評估。
1. 請就研究內容與原計畫相符程度、達成預期目標情況作一綜合評估
V 達成目標
□ 未達成目標(請說明,以 100 字為限)
□ 實驗失敗
□ 因故實驗中斷
□ 其他原因
說明:
2. 研究成果在學術期刊發表或申請專利等情形:
論文:□已發表 V 未發表之文稿 □撰寫中 □無
專利:□已獲得 □申請中 V 無
技轉:□已技轉 □洽談中 V 無
其他:(以 100 字為限)
3. 請依學術成就、技術創新、社會影響等方面,評估研究成果之學術或應用價
值(簡要敘述成果所代表之意義、價值、影響或進一步發展之可能性)(以
500 字為限)
本研究針對雙品牌下的品牌權益衡量進行研究:試圖建立一個行為基礎
的態度性衡量(measure),以及利用此衡量探討兩個研究假說,並利用實驗設
計的方法測試研究假說。
本研究在學術上有兩個主要貢獻:第一,利用期望價值模型連結品牌態度與
消費者基礎的權益;第二,本研究的態度性衡量為在雙品牌的消費者基礎權
益研究下的一個知識上的創新,在雙品牌研究領域具理論意涵。
即便本研究的研究假說僅獲得部分支持,成果仍可作為探討是否可放寬
研究假設(如改變品牌或產品契合度的強弱)
,並進一步發展適合的品牌權益
衡量。另外,本研究對台灣的品牌實務從業人員提供一個進行雙品牌聯盟前
的決策參考指標。
此研究為本人執行之第一個國科會研究計畫,並為本人第一次嘗試以實
驗設計的方法驗證數學模型的假說。因此,從本研究中,本人第一次學習如
何規劃與控制實驗設計法的研究期程。
本研究可經由改進實驗程序與加強理論的連結性後,發表至國際性的學
術期刊。
國科會補助計畫衍生研發成果推廣資料表
日期:2012/01/25國科會補助計畫
計畫名稱: 雙品牌下消費者基礎的品牌權益: 一個特定的態度性衡量 計畫主持人: 李嘉林 計畫編號: 99-2410-H-004-225- 學門領域: 行銷無研發成果推廣資料
99 年度專題研究計畫研究成果彙整表
計畫主持人:李嘉林 計畫編號: 99-2410-H-004-225-計畫名稱:雙品牌下消費者基礎的品牌權益: 一個特定的態度性衡量 量化 成果項目 實際已達成 數(被接受 或已發表) 預期總達成 數(含實際已 達成數) 本計畫實 際貢獻百 分比 單位 備 註 ( 質 化 說 明:如 數 個 計 畫 共 同 成 果、成 果 列 為 該 期 刊 之 封 面 故 事 ... 等) 期刊論文 0 0 100% 本 研 究 需 改 進 實 驗 對 象 的 樣 本 數 並 加 強 與 理 論 的 連 結 方 有 較 佳 的 發表機會;另外, 本 人 擬 將 目 前 研 究 成 果 發 表 在 今 年 七 月 韓 國 行 銷 學 會 在 首 爾 所 舉 行的 2012 Global Marketing conference,目前 正修訂文稿中。 研究報告/技術報告 0 0 100% 研討會論文 0 0 100% 篇 論文著作 專書 0 0 100% 申請中件數 0 0 100% 專利 已獲得件數 0 0 100% 件 件數 0 0 100% 件 技術移轉 權利金 0 0 100% 千元 碩士生 1 1 100% 博士生 0 0 100% 博士後研究員 0 0 100% 國內 參與計畫人力 (本國籍) 專任助理 0 0 100% 人次 期刊論文 0 0 100% 研究報告/技術報告 0 0 100% 研討會論文 0 0 100% 篇 論文著作 專書 0 0 100% 章/本 申請中件數 0 0 100% 專利 已獲得件數 0 0 100% 件 件數 0 0 100% 件 技術移轉 權利金 0 0 100% 千元 碩士生 0 0 100% 國外 參與計畫人力 (外國籍) 博士生 人次博士後研究員 0 0 100% 專任助理 0 0 100% 其他成果