國立交通大學
應用化學系碩士班
碩士論文
利用拉曼顯微光譜技術及成像法觀測紅球菌 SD-74
生物薄膜在原處的生長過程
In Situ Monitoring of Rhodococcus sp. SD-74 Biofilm
Development by Raman Microspectroscopy and Imaging
研究生:鄭伊庭
指導教授:重藤真介 博士
利用拉曼顯微光譜技術及成像法觀測紅球菌 SD-74
生物薄膜在原處的生長過程
In Situ Monitoring of Rhodococcus sp. SD-74 Biofilm Development by
Raman Microspectroscopy and Imaging
研究生:鄭伊庭 Student: Yi-Ting Zheng 指導教授:重藤真介 博士 Advisor: Dr. Shinsuke Shigeto
國 立 交 通 大 學 應用化學系碩士班
碩 士 論 文
A Thesis
Submitted to M. S. Program Department of Applied Chemistry
College of Science National Chiao Tung University in Partial Fulfillment of the Requirements
for the Degree of Master of Science in
Applied Chemistry July 2012
Hsinchu, Taiwan, Republic of China
利用拉曼顯微光譜技術及成像法觀測紅球菌 SD-74
生物薄膜在原處的生長過程
學生:鄭伊庭 指導教授:重藤真介 博士
國立交通大學應用化學系碩士班
摘要
在自然界中絕大部分的細菌生活在生物薄膜(Biofilm)中,在生物薄膜中細菌被包 埋在由胞外聚合物組成的基質中並貼附在表面上,最近的研究指出細菌以生物薄膜的形 態生活可以提高其存活率例如產生極高的抗藥性等等,雖然生物薄膜的特殊結構及功能 引起了各類科學上的興趣,在探討其在活體及在原處的化學特性仍是一大挑戰。 在 本 論 文 中 我 們 使 用 拉 曼 顯 微 光 譜 技 術 及 成 像 法 來 針 對 菌 種 紅 球 菌 SD-74 (Rhodococcus sp. SD-74)的生物薄膜及其生長過程做討論。拉曼光譜技術提供了許多 優點於在原處的生物薄膜研究,包括非破壞性、不需要特殊標記及不受來自水的訊號干 擾等。我們成功地獲得在生物薄膜生長過程的詳細分佈及組成改變資訊,我們發現隨著 生物薄膜的生長在基質中的類胡蘿蔔素濃度極巨的增加,為了解釋這個類胡蘿蔔素累積 的現象我們提出了一個假設:在此類胡蘿蔔伴演抗氧化的角色來對抗可能的氧化壓力, 而我們所做的在不同光照條件的拉曼成像實驗結果支持這個假設。In Situ Monitoring of Rhodococcus sp. SD-74 Biofilm
Development by Raman Microspectroscopy and Imaging
Student: Yi-Ting Zheng Advisor: Dr. Shinsuke Shigeto
M. S. Program, Department of Applied Chemistry
National Chiao Tung University
Abstract
Most bacteria in natural habitats live as biofilms, in which bacterial cells are embedded in matrices of extracellular polymeric substances adherent to a surface. Recent studies have revealed that the biofilm mode of living increases the survival rate of bacteria by e.g., acquiring extremely high antibiotic resistance. Although unique structures and functions of biofilms have attracted much attention in many disciplines of science, it remains challenging to study biofilms in vivo and in situ as well as with high chemical specificity. In the present study, we focus on the biofilms of the bacterial species of practical interest known as
Rhodococcus sp. SD-74 and monitor the process of its biofilm development using Raman
microspectroscopy and imaging. Because Raman spectroscopy is nondestructive and label-free, and is less hampered by the presence of water, Raman microspectroscopy and imaging are an ideal tool to study biofilms in situ. We successfully obtained detailed distribution and composition changes within R. sp. SD-74 biofilm during the development process. We found that the concentration of carotenoids in the biofilm matrix drastically increases as biofilm development proceeds. To interpret this phenomenon of carotenoid accumulation, we hypothesize that carotenoids act as an antioxidant in R. sp. SD-74 biofilms and counter possible oxidative stress. Raman imaging experiments performed under different light-illumination conditions support this hypothesis.
Acknowledgments
兩年的碩班生活隨著這本論文的完成而畫下了句點,在這段期間中我得到了許多人 在各個方面的幫助讓我能順利的完成學業,在此我想向他們表達我的感謝。首先我想感 謝我的指導教授重藤真介老師,在研究上老師給了我很多的建議及鼓勵,此外平時也很 照顧我們的生活,另外很感謝日本築波大學的 Nobuhiko Nomura 教授及 Masanori Toyofuku 提供此紅球菌 SD-74 菌種以及指導我如何培養生物薄膜和相關的討論。我要感 謝我的父母及家人對我的關愛及支持,感謝實驗室的學長學姊學弟學妹們平日的照顧, 與我共同努力,感謝在這兩年中所遇到的朋友讓我的生活多采多姿,最後我要感謝男友 張瑋瀚的陪伴及支持。
Tables of Contents
Abstract (in Chinese) ... i
Abstract (in English) ... ii
Acknowledgments ... iii
Tables of Contents ... iv
Lists of Figures and Table... v
Chapter I Introduction ... 1
Chapter II Experimental ... 8
II-1. Bacterial strain and growth condition ... 9
II-2. Preparation of biofilm samples ... 9
II-3. Confocal Raman microspectroscopy and imaging ... 10
II-4. Singular value decomposition ... 12
Chapter III Results and Discussion ... 18
III-1. Raman spectra of Rhodococcus sp. SD-74: planktonic versus biofilm forms ... 19
III-2. Chemical composition and distribution changes during biofilm development ... 20
III-2-1. Space-resolved Raman spectra ... 20
III-2-2. Multimode Raman images ... 21
III-3. Raman imaging of Rhodococcus sp. SD-74 biofilm under distinct light illumination conditions ... 23
III-3-1. Multimode Raman images ... 24
III-3-2. Possible origin of the carotenoid accumulation ... 25
Chapter IV Summary ... 36
Lists of Figures and Table
Figure I-1 Developmental model of biofilm formation ... 7
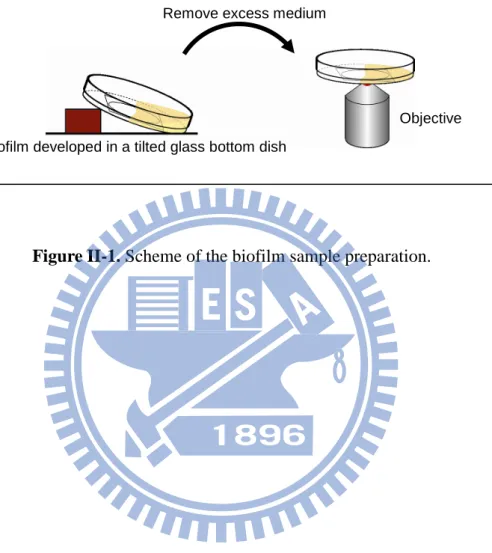
Figure II-1. Scheme of the biofilm sample preparation ... 14
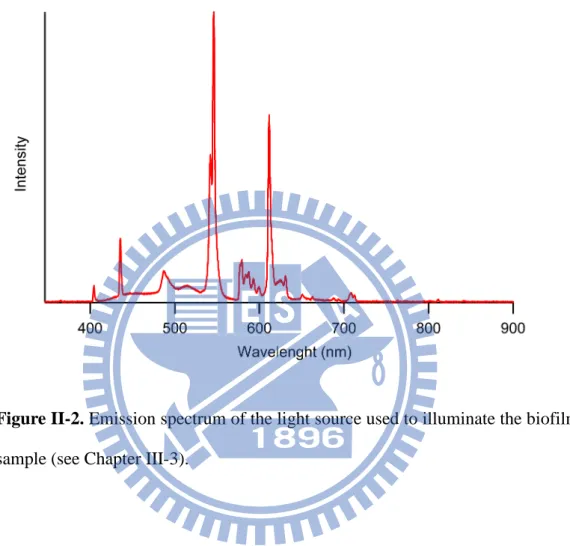
Figure II-2. Emission spectrum of the light source used to illuminate the biofilm sample ... 15
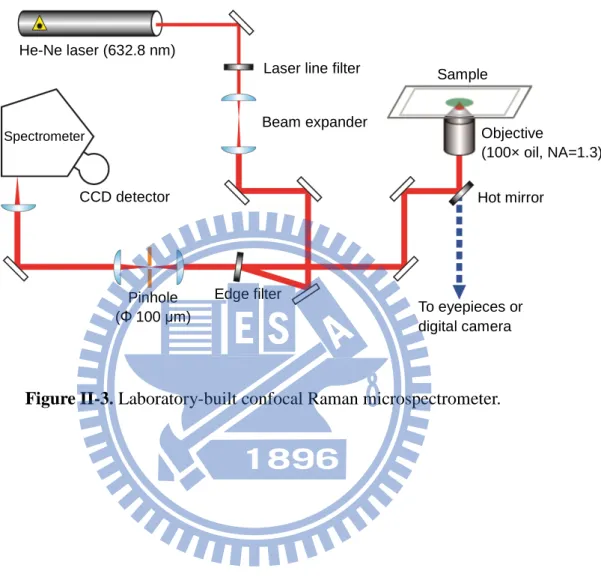
Figure II-3. Laboratory-built confocal Raman microspectrometer. ... 16
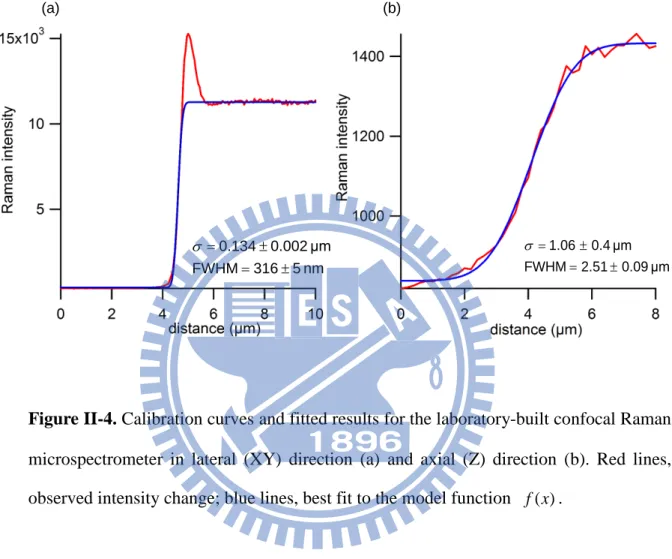
Figure II-4. Calibration curves and fitted results for the laboratory-built confocal Raman microspectrometer in lateral (XY) direction (a) and axial (Z) direction (b) ... 17
Figure III-1. Bright-field optical images of planktonic form (a) and biofilm (b) of Rhodococcus sp. SD-74. Scale bar measures 2 μm in a and 10 μm in b. ... 28
Figure III-2. Raman spectra of Rhodococcus sp. SD-74 in planktonic form (a) and in biofilm (b). ... 29
Figure III-3. Space-resolved Raman spectra of Rhodococcus sp. SD-74 biofilms developed for 1 (a), 3 (b), 5 (c), 7 (d), and 9 days (e). ... 30
Figure III-4. Multimode Raman images of Rhodococcus sp. SD-74 biofilms at the Raman shift of 782, 1004, 1157, 1452, 1516, and 1658 cm−1 at the development time of 1, 3, 5, 7, and 9 days. The first column shows bright-field optical images of the biofilms studied. ... 31
Figure III-5. Time dependence of averaged Raman band area intensities at 782, 1004, 1157, 1452, 1516, and 1658 cm−1 shown in Fig. III-4. ... 32
Figure III-6. Picture of the culture medium containing Rhodococcus sp. SD-74 under the stir conditions, which shows that the color of the medium becomes darker with culture time. ... 33 Figure III-7. Multimode Raman images of Rhodococcus sp. SD-74 biofilms at the Raman
periods of 1, 3, and 5 days under the dark (a) and bright (b) conditions. The first column shows bright-field optical images of the biofilms studied ... 34 Figure III-8. Time dependences of averaged Raman band area intensities at 782, 1004, 1157,
1452, 1516, and 1658 cm−1 shown in Fig. III-6, under the dark (blue, closed circle) and bright (red, open circle) conditions ... 35 Table III-1. Band assignments for Raman spectra of Rhodococcus sp. SD-74 in its planktonic
Chapter I
Introduction
In nature, a majority of bacteria occur as biofilms. Biofilms can be defined broadly as communities of microorganisms which attach to a surface [2-4]. Whereas those that live in a flowing fluid (planktonic bacteria) can move freely and are well isolated from each other, bacteria in biofilms form aggregates which a large population inhabits closely. The architecture of the aggregate is made up of extracellular polymeric substances (EPSs). EPSs include a wide range of bio-molecules such as polysaccharides, proteins, glycoproteins, extracellular DNA (eDNA), lipids, phospholipids, and so on [5]. These substances are self-produced by the bacteria residing in the biofilm, and the compositions of EPSs vary during biofilm development according to the environment and bacterial species. The biofilm development process takes place in four steps (Fig. I-1, adapted from Ref. [1]): planktonic (flow-free) bacterial attachment, microcolony formation, macrocolony formation, and final dispersal back to the planktonic bacteria, forming a cycle [6-8].
Forming biofilms is advantageous to the survival of bacteria. Biofilms can protect bacteria from various types of stress such as treatment with biocides, lack of nutrition, and shear force. Therefore, they raise many serious clinical and environmental issues [9-11]. In the medical field, biofilms that remain on the inner wall of a catheter are known as a major cause of bacterial infection because of their high antibiotic resistance. In industry, adhesion of biofilms in pipes and reactors may lead to biocorrosion. On the other hand, biofilms benefit our society as well. For instance, wastewater treatment plants utilize biofilms [12, 13]. Some
bacterial species in their biofilms are known to be effective in bioremediation; they can be used to decompose fuel oil released in the ocean as a result of an oil spill. Due to the importance in diverse fields of science, biofilms have been studied extensively in recent years in terms of biofilm constituents, their formation mechanism, unique functions, and so on [14-16].
In the present study, we focus on biofilms formed by the bacterial species Rhodococcus
sp. SD-74 and its biofilm development process using Raman microspectroscopy and imaging.
Rhodococcus sp. SD-74 was isolated from an alkaline soil sample collected at Sado Island,
Niigata Prefecture, Japan and was first described in 1989 [17]. Rhodococcus sp. SD-74 is an aerobic and gram-positive bacterium. Rhodococcus sp. SD-74 has a short rod shape of 0.4–0.6 μm in diameter and 0.8–1.5 μm in length [17]. This strain belongs to genus Rhodococcus, which has been well studied because it is capable of producing diverse organic molecules and surface-active lipids [18-22]. In particular, Rhodococcus sp. SD-74 can produce a great amount of succinoyl trehalose lipids (STL) from n-alkane in petroleum as the carbon source [23]. STL is a potential glycolipid that can be used as a biosurfactant, agent for bioremediation, and drug. Although the biofilms of Rhodococcus sp. SD-74 are highly important for microbial production of such useful biomaterials, little has been done so far to study the biofilms in vivo and in situ and to characterize them at the molecular level. It still remains unclear how the chemical compositions and distributions within the Rhodococcus sp.
SD-74 biofilm vary with biofilm development as well as how such changes are related to biofilm functions.
To address those issues, we employ Raman microspectroscopy and imaging. This approach bears many advantages over other conventional methods, making it ideal for in situ investigations of biofilms. First, it is nondestructive and less invasive compared to mass spectrometry and high-performance liquid chromatography, which in principle destroy biofilm matrices and lose space specificity. Second, Raman microspectroscopy requires no labeling of certain target molecules unlike fluorescence microscopy, so that detailed information about complex chemical compositions in biofilms can be obtained irrespective of whether the molecular species has already been identified or not. Finally, water, which is ubiquitous in biological samples, hinders Raman measurements to a lesser extent than IR measurements due to relatively small Raman cross-sections of the water vibrations. Therefore, biofilm samples containing water can be measured in situ without any sample pretreatment such as dehydration.
The remainder of this thesis is organized as follows. In Chapter II, the experimental procedures for biofilm growth and Raman measurements are described in depth. Emphasis is placed on our laboratory-built confocal Raman microspectrometer. Denoising of Raman spectral data acquired with a short exposure time based on singular value decomposition (SVD) is explained as well. In Chapter III, results of Raman microspectroscopy and imaging
of Rhodococcus sp. SD-74 biofilms are presented and discussed. In the first part of Chapter III, Raman spectra of the two living types of Rhodococcus sp. SD-74, namely, planktonic form and biofilms, are compared. In the second part of Chapter III, Raman monitoring of the biofilm development process is demonstrated. Space-resolved Raman spectra and Raman images of Rhodococcus sp. SD-74 biofilms were obtained at five different times during its development (1, 3, 5, 7, and 9 days), and the following three results have emerged.
(1) There were no significant changes in Raman spectral feature during the biofilm development.
(2) Biofilms constituents detected in the Raman spectra can be divided into three groups: carotenoids, DNA, and admixtures of proteins and lipids. The distributions of these three groups showed different characteristics.
(3) The concentration of carotenoids showed a marked increase with biofilm development. A similar trend was also observed for DNA. In sharp contrast, the concentration of proteins and lipids just showed fluctuation with time (i.e., no apparent time evolution).
To interpret the observed accumulation of carotenoids in Rhodococcus sp. SD-74 biofilms, we hypothesized that carotenoids may act as an antioxidant in the biofilms. To test this hypothesis, a comparison is made between Raman imaging experiments performed under different light illumination conditions. The results are presented and discussed in the last part of Chapter III, which are consistent with the hypothesis. The phenomenon of carotenoid accumulation
suggests that oxidative stress may be increased during the biofilm development possibly due to nutritional depletion. A summary is given in Chapter IV.
Chapter II
Experimental
II-1. Bacterial strain and growth condition
Rhodococcus sp. SD-74 was kindly provided by Professor Nobuhiko Nomura
(University of Tsukuba, Japan) [17, 23]. This strain was pre-cultured on a PMY agar plate at 30 °C for 1.5 days. After that, it was maintained at 4 °C. PMY agar medium contained 1.0% (v/v) glycerol, 0.5% (w/v) polypepton (Laboratorios CONDA), 0.3% yeast extract (Acumedia), 0.3% malt extract (Bacto), 0.1% KH2PO4, 0.1% K2HPO4, and 1.5% agarose (YEASTERN BIOTECH CO., LTD.). Besides, the pH of the medium was adjusted to 7.0 using KOH.
II-2. Preparation of biofilm samples
A single colony of Rhodococcus sp. SD-74 was picked up from the PMY agar plate and cultured in a tilted glass bottom dish (MatTek; P35G-1.5-20-C) containing 2 mL of TSB medium (Bacto) (Fig. II-1). Rhodococcus sp. SD-74 grew and formed biofilms at the air–medium interface in an incubator in which the temperature was set to 30 °C and high humidity was maintained. Biofilms were allowed to develop for different periods (1, 3, 5, 7 and 9 days) and under different illumination conditions (dark and bright). In the bright condition, a compact fluorescent lamp (Philips; 929689958698) was used to illuminate the biofilm sample with white light (~30 W/m2). The emission spectrum of the lamp is shown in Fig. II-2. Before Raman spectral measurements, excess culture medium was gently removed from the edge of the dish by a pipette, leaving biofilms on the glass bottom dish. This dish
was directly transferred to the microscope stage for subsequent Raman measurements. After measurements, the sample was discarded.
II-3. Confocal Raman microspectroscopy and imaging
Raman spectral acquisition and imaging experiments were performed with a laboratory-built confocal Raman microspectrometer (Fig. II-3) [24]. The 632.8 nm output of a He–Ne laser (Thorlabs) was used as the Raman excitation light. The laser beam was magnified by a factor of ~2.7 in order to cover the exit pupil of the objective used and to better use a high NA of the objective. The expanded beam was introduced to a custom-made inverted microscope (Nikon) by a pair of an edge filter (Semrock) and a hot mirror (KJ). This microscope was modified from a TE2000-U microscope in collaboration with Nikon engineers. The beam was focused onto the sample by an oil-immersion objective (CFI Plan Fluor; 100×, NA = 1.3). Back-scattered light was collected by the same objective and guided along the opposite direction to the incoming path. Rayleigh scattering and anti-Stokes Raman scattering were eliminated by the edge filter with high blocking of OD > 7, and only Stokes Raman scattering was transmitted.
Stokes Raman scattering light was first focused onto a 100 μm pinhole by a 150 mm lens and then collimated by another 150 mm lens. This confocal setup enables the elimination of light coming from off-focal positions and achieved an axial (Z) resolution of 2.4 μm (see below for details about how we obtained this number). Stokes Raman scattering light was
dispersed by an imaging spectrometer (HORIBA Scientific; iHR320) and detected by a back-illuminated, deep-depletion, liquid-N2 cooled CCD detector (Princeton Instruments; Spec-10:100) with 100 × 1340 pixels operating at −120 °C. A 600 grooves/mm grating was used to cover a wide spectral range (> 2000 cm−1) with an effective spectral resolution of 7 cm−1. For bright-field observation, the sample was illuminated by a halogen lamp and optical images were acquired by a digital camera (Nikon; DS-Ri1) equipped with the microscope.
In Raman imaging experiments, a high-precision piezoelectric nanopositioning stage (PI; P-563.3CD) equipped on the microscope stage was used to translate the sample horizontally. In the present study, the sample was translated by 16 μm with a 0.4-μm step in both X and Y directions (41 × 41 pixels). Spectral acquisition was synchronized with sample scanning by the computer program LabVIEW (National Instruments).
For the purpose of avoiding possible photobleaching and heating effects induced by laser irradiation, experimental data were acquired under conditions of low laser power (2.6 mW at the sample point) throughout the present study and sufficiently short exposure time (1 s per pixel) in Raman imaging experiments.
Lateral and axial resolutions were estimated by using intensity profiles of selected Raman bands. Calibration results are shown in Fig. II-3. By scanning the laser spot continuously to cross an interface that is assumed to be infinitely sharp, we can obtain a plot of the intensity of a given Raman band versus the distance. This distance profile of Raman
intensity is fit to a model function f(x). f(x) is equal to a Heaviside function convoluted with a Gaussian function [25]:
( )
x N erf x a C f + − + = σ 2 1 2 (II-1) where erf stands for the error function. A Gaussian bandwidthσ
derived from the fitted result was used to determine the spatial resolution based on the following relation:σ
2
ln
2
2
resolution
=
. (II-2)In lateral direction, a sharp edge of silicon wafer was chosen as an interface with respect to air for resolution determination. The intensity of a second-order phonon band of silicon at 520 cm−1 was used to plot a calibration curve (Fig. II-4a). In contrast, axial resolution was determined at a glass–indene interface. The intensity of a Raman band of indene at 1018.3 cm−1 was used to plot a calibration curve (Fig. II-4b).
II-4. Singular value decomposition
In a Raman imaging experiment, a large number of Raman spectra needs to be acquired within a short period of time (1681 spectra within ~30 min in the present case). To reduce noise in the spectra acquired with a short exposure time, singular value decomposition (SVD) analysis was performed [26, 27]. SVD is a purely mathematical procedure that decomposes a real m × n matrix A according to the following equations (II-3 to II-7): [28]
T UWV A= , (II-3) n I VV V V U UT = T = T = , (II-4)
) ,..., , ( diagσ1 σ2 σn = W , (II-5) 0 ... 2 1≥σ ≥ ≥σn ≥ σ , (II-6)
( )
r
rank
A
=
, σr+1=σr+2=...=σn =0. (II-7)Here U is an m × n column-orthonormal matrix, and VT is an n × n orthonormal matrix. The diagonal elements of W are non-negative and called singular values. In this work, the first 500 pixels of Raman spectra, corresponding to 2800–2000 cm−1, were removed to increase computational accuracy and to save time. Raman spectra in the remaining 840 pixels (2000–290 cm−1), which covers the fingerprint region and is of our interest, were arranged according to mapped positions to construct an 840 × 1681 matrix A. The matrices U and VT represent the spectral and positional matrices, respectively. The singular value of each component was used to decide whether the contribution of the component to the original matrix is significant or not. Components of U and VT associated with small singular values were neglected when doing reconstruction of the matrix A. The number of singular values used for reconstruction depends on images, but it was less than 10 in all cases. The SVD was computed in Igor Pro (WaveMetrics) using LAPACK routines.
Biofilm developed in a tilted glass bottom dish
Figure II-1. Scheme of the biofilm sample preparation.
Remove excess medium
Figure II-2. Emission spectrum of the light source used to illuminate the biofilm
He-Ne laser (632.8 nm)
Laser line filter Beam expander Hot mirror Edge filter Spectrometer Pinhole (Φ 100 μm) CCD detector To eyepieces or digital camera
Figure II-3. Laboratory-built confocal Raman microspectrometer.
Sample
Objective
(a) (b) nm 5 316 FWHM μm 0.002 0.134 ± = ± = σ μm 0.09 2.51 FWHM μm 0.4 1.06 ± = ± = σ
Figure II-4. Calibration curves and fitted results for the laboratory-built confocal Raman
microspectrometer in lateral (XY) direction (a) and axial (Z) direction (b). Red lines, observed intensity change; blue lines, best fit to the model function f(x).
Chapter III
III-1. Raman spectra of Rhodococcus sp. SD-74: planktonic versus biofilm forms
Under the static culture conditions, Rhodococcus sp. SD-74 shows two types of the living form: planktonic form and biofilms (Fig. III-1). In the planktonic form (Fig. III-1a), the bacterium can move freely in the medium and usually occurs as a single cell unless it undergoes cell division. In contrast, bacterial cells in the biofilm (Fig. III-1b) adhere to the glass surface of the culture dish and often form a colony. To examine chemical compositions of R. sp. SD-74 cells in its planktonic and biofilm states, we measured their Raman spectra (Fig. III-2). The assignments of the Raman bands observed in Fig. III-2 are summarized in Table III-1 [29-31]. The Raman spectrum of the planktonic R. sp. SD-74 cell (Fig. III-2a), although noisy, shows prominent Raman bands at 1649, 1440, 1001, and 782 cm−1. The Raman band at around 1650 cm−1 is assigned to a combination of the cis-C=C stretching mode of lipids and the amide I mode of proteins [30]. The Raman band at ~1440 cm−1 is attributable to the CH2 scissoring (1439 cm−1) and CH3 degenerate deformation (1456 cm−1) modes of both proteins and lipids. The 1001 cm−1 band is due to the ring breathing vibration of phenylalanine residues in proteins. The band at 782 cm−1 is assigned to the O–P–O symmetric stretch plus contributions of cytosine and thymine vibrational modes [31], characteristic of DNA.
The Raman spectrum of the biofilm (Fig. III-2b) shows a clearly distinct pattern from that of the planktonic cell. In addition to the same Raman bands as observed in the planktonic
spectrum, much more intense bands appear at 1004, 1157, and 1516 cm−1. All these features are well-known Raman bands of carotenoids: C=C stretch (1516 cm−1), C–C stretch (1157 cm−1), and in-plane CH3 rocking (1004 cm−1). It is interesting to note that carotenoids are detected only when R. sp. SD-74 forms aggregates.
III-2. Chemical composition and distribution changes during biofilm development
Biofilm development is intrinsically a dynamic process in which not only chemical compositions but also the distributions of the biofilm constituents within the matrix vary drastically with time. To monitor such spatiotemporal evolution of the biofilm constituents during biofilm development in situ, we first performed space-resolved Raman spectral measurements with a sufficiently long exposure time to achieve a high signal-to-noise ratio (S/N). We focus on the behavior of the Raman bands of carotenoids at 1516, 1157, and 1004 cm−1. We then performed multimode Raman imaging to study the spatial distribution of carotenoids as well as other biofilm constituents, and its temporal evolution.
III-2-1. Space-resolved Raman spectra
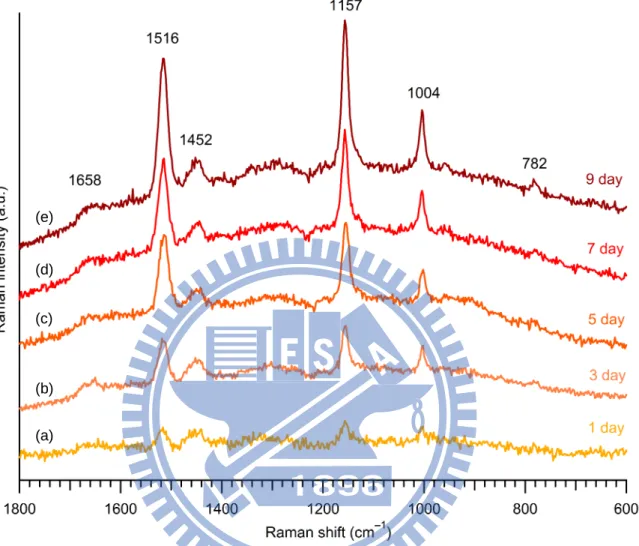
Raman spectra recorded with a long acquisition time have a high S/N and show clear spectral features. Figure III-3 shows Raman spectra of Rhodococcus sp. SD-74 biofilms grown for different periods (1, 3, 5, 7, and 9 days). These spectra were measured at around the center of the biofilm matrix. Note that the five biofilms were all different. For various reasons, it was difficult for us to trace the development of one particular biofilm for such a long time
as 9 days. We make a comparison between these five spectra based on the spectral pattern and relative Raman band intensity, which represent differences in chemical composition and differences in relative concentration, respectively. First, let us consider the chemical composition change in the biofilm during its development. The five spectra show nearly the same spectral pattern as in Fig. III-2a (see Table III-1 for band assignments) and do not change up to 9 days, indicating that there were no significant changes in both chemical components and their environments in the biofilm.
Second, consider the relative concentration changes of each component in the biofilm. Remarkably, the intensities of the carotenoid Raman bands increase with the biofilm growth time. This observation indicates that the carotenoid concentration in the biofilm increased with biofilm development. Besides, the band at 782 cm−1, which arises from DNA, shows a similar tendency to those of carotenoids. Namely, their intensity increased slightly as R. sp. SD-74 biofilm developed. In contrast, bands at 1452 and 1658 cm−1, which are assigned to both proteins and lipids, do not show clear time dependence.
III-2-2. Multimode Raman images
Although the space-resolved Raman spectra shown in Fig. III-3 allow us to glimpse the dynamic changes of the biofilm constituents, they cannot provide information on their spatial distributions. To determine in a quantitative manner how the spatial distributions change with biofilm development, we performed Raman imaging experiments on Rhodococcus sp. SD-74
biofilms at 1, 3, 5, 7, and 9 days. We use band area intensities of six Raman bands at 782, 1004, 1157, 1452, 1516, and 1658 cm−1 to construct a series of biofilm Raman images at 1, 3, 5, 7, and 9 days. The Raman images thus obtained are shown in Fig. III-4, together with the optical images of the biofilms. Because each band exhibits a dramatic variation in area intensity, we adopt different color scales for different Raman images. Red color in Raman images indicates the highest intensity and purple color indicates the lowest intensity. In this way, we are able to compare the concentration change of each component during biofilm development.
As in the previous discussion, we classify six Raman bands into three groups: carotenoids, DNA, and admixtures of proteins and lipids. Unlike the Raman images of proteins and lipids, which display an almost uniform pattern of concentration distribution within the biofilm, the concentration distributions of carotenoids and DNA are found to be more inhomogeneous. To best see this, compare the Raman images at 7 and 9 days in Fig. III-4. No appreciable difference is seen between the optical images of the biofilms at 7 and 9 days. However, the corresponding Raman images of carotenoids and DNA do show a complicated, highly inhomogeneous pattern inside the biofilms.
Figure III-5 shows the dependence of the averaged Raman intensities of the three components (carotenoids, DNA, and proteins and lipids) on biofilm development time. Because the size of biofilm differs from time to time as shown in the optical images in Fig.
III-4, we select the first 500 pixels for each Raman image which give large intensities of the 1516 cm−1 band and average the intensities at those 500 pixels to plot the time dependence. Error bars shown in Fig. III-5 were estimated from standard deviations of the 500 values. The same averaging protocol was employed for all development times. As shown in Fig. III-5, the concentration changes derived from the Raman images show the same tendency as space-resolved Raman spectra: the concentrations of carotenoids and DNA increase with the development time, whereas that of proteins and lipids does not show a noticeable increase.
At this point, we asked why the concentration of carotenoids increases as the
Rhodococcus sp. SD-74 biofilm develops. Carotenoids are common pigments that are widely
found in nature and play important roles in many species [32]. Functions of carotenoids include light harvesting in photosynthesis, antioxidation, and structural factor in purple bacteria [33, 34]. In the course of our investigation, we observed that the color of the culture medium containing R. sp. SD-74 in a tube under the stir conditions became darker with culture time (Fig. III-6). In both stir and static culture conditions, we did not supply fresh medium. This observation leads us to hypothesize that carotenoids observed in Rhodococcus
sp. SD-74 biofilm act as an antioxidant and that the increase in their concentration may be a
consequence of some oxidative stress induced by nutrition deficiency in the biofilm during its development.
conditions
To test our hypothesis, we performed Raman imaging experiments on Rhodococcus sp. SD-74 biofilms that were allowed to develop under different oxidative stress conditions, namely, different light illumination conditions. Intensive light illumination has been shown to generate high levels of reactive oxygen species (ROSs), such as O2−, H2O2, and •OH, in bacteria [35, 36]. These oxygen species are unstable due to the lack of electrons, so they are prone to react readily with most of bio-molecules and lead to oxidation. Once the concentration of ROSs becomes higher than the bacterial defense capacity level, they induce oxidative stress and in some cases cause serious damages to bacterial cells [37-39].
In the experiments, we continuously illuminated biofilm samples with the emission from a compact fluorescent lamp. Because we did not intend to kill the bacteria, light intensity applied was adjusted to be not very high (~30 W/m2) [40]. Control experiments were also performed without light illumination (dark condition).
III-3-1. Multimode Raman images
Figure III-6 displays multimode Raman images of R. sp. SD-74 biofilms developed for 1, 3, and 5 days under dark (control) and bright conditions. As shown in Fig. III-7, there is no appreciable difference in molecular distributions between the two conditions. In contrast, temporal concentration changes are quite different between the two conditions. Using the same method as described earlier, we calculate averaged Raman intensity of each band at each
time. The time profiles of the averaged Raman intensities of the six bands under the dark and bright conditions are compared in Fig. III-8. From Fig. III-8, we find the following:
(1) The concentration of carotenoids increased with a very similar rate in both dark and bright conditions. More importantly, the concentration of carotenoids was always higher under the bright conditions than under the dark conditions.
(2) The Raman bands attributable to proteins and lipids (1452 and 1658 cm−1) appear to be independent of illumination conditions.
(3) The DNA band at 782 cm−1 increased slightly in the control experiment but did not increase when the samples were continuously illuminated by the lamp.
III-3-2. Possible origin of the carotenoid accumulation
In this section, we discuss plausible accounts for the carotenoid accumulation observed in Rhodococcus sp. SD-74 biofilms. According to our hypothesis, carotenoids in the present case are acting as an antioxidant. Because oxidative stress induced in the biofilm is considered to be greater under the bright conditions than under the dark conditions, a larger amount of ROSs might be generated in the former case, which requires a larger number of antioxidants, namely, carotenoids, to protect essential bio-molecules from highly reactive ROSs. Therefore, we can anticipate that the concentration of carotenoids under the bright conditions is higher than under the dark conditions. This is exactly what we see in the top panel of Fig. III-8, and the experimental results support our hypothesis. We conclude that the concentration of
carotenoids and the extent of oxidative stress in Rhodococcus sp. SD-74 biofilms are positively correlated. The increase of carotenoids with biofilm development implies that oxidative stress increases with time under the present culture conditions and that the bacterium utilizes carotenoids to counter this effect.
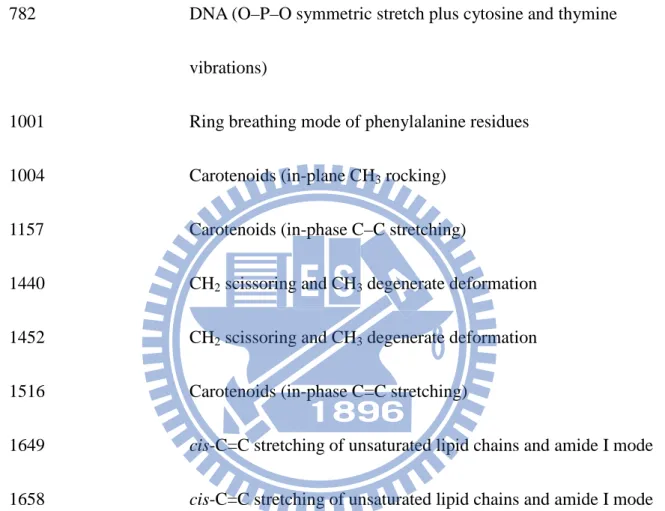
Table III-1. Band assignments for Raman spectra of Rhodococcus sp. SD-74 in its planktonic
and biofilm forms.
Wavenumber (cm−1) Assignment
782 DNA (O–P–O symmetric stretch plus cytosine and thymine vibrations)
1001 Ring breathing mode of phenylalanine residues 1004 Carotenoids (in-plane CH3 rocking)
1157 Carotenoids (in-phase C–C stretching)
1440 CH2 scissoring and CH3 degenerate deformation 1452 CH2 scissoring and CH3 degenerate deformation 1516 Carotenoids (in-phase C=C stretching)
1649 cis-C=C stretching of unsaturated lipid chains and amide I mode
(a) Planktonic form (b) Biofilm
Figure III-1. Bright-field optical images of planktonic form (a) and biofilm (b) of
Figure III-2. Raman spectra of Rhodococcus sp. SD-74 in planktonic form (a) and in
biofilm (b).
(b)
Figure III-3. Space-resolved Raman spectra of Rhodococcus sp. SD-74 biofilms
developed for 1 (a), 3 (b), 5 (c), 7 (d), and 9 days (e).
(e) (d) (c)
(b) (a)
782 1004 1157 1516 1452 1658 1 day 3 day 5 day 7 day 9 day
Carotenoids DNA Admixture of proteins and lipids
Figure III-4. Multimode Raman images of Rhodococcus sp. SD-74 biofilms at the
Raman shift of 782, 1004, 1157, 1452, 1516, and 1658 cm−1 at the development time of 1, 3, 5, 7, and 9 days. The first column shows bright-field optical images of the biofilms studied. All the images presented here have the same size, i.e., 41 × 41 pixels (16 × 16 μm2 ), for consistency. Band area intensity High Low
1516 cm−1 1157 cm−1 1452 cm−1 1658 cm−1 782 cm−1 1004 cm−1
Figure III-5. Time dependence of averaged Raman band area intensities at 782, 1004,
1157, 1452, 1516, and 1658 cm−1 shown in Fig. III-4.
Carotenoids
Proteins plus lipids
1 day 2 day 3 day Cultured time
Figure III-6. Picture of the culture medium containing Rhodococcus sp. SD-74
under the stir conditions, which shows that the color of the medium becomes darker with culture time.
1 day
3 day
5 day
Carotenoids DNA Admixture of proteins and lipids
Band area intensity High Low 1 day 3 day 5 day 782 1004 1157 1516 1452 1658
Figure III-7. Multimode Raman images of Rhodococcus sp. SD-74 biofilms at the
Raman shift of 782, 1004, 1157, 1452, 1516, and 1658 cm−1 with the development periods of 1, 3, and 5 days under the dark (a) and bright (b) conditions. The first column shows bright-field optical images of the biofilms studied. All the images presented here have the same size, i.e., 41 × 41 pixels (16 × 16 μm2), for consistency.
(a) Dark
1516 cm−1 1157 cm−1 1452 cm−1 1658 cm−1 782 cm−1 1004 cm−1
Figure III-8. Time dependences of averaged Raman band area intensities at 782, 1004,
1157, 1452, 1516, and 1658 cm−1 shown in Fig. III-6, under the dark (blue, closed circle) and bright (red, open circle) conditions.
Carotenoids
Proteins plus lipids
DNA 1516 cm−1
Chapter IV
Summary
In the present study, we have investigated in vivo the biofilm development process of
Rhodococcus sp. SD-74 by using Raman microspectroscopy and imaging. First, we explored
Raman spectral differences between planktonic form and biofilm of this species. We then examined changes with biofilm development time in the concentration of each biofilm component. We found that the concentration of carotenoids within the biofilm drastically increases as the biofilm develops. To interpret this phenomenon of carotenoid accumulation during biofilm development, we hypothesized that carotenoids are used as an antioxidant and that its increase serves to be a preventive mechanism for the survival of Rhodococcus sp. SD-74 against oxidative stress. This hypothesis was supported by Raman imaging experiments performed under conditions where the biofilm samples were continuously illuminated by a fluorescent lamp. More spectroscopic measurements and microbiological studies are needed to gain deeper insight into the biological significance of our findings. Nevertheless, the present study has demonstrated that Raman imaging, combined with conventional biochemical assays, offers a new opportunity to study the functions of bacterial biofilms in vivo and in situ.
References
[1] R. D. Monds and G. A. O’Toole, "The developmental model of microbial biofilms: ten years of a paradigm up for review", Trends in Microbiology, Vol. 17, pp. 73-87, 2009. [2] J. W. Costerton, et al., "Microbial biofilms", Annual Review of Microbiology, Vol. 49,
pp. 711-745, 1995.
[3] P. Watnick and R. Kolter, "Biofilm, city of microbes", Journal of Bacteriology, Vol. 182, pp. 2675-2679, 2000.
[4] P. Stoodley, et al., "Biofilms as complex differentiated commuities", Annual Review of Microbiology, Vol. 56, pp. 187-209, 2002.
[5] H. C. Flemming, T. R. Neu, and D. J. Wozniak, "The EPS matrix: the "house of biofilm cells"", Journal of Bacteriology, Vol. 189, pp. 7945-7947, 2007.
[6] G. O’Toole, H. B. Kaplan, and R. Kolter, "Biofilm formation as microbial development", Annual Review of Microbiology, Vol. 54, pp. 49-79, 2000.
[7] J. S. Andrews, et al., "Biofilm formation in environmental bacteria is influenced by different macromolecules depending on genus and species", Environmental Microbiology, Vol. 12, pp. 2496-2507, 2010.
[8] T. Abee, et al., "Biofilm formation and dispersal in Gram-positive bacteria", Current Opinion in Biotechnology, Vol. 22, pp. 172-179, 2011.
[9] K. K. Jefferson, "What drives bacteria to produce a biofilm?", FEMS Microbiology Letters, Vol. 236, pp. 163-173, 2004.
[10] J. G. Leid, et al., "The exopolysaccharide alginate protects Pseudomonas aeruginosa biofilm bacteria from IFN-γ-Mediated macrophage killing", The Journal of Immunology, Vol. 175, pp. 7512-7518, 2005.
[11] K. F. Kong, C. Vuonga, and M. Ottoa, "Staphylococcus quorum sensing in biofilm formation and infection", International Journal of Medical Microbiology, Vol. 296, pp.
133-139, 2006.
[12] F. Gebara, "Activated sluge biofilm wastewater treatment system", Water Research, Vol. 33, pp. 230-238, 1999.
[13] B. E. Rittmann, "The membrane biofilm reactor is a versatile platform for water and wastewater treatment", Environmental Engineering Research, Vol. 12, pp. 157-175,
2007.
[14] M. Wagnera, et al., "Combined use of confocal laser scanning microscopy (CLSM) and Raman microscopy (RM): investigations on EPS-matrix", Water Research, Vol. 43, pp. 63-76, 2009.
[15] B. A. Annous, P. M. Fratamico, and J. L. Smith, "Quorum sensing in biofilms: why bacteria behave the way they do", Journal of Food Science, Vol. 74, pp. 24-37, 2009. [16] A. Vertes, V. Hitchins, and K. S. Phillips, "Analytical challenges of microbial biofilms
on medical devices", Analytical Chemistry, Vol. 84, pp. 3858-3866, 2012.
[17] Y. Uchida, et al., "Extracellular accumulation of mono- and di-succinoyl trehalose lipids by a strain of Rhodococcus erythropolis grown on n-alkanes", Agricultural and Biological Chemistry, Vol. 53, pp. 765-769, 1989.
[18] W. R. Finnerty, "The biology and genetics of the genus Rhodococcus", Annual Review of Microbiology, Vol. 46, pp. 1992.
[19] S. Lang and J. C. Philp, "Surface-active lipids in rhodococci", Antonie Van Leeuwenhoek, Vol. 74, pp. 59-70, 1998.
[20] C. C. C. R. de Carvalho, et al., "Mycobacterium sp., Rhodococcus erythropolis, and
Pseudomonas putida behavior in the presence of organic solvents", Microscopy
Research and Technique, Vol. 64, pp. 215-222, 2004.
[21] C. C. C. R. de Carvalho and M. M. R. d. Fonseca, "The remarkable Rhodococcus
erythropolis", Applied Microbiology and Biotechnology, Vol. 67, pp. 2005.
planktonic and biofilm Rhodococcus erythropolis cells to growth on C5 to C16 n-alkane hydrocarbons", Applied Microbiology and Biotechnology, Vol. 82, pp. 311-320, 2009. [23] Y. Tokumoto, et al., "Structural characterization and surface-active properties of a
succinoyl trehalose lipid produced by Rhodococcus sp. SD-74", Journal of Oleo Science, Vol. 58, pp. 97-102, 2009.
[24] C. K. Huang, H. Hamaguchi, and S. Shigeto, "In vivo multimode Raman imaging reveals concerted molecular composition and distribution changes during yeast cell cycle", Chemical Communications, Vol. 47, pp. 9423-9425, 2011.
[25] S. Ask, et al., "Luminosity measurement at ATLAS-development, construction and test of scintillating fibre prototype detectors", Nuclear Instruments and Methods in Physics Research Section A, Vol. 568, pp. 588-600, 2006.
[26] H. N. N. Venkata, N. Nomurab, and S. Shigeto, "Leucine pools in Escherichia coli biofilm discovered by Raman imaging", Journal of Raman Spectroscopy, Vol. 42, pp. 1913-1915, 2011.
[27] N. Uzunbajakava, et al., "Nonresonant confocal Raman imaging of DNA and protein distribution in apoptotic cells", Biophysical Journal, Vol. 84, pp. 3968-3981, 2003. [28] G. H. GOLUB and C. REINSCH, "Singular Value Decomposition and Least Squares
Solutions", Numerische Mathematik, Vol. 14, pp. 403-420, 1970.
[29] H. Schulz, M. Baranska, and R. Baranski, "Potential of NIR-FT-Raman spectroscopy in natural carotenoid analysis", Biopolymers, Vol. 77, pp. 212-221, 2005.
[30] Z. Movasaghi, S. Rehman, and I. U. Rehman, "Raman spectroscopy of biological tissues", Applied Spectroscopy Reviews, Vol. 42, pp. 493-541, 2007.
[31] I. Notingher, "Raman spectroscopy cell-based biosensors", Sensors, Vol. 7, pp. 1343-1358, 2007.
[32] J. L. Klassen, "Phylogenetic and evolutionary patterns in microbial carotenoid biosynthesis are revealed by comparative genomics", PLoS ONE, Vol. 5, pp. e11257,
2010.
[33] N. J. Fraser, H. Hashimoto, and R. J. Cogdell, "Carotenoids and bacterial photosynthesis: the story so far...", Photosynthesis Research, Vol. 70, pp. 249-256, 2001.
[34] B. Tian, et al., "Evaluation of the antioxidant effects of carotenoids from Deinococcus
radiodurans through targeted mutagenesis, chemiluminescence, and DNA damage
analyses", Biochimica et Biophysica Acta, Vol. 1770, pp. 902-911, 2007.
[35] J. Glaeser and G. Klug, "Photo-oxidative stress in Rhodobacter sphaeroides: protective role of carotenoids and expression of selected genes", Microbiology, Vol. 51, pp. 1927-1938, 2005.
[36] A. Lipovsky, et al., "Sensitivity of Staphylococcus aureus strains to broadband visible light", Photochemistry and Photobiology, Vol. 85, pp. 255-260, 2009.
[37] B. González-Flecha and B. Demple, "Metabolic sources of hydrogen peroxide in aerobically growing Escherichia coli", The journal of biological chemistry, Vol. 270, pp. 13681-13687, 1995.
[38] E. Cabiscol, J. Tamarit, and J. Ros, "Oxidative stress in bacteria and protein damage by reactive oxygen species", INTERNATL MICROBIOL, Vol. 3, pp. 3-8, 2000.
[39] R. Mittler, "Oxidative stress, antioxidants and stress tolerance", Trends in Plant Science, Vol. 7, pp. 405-410, 2002.
[40] E. Navarro, et al., "Influence of ultraviolet radiation on UVR-absorbing compounds in freshwater algal biofilms and Scenedesmus vacuolatus cultures", Journal of Toxicology and Environmental Health, Vol. 70, pp. 760-767, 2007.
![Figure I-1 Developmental model of biofilm formation (adapted from Ref. [1]).](https://thumb-ap.123doks.com/thumbv2/9libinfo/8245127.171480/15.892.157.785.323.819/figure-i-developmental-model-biofilm-formation-adapted-ref.webp)