鐵‐鋁‐鈦和鐵‐鋁‐錳合金相變化、
機械性質及耐腐蝕研究
研究生:蔡 國 棟 指導教授:劉 增 豐 博士 朝 春 光 博士國立交通大學材料科學與工程研究所
中文摘要
本論文利用光學顯微鏡(OM)、穿透式電子顯微鏡(TEM)、X 光能 量散佈分析儀(EDS)、X 光繞射儀(XRD)、歐傑電子分析儀(AES)等 儀器,研究鐵-24.6 at.%鋁-7.5 at.%鈦三元合金顯微結構的變化,同時探 討鐵-20 at.%鋁-26 at.%錳-(5-8) at.%碳合金在淬火狀態下,合金中不同碳 素含量對於史賓諾多相分解反應的影響,以及進一步研究在鐵-(7.1-9.1) wt.% 鋁 -(29.2-31.3) wt.% 錳 -(2.8-6) wt.% 鉻 -(0.88-1.07) wt.% 碳 ( 鐵 -(13.2-16.4) at.%鋁-(26.6-27.8) at.%錳-(2.7-5.6) at.%鉻-(3.7-4.3) at.%碳)系列合金中,不同的鉻含量對於機械性能及耐蝕性的研究。本論文所得到 的具體研究結果如下: [1]、先前研究顯示,Ti 元素的添加對二元的 Ti-Al 合金將會有(1) 大幅提升 D03→B2 及 B2→A2 相轉換溫度,(2)顯著擴大(A2+D03)相區 域,及(3)促使 D03 反向晶界傾向於非等方性(anisotropy)。此外, Fe-Al-Ti 三元合金於 1073~1273K 時,存在一(B2+L21)雙相區(此三元合
金中的L21,等同在二元合金中的D03結構),值得注意的是,此(B2+D03)
雙相區於Fe-Al 二元合金中從未被先前研究者所發現。然而,於 Fe-Al-Ti
三元合金中所存在之(B2+L21)雙相區,主要亦是藉由 X 光繞射儀(XRD)、
熱示差掃描卡量計(DSC)、熱差分析儀(DTA)及電子探針微分析儀
(EPMA)。近來我們利用穿透式電子顯微鏡針對鐵-23 at.%鋁-8.5 at.%鈦
合金經過1173K 時效後,進行相變化研究,發現於 1173K 較長時間時效 後, L21相區大幅擴大,且於 a/2<100>反向晶界(anti-phase boundary, APB),依序發生一 A2→(A2+L21)→(B2+L21)的相變化,此一現象從未被 其他研究者發現。延續先前研究,此次研究目的乃針對鐵-24.6 at.%鋁-7.5 at.%鈦合金經過 1173K 時效後,嘗試觀察顯微組織的發展情形。值得注 意的是,依據先前所建立的Fe-Al-Ti 三元合金等溫相圖,前述合金與本研 究合金的化學組成均落入(B2+L21)相區,然而本研究合金的組成更逼近 A2/ B2/L21相區頂端。 研究結果顯示,在淬火狀態,鐵-23 at.%鋁-7.5 at.%鈦合金為(A2+L21) 混合相,續於1173K 施予 6 小時時效後,L21相大幅成長,且在a/2<100> 反向晶界上可見B2 相顆粒存在形成;隨著時效時間延長,L21相的domain
大幅成長,且在a/2<100>反向晶界鄰近區 L21相分離(phase separation)
為 (B2+ L21*)。其中 L21*亦為 L21相。1173K 時效時間繼續延長,相分離
朝向整個已成長的L21相區內部。因而合金於1173K 施予 36 小時時效後,
[2]、完全沃斯田鐵相 FeAlMnC 合金,其顯微組織已廣泛被諸多學 者研究。這些研究顯示,當合金組成在鐵-(7.8–11.8) wt.%鋁-(28–34.3) wt.%錳-(0.74–1.3) wt.%碳(鐵-(14.2–20.9) at.%鋁-(25–30.1) at.%錳 -(3.1–5.2) at.%碳)範圍,於單一沃斯田鐵(γ)相(無序面心立方(fcc)) 區域做固溶化熱處理後急冷,其顯微組織為單一沃斯田鐵相。續於 500–550 °C 做適度時間的時效處理,細緻的(Fe,Mn)3AlCX 碳化物 (k′ 碳 化物)開始於沃斯田鐵基地中以整合(coherent)析出,此(Fe,Mn)3AlCX 碳 化物具有一種有序的面心立方L′12型結構。最近我們以穿透式電子顯微鏡 觀察一鐵-9 wt.%鋁-30 wt.%錳-2 wt.%碳 (鐵-16 at.%鋁-26 at.%錳-8 at.%碳)合金的相變化。結果發現在淬火狀況下,單一的沃斯田鐵中蘊含 有 以 史 賓 諾 多 相 分 解 反 應 的 細 緻 k′ 碳 化 物 存 在 , 此 與 碳 含 量 介於 3.1≤C≤5.2 at.%的 FeAlMnC 合金中,k′ 碳化物僅可見於合金經時效處理 後迥然不同。這個發現顯示碳含量對淬火時 k′ 碳化物於沃斯田鐵基地中 的形成扮演著重要的角色。然而,迄今,為何添加較多的碳含量會促使有 如此結果的理由尚不清楚,因此本研究的主要目的,則在於有系統的分析 鐵-20 at.%鋁-26 at.%錳-(5.0-8.0) at%碳合金的淬火顯微組織。
研究結果顯示,在淬火狀態下,於鐵-20 at.%鋁-26 at.%錳-碳合金,
碳含量在5.5≤C≤8.0 at.%時,可見史賓諾多相分解反應與有序的 k′ 碳化
物形成。且隨著碳含量的逐漸增加,史賓諾多的波長和有序的 k′ 碳化物
量之增加而增加。隨著碳含量的增加,有序的 k′ 碳化物及無序的 γ0相,
兩者的晶格常數均增加,然而晶格的misfit 卻下降,且當碳含量略低於 5.5
at.%時 misfit 卻急遽增加。其顯示碳含量略低於 5.5 at.%時,其 k′ 碳化物
和γ0相之間的應變能(strain energy)急遽的增加。由於應變能急遽增加, 過冷(undercooling)可能尚不足以克服應變能量的增加,而抑制了史賓 諾多相分解和有序k′ 碳化物在淬火過程中形成。其說明本研究中的合金 A (5 C)和先前 3.1≤C≤5.2 at.%沃斯田鐵系 FeAlMnC 合金,於淬火條件下, 均無法有史賓諾多相分解反應與有序 k′ 碳化物形成之原因。此外,在研 究中合金中的碳含量增加,所形成中的 k′ 碳化物中碳濃度亦隨之增加。 此表示在初始的γ 相中較高的碳飽和度,將促使在淬火中傾向碳富集 k′ 碳 化物形成的趨勢。 [3]、以前的研究顯示,鐵-(7.8-10) wt.%鋁-(28-34) wt.%錳-(0-1.75) wt.% M (M=鈮+釩+鉬+鎢)-(0.85-1.3) wt.%碳合金的淬火微觀組織為單一 的沃斯田鐵相,或是沃斯田鐵中存在少量的(鈮,釩)碳的碳化物。依據 化學組成,淬火後的合金最大抗拉強度、降伏強度及延伸率,分別為 840~950MPa、410~550 MPa 及 70~57%。基於先前的研究,可以得出 一個結論,淬火後的合金於 550℃續經 16 小時時效,強度和延展性會有 一個最佳化的組合,此最佳化組合的獲得乃是因為(Fe、Mn)3AlC 碳化物 (k′ 碳化物)在沃斯田鐵基地中形成,且未在晶界上析出。當此等合金的 延 伸 率 約 為 30% 時 , 其 最 大 抗 拉 強 度 、 降 伏 強 度 分 別 可 達
953~1259MPa、665~1094 MPa。雖然沃斯田鐵系的 FeAlMnC 合金具有 優異的強度及延性,然而在水的環境中,這些合金的耐腐蝕性不佳,不符 工業的應用。為改善耐蝕性,於FeAlMnC 合金中添加鉻元素,結果顯示 經 淬 火 後 的 鐵-(7.1-9.1) wt.% 鋁 -(29.2-31.3) wt.% 錳 -(2.8-6) wt.% 鉻 -(0.88-1.07) wt.%碳合金,在 3.5% NaCl 溶液中其耐蝕性顯著優於淬火狀 態及時效熱處理的FeAlMn (M)C 合金。然而,淬火後的 FeAlMnCrC 合金 仍為單一的沃斯田鐵相,可預期與FeAlMn(M)C 合金淬火後類似,機械性 能強度均較低。此外,以前學者的研究顯示,鐵-(8.7-9) wt.%鋁-(28.3-30) wt.%錳-(5-5.5) wt.%鉻-(0.7-1) wt.%碳的合金,於 550 ~ 600 ℃ 施予超過 8 小時的時效,除了沃斯田鐵基地中細緻的 k′ 碳化物的形成外,尚有粗 的(Fe,Mn,Cr)7C3碳化物以異質方式(heterogeneously)於晶界上析出, 此(Fe,Mn,Cr)7C3 碳化物於晶界上析出,導致耐蝕性變差。這意味著以前 的研究中,很難在沃斯田鐵系的FeAlMn (M) C 和 FeAlMnCrC 合金,同 時具備高強度、高延展性和優良的耐腐蝕性能。因此,本研究的主要目的 是開發新的沃斯田鐵系 FeAlMnCrC 合金,使其具有高強度和高延性,以 及一個適當的耐蝕性。 本文的研究,開發出一種新的沃斯田鐵系的鐵-9 wt.%鋁-28 wt.%錳-6 wt.%鉻-1.8 wt.%碳合金,該合金經淬火後具有顯著的高強度、高延展性 和優良的耐蝕性。其原因乃此合金於淬火時,沃斯田鐵的基地中有細緻的 k′ 碳化物在基地內整合析出,且在表面有鉻和鋁氧化物形成一層鈍化膜。
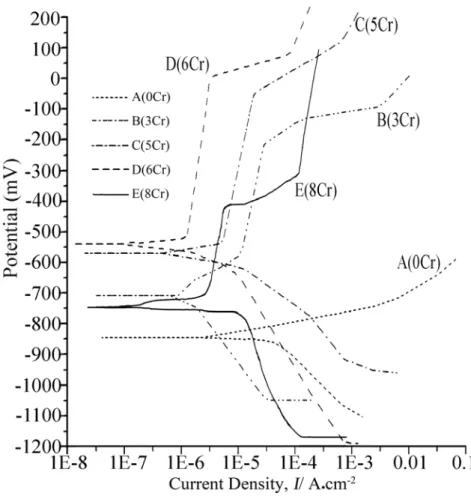
系列合金設計中,值得注意的是,於3.5% NaCl 溶液中的腐蝕極化曲線 測試,D(6Cr)合金的蝕孔腐蝕電位為 Epp(-25mV),其遠高於經時效的鐵 -(8.7-9) wt.%鋁-(28.3-30) wt.%錳-(5-5.5) wt.%鉻-(0.7-1) wt.%碳合金的 (-500~-240mV),亦高於經回火的商業化麻田散鐵型 AISI 410 不銹鋼的 (-250~-100mV)。此外,D(6Cr)合金的拉伸強度亦與時效後的 FeAlMnC 合 金以及AISI 410 相當。
Phase Trasformations, Mechanical Properties
and Corrosion Behaviors of Fe-Al-Ti and
Fe-Al-Mn Alloys
Student: Gow-Dong Tsay Advisor: Prof. Tzeng-Feng Liu
Prof. Chuen-Guang Chao
Department of Materials Science and Engineering
National Chao Tung University
Abstract
The microstructural development in an Fe-24.6 at.%Al-7.5 at.%Ti alloy, effect of carbon content on spinodal decomposition in the Fe-20 at.%Al-26 at.%Mn-(5.0-8.0) at.%C alloys and effect of chromium content on corrosion resistance in Fe-(7.1-9.1) wt.Al-(29.2-31.3) wt.%Mn-(2.8-6) wt.%Cr-(0.88-1.07) wt.%C (Fe-(13.2-16.4) at.%Al-(26.6-27.8) at.%Mn -(2.7-5.6) at.%Cr-(3.7-4.3) at.%C) alloys were examined by means of
optical microscopy (OM), transmission electron microscope (TEM), X-ray energy dispersive spectrometer (EDS), X-ray diffractometer (XRD) and Auger electron spectrometer (AES). The results obtained as follows:
binary alloys would (1) strongly increase the D03→B2 and B2→A2
transition temperatures, (2) significantly expand the (A2+D03) phase
field, and (3) cause the D03 APBs to exhibit a tendency toward
anisotropy. In addition, a (B2+L21) (L21 is the ternary equivalent of the
binary D03 structure.) two-phase field was reported to be existent at
temperatures ranging from 1073 to 1273K in the Fe-Al-Ti ternary alloys.
It is noted that the (B2+D03) two-phase field has not been found by
previous workers in the Fe-Al binary alloys before. However, the
existence of the (B2+L21) two-phase field in the Fe-Al-Ti ternary alloys was determined principally by using X-ray diffraction, differential scanning calorimetry, differential thermal analysis and electron-probe microanalysis. Recently, we have performed transmission electron microscopy (TEM) investigations on the phase transformations of an
Fe-23 at.% Al-8.5 at.% Ti alloy aged at 1173K. Consequently, it was
found that when the alloy was aged at 1173K for longer times, the L21
domains grew considerably and an A2→(A2+L21)→(B2+L21) transition
occurred at a/2<100>APBs. This feature has never been reported by other workers in the Fe-Al-Ti alloy systems before. Extending the previous work, the purpose of this study is an attempt to examine the microstructural developments of the Fe-24.6 at.% Al-7.5 at.% Ti alloy
aged at 1173K. It is noted that according to the previously established isothermal sections of Fe-Al-Ti ternary alloys at 1173K, the chemical compositions of both the previous alloy and the present alloy are just
located in the (B2+L21) region. However, the chemical composition of
the present alloy is much closer to the A2/B2/L21 apex than that of the previous alloy.
In the as-quenched condition, the microstructure of the Fe-24.6 at.%
Al-7.5 at.% Ti alloy was the mixture of (A2+L21) phases. When the
as-quenched alloy was aged at 1173K for 6 h, the L21 domains grew
considerably and the B2 phase was formed at a/2<100> APBs as well
as the phase separation from well-grown L21 to (B2+L21*) occurred
basically contiguous to the a/2<100> APBs., where L21* is also of L21-typestructure. After prolonged aging at 1173K, the phase separation
would proceed toward the inside of the whole well-grown L21 domains.
Consequently, the microstructure of the alloy aged at 1173K for 36 h was essentially the mixture of (B2+L21*) phases.
[2]. The microstructural developments in fully austenitic FeAlMnC alloys, prepared by conventional casting processes, have been extensively studied by many researchers. In these studies, when an alloy with a chemical composition in the range of Fe-(7.8–11.8) wt.%Al
-(28–34.3) wt.%Mn -(0.74–1.3) wt.%C (Fe-(14.2–20.9) at.%Al-(25–30.1) at.%Mn-(3.1–5.2) at.%C) was solution heat-treated in the single austenite (γ) phase (disordered face-centered cubic (fcc)) region and then quenched rapidly, the microstructure of the alloy was single-phase γ. When the as-quenched alloy was aged at 500–550°C for moderate
periods of time, fine (Fe,Mn)3AlCX carbides (k′ carbides) began to
precipitate coherently within the γ matrix. The (Fe,Mn)3AlCX carbide has an ordered fcc crystal structure which belongs to the L′12 type. Recently, we performed transmission electron microscopy observations on the phase transformations of an Fe-9 wt.%Al-30 wt.%Mn-2 wt.%C (Fe -16 at.%Al-26 at.%Mn-8 at.%C) alloy. Consequently, we found that the microstructure of the alloy in the as-quenched condition was γ phase, which contained fine k′ carbides formed within the γ matrix by spinodal decomposition during quenching. This is quite different from that observed in the austenitic FeAlMnC alloys with 3.1≤C≤5.2 at.%, in which fine k′ carbides could only be observed in aged alloys. This finding suggests that the carbon content may play an important role in the formation of fine k′ carbides within the γ matrix during quenching. However, to date, the reason why adding a greater amount of carbon could lead to this result is unclear. Therefore, the main purpose of this
work is to study systematically the effect of carbon content on the as-quenched microstructure of Fe-20 at.%Al-26 at.%Mn-C alloys with 5.0≤C≤8.0 at.%.
The experimental results revealed that spinodal decomposition and formation of ordered k′ carbides could be observed in the Fe-20 at.%Al-26 at.%Mn-C alloys with 5.5≤C≤8.0 at.% under the as-quenched condition. Both the wavelength and the amount of ordered k′ carbides increased with increasing of carbon content, indicating that the temperatures of both spinodal decomposition and ordering reaction increased with increasing carbon content. With increasing carbon content, the lattice parameters of both the ordered k′ carbides and the
disordered γ0 phase increased, whereas the misfit between the two
phases decreased. Especially, the coherency strain energy was increased dramatically as the carbon content approached slightly below 5.5 at.%. Given the remarkable increase in strain energy, undercooling may be insufficient to overcome the strain energy effects, which are responsible for the absence of spinodal decomposition and formation of ordered k′ carbides in the present alloy with 5.0 at.% C and in previous austenitic FeAlMnC alloys with 3.1≤C≤5.2 at.% under the as-quenched condition. Additionally, the carbon concentration in the k′ carbides
formed in the present alloys increased with increasing carbon content. This indicates that a higher degree of carbon supersaturation in the
initial γ phase might promote a tendency toward C-rich k′ carbides
formation during quenching.
[3]. Previous studies have shown that the as-quenched microstructure of the Fe-(7.8-10) wt.%Al-(28-34) wt.%Mn-(0-1.75) wt.% M (M=Nb+V+Mo+W)-(0.85-1.3) wt.%C alloys is single austenite (γ) phase or γ phase with small amounts of (Nb,V)C carbides. Depending on the chemical composition, the ultimate tensile strength (UTS), yield strength (YS), and elongation of the as-quenched alloys ranges from 840 to 950 MPa, 410 to 550 MPa and 70 to 57%, respectively. Based on the results of the previous studies, it can be generally concluded that alloys having an optimal combination of strength and ductility can be obtained when the as-quenched alloys are aged at 550℃ for about 16 h, this optimal combination is obtained because of the formation of fine (Fe,Mn)3AlC carbides (k′ carbides) within the γ matrix and the absence of precipitates on the grain boundaries. These alloys have an elongation better than about 30%, and UTS and YS values of 953~1259 MPa and 665~1094 MPa, respectively. Although the austenitic FeAlMn(M)C alloys possess the remarkable combination of strength and ductility, the
corrosion resistance of these alloys in aqueous environments is not adequate for use in industrial applications. In order to improve the corrosion resistance, chromium has been added to the austenitic FeAlMnC alloys. Consequently, it has been found that the corrosion resistance of the as-quenched Fe-(7.1-9.1) wt.%Al-(29.2-31.3) wt.%Mn -(2.8-6) wt.%Cr-(0.88-1.07) wt.%C alloys becomes considerably better than that of the as-quenched or aged FeAlMn(M)C alloys. However, the as-quenched microstructure of these FeAlMnCrC alloys still remains to be single γ phase. It is thus expected that the mechanical strength of the as-quenched FeAlMnCrC alloys would be low similar to that of the as-quenched FeAlMn(M)C alloys. Furthermore, previous studies on the Fe-(8.7-9) wt.%Al-(28.3-30) wt.%Mn-(5-5.5) wt.%Cr-(0.7-1) wt.%C alloys aged at 550~600℃ for a time period longer than 8 h have indicated that besides the formation of the fine k′ carbides within the γ
matrix, the coarse (Fe,Mn,Cr)7C3 carbides might precipitate
heterogeneously on the grain boundaries. The precipitation of the coarse (Fe,Mn,Cr)7C3 carbides on the grain boundaries results in the corrosion resistance being poor. This implies that it is difficult for the austenitic FeAlMn(M)C and FeAlMnCrC alloys examined in the previous studies to possess both high-strength and high-ductility along with good
corrosion resistance. Therefore, the main aim of this study is to develop new austenitic FeAlMnCrC alloys that possess high-strength and high-ductility as well as an appropriate corrosion resistance.
In this study, a new austenitic Fe-9 wt.%Al-28 wt.%Mn-6 wt.%Cr -1.8 wt.%C alloy is developed. The as-quenched alloy possesses a remarkable combination of high-strength, high-ductility, and moderate corrosion resistance, which is attributed to the presence of fine k′ carbides formed coherently within the γ matrix during quenching and to a layer of Cr and Al oxides in the passive film. The pitting potential Epp (-25 mV) of the alloy measured in 3.5% NaCl solution is noticeably higher than that of the aged FeAlMnC alloys (-500~-240 mV) and the tempered AISI 410 martensitic stainless steel (-250~-100 mV). In addition, the tensile strength of the alloy is comparable to that of the aged FeAlMnC alloys and AISI 410.
Contents
page
中文摘要 ...i
Abstract ...vii
Contents ...xv
List of Tables ...xvii
List of Figures ...xviii
Chapter 1. General Introduction ...1
Chapter 2. Phase separation from L21 to (B2+L21) in Fe-24.6Al-7.5Ti alloy ...14
2-1 Introduction ... 16
2-2 Experimental procedure... 18
2-3 Results and discussion ... 19
2-4 Conclusions ... 36
References ... 37
Chapter 3. Effect of Carbon on Spinodal Decomposition in Fe-20Al -26Mn-C Alloys... 39
3-1 Introduction ... 41
3-2 Experimental procedure... 43
3-3 Results and discussion ... 44
3-4 Conclusions ... 57
References ... 59
Chapter 4. A New Austenitic FeAlMnCrC Alloy with High-Strength, High-Ductility, and Moderate Corrosion Resistance ...61
4-1 Introduction ... 64
4-2 Experimental procedure... 67
4-3 Results and discussion ... 69
4-4 Conclusions ... 80
References ... 81
List of Tables
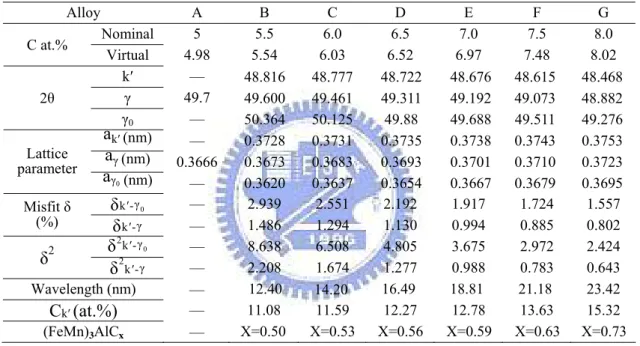
Table 2.1 Chemical compositions of the phases revealed by EDS. ...30 Table 3.1 Experimental data obtained from the X-ray diffraction
profiles of the present seven alloys. ...53 Table 4.1 Electrochemical parameters extracted from polarization
curves and mechanical properties of the present five
List of Figures
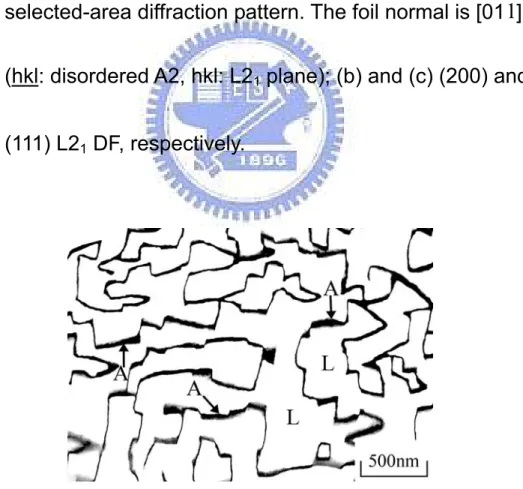
Figure 2.1 Electron micrographs of the as-quenched alloy: (a) a
selected-area diffraction pattern. The foil normal is [01 ]. (hkl: disordered A2, hkl : L21 plane); (b) and (c) (200) and (111) L21 DF, respectively.. ... 21 Figure 2.2 (111) L21 DF electron micrograph of the alloy aged at
1173K for 3h. .. ...21 Figure 2.3 Electron micrographs of the alloy aged at 1173 k for 6 h.
(a) and (b) (111) and (200) L21 DF, respectively. (c) and (d) (111) and (200) L21 DF with a higher magnification of (a) and (b), respectively.. ... 23 Figure 2.4 Electron micrographs of the alloy aged at 1173 k for 12 h.
(a) and (b) (111) and (200) L21 DF, respectively. ... . 26 Figure 2.5 Electron micrographs of the alloy aged at 1173 k for 24 h.
(a) and (b) (111) and (200) L21 DF, respectively... ... 27 Figure 2.6 Electron micrographs of the alloy aged at 1173 k for 36 h.
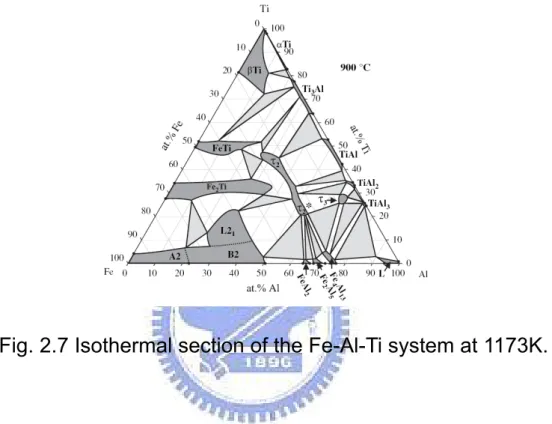
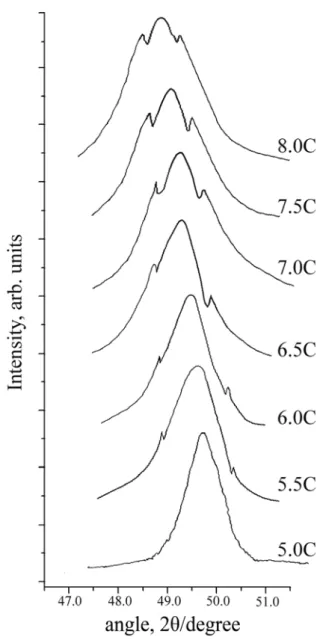
(a) and (b) (111) and (200) L21 DF, respectively. ... 28 Figure 2.7 Isothermal section of the Fe-Al-Ti system at 1173K... ... 32 Figure 3.1 X-ray diffraction profiles around the (200)γ Bragg reflection
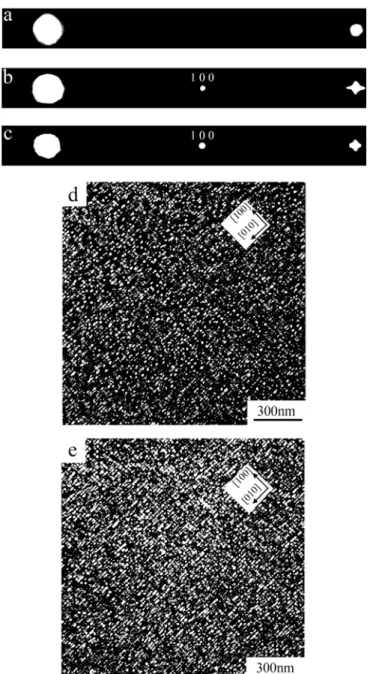
for the present seven alloys... 45 Figure 3.2 Transmission electron micrographs of the present alloys
in the as-quenched condition. (a)-(c) SADPs of alloys A (5 C), D(6.5 C), and G (8 C), respectively. (hkl: k′ particle), (d)-(e) (100)k′ DF images of alloys D (6.5 C) and G (8 C),
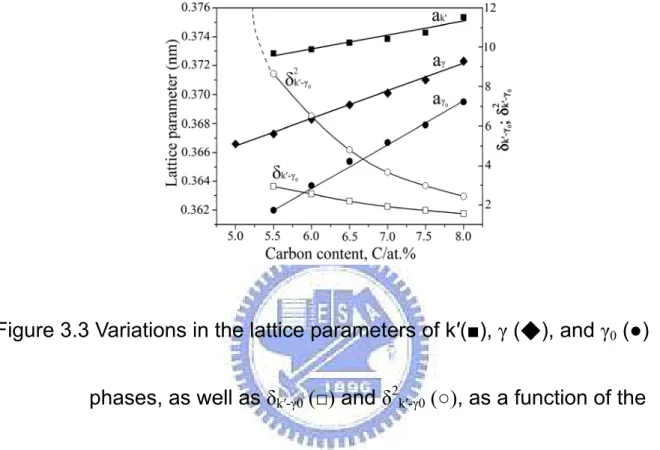
respectively. ... 47 Figure 3.3 Variations in the lattice parameters of k′(■), γ (◆), and γ0 (●)
phases, as well as δk′-γ0 (□) and δ2k′-γ0 (○), as a function of the carbon content. ... 52 Figure 4.1 Optical micrographs of present alloys: (a) alloy D (6Cr),
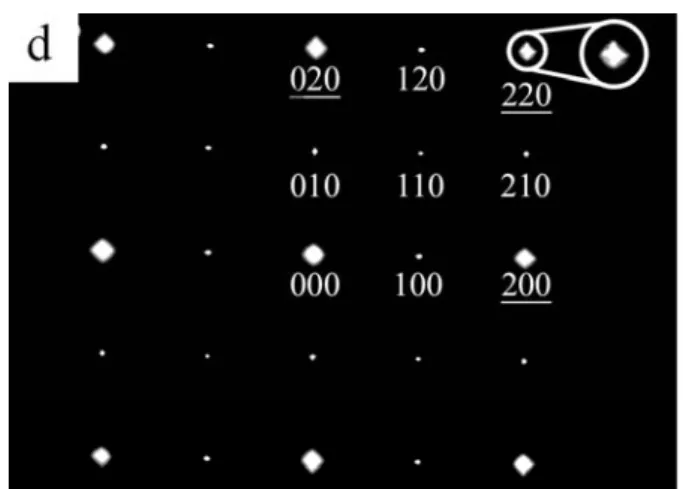
and (b) alloy E (8Cr). Transmission electron micrographs of alloy D (6Cr): (c) (100)k′ DF, and (d) a selected area
diffraction pattern taken from a mixed region covering the γ matrix and fine k′ carbides. The zone axis is [001] (hkl: γ matrix; hkl: k′ carbide). ... 70 Figure 4.2 Potentiodynamic polarization curves for present five
alloys measured in 3.5% NaCl solution. ... 73 Figure 4.3 AES depth profiles of passive film of present alloys:
Chapter 1.
General Introduction
Fe-Al alloys are generally used for high-temperature structural applications due to the low cost, reasonable strength and good corrosion resistance [1-3]. However, the application ambit has been limited owing to the low room-temperature ductility and a sharp drop in strength above
873K, which is well-known to be related to the D03→B2 phase
transformation [1]. In order to improve the high-temperature strength, alloying elements was added into the Fe-Al binary alloys as transition metals (Ti, V, Mo, Ze…etc.) for increasing transition temperature. The addition of Ti resulted in a significantly large increase of the D03→B2 transition temperature about 60K/at% [4-8].
The microstructures of the Fe-Al-Ti ternary alloys have been studied by many workers [8-20]. In the previous studies, it is seen that the Ti addition in the Fe-Al binary alloys would (1) strongly increase the
D03→B2 and B2→A2 transition temperatures, (2) significantly expand the
(A2+D03) phase field, and (3) cause the D03 APBs to exhibit a tendency toward anisotropy. In addition, a (B2+D03) two-phase field was reported to be existent at temperatures ranging from 1073 to 1273K in the Fe-Al-Ti ternary alloys [16-20]. It is worth mentioning that the (B2+D03) two-phase field has not been observed by previous workers in the Fe-Al binary alloys
before [21-22]. However, the existence of the (B2+D03) two-phase field in the Fe-Al-Ti ternary alloys was determined mainly by using optical micrography (OM), scanning electron microscopy (SEM), x-ray diffraction (XRD), differential scanning calorimetry (DSC), differential thermal analysis (DTA) and electron-probe microanalysis (EPMA) [16-20].
Recently, Su et al. have performed transmission electron microscopy (TEM) investigations on the phase transformations of Fe-(20-23) at.%Al-(7, 8.5) at.%Ti alloys aged at 1073~1273K [23-25]. Consequently, it was found that the as-quenched microstructure of both the Fe-23 at.%Al-7 at.%Ti and Fe-23 at.%Al- 8.5 at.%Ti alloys was a mixture of
(A2+D03) phases. The (A2+D03) phases were formed by an
A2→B2→(A2+D03) transition during quenching [23-24]. When the
Fe-23at.%Al-7at.%Ti alloy was aged at 1073K for moderate times, the D03 domains grew preferentially along <100> directions and extremely fine B2 particles occurred at a/2<100> anti-phase boundaries (APBs). After prolonged aging at 1073K, the B2 particles would grow to occupy the whole a/2<100> APBs. As a result, the stable microstructure of the
alloy present at 1073K was a mixture of (B2+D03) phases [23]. Whereas,
when the Fe-23at.%Al- 8.5at.%Ti alloy was aged at 1173K for longer
considerably and an A2→(A2+D03)→(B2+D03) transition occurred at a/2<100> APBs of the D03 domains [24]. These microstructural evolutions have never been reported by other workers in the Fe-Al-Ti alloy systems before. Additionally, we found that when the Fe-23 at.%Al- 8.5 at.%Ti alloy was aged at 1273K, rod-like C14 precipitates could be observed
within the (A2+D03) matrix [25]. Although the C14 precipitate was
extensively reported to be observed in the aged Fe-Al-Ti alloys, little information concerning the orientation relationship between the C14 precipitate and matrix has been provide. By using transmission electron microscopy, Su et al. determined the orientation relationship between the
C14 precipitate and (A2+D03) matrix to be (0001)C14//( 112 )m,
( 1001 )C14//( 101 )m, (1120)C14//(111)m [25].
Phase transformations, mechanical properties and corrosion resistance in austenitic FeMnAlC alloys have also been studied by many workers [26-59]. In these studies, it is seen that the as-quenched microstructure of the Fe-(6-11.8) wt.%Al-(26-34.3) wt.%Mn-(0-1.75) wt.%M (M=Nb+V+Mo+W)-(0.54-1.3) wt.%C alloys was single-phase austenite (γ) or γ phase with small amount of (Nb,V)C carbides. Depending on the chemical composition, the alloys in the as-quenched condition show various ultimate tensile strength (UTS) ranging from 840
to 950 MPa, yield strength (YS) ranging from 410 to 550 MPa and elongation from 70 to 57% [33, 36-50]. When the as-quenched alloys
were aged at 500~750℃ for moderate times, fine (Fe,Mn)3AlC carbide (κ′
carbide) having an L′12-type structure started to precipitate coherently within the γ matrix and no precipitates could be observed on the γ/γ grain boundaries. Based on the previous studies, it can be generally concluded that the alloys could possess an optimal combination of strength and ductility when the as-quenched alloys were aged at 550℃ for about 16 h [33-35, 39]. With an elongation better than about 30%, the values of UTS and YS could be attained to be 953~1259 MPa and 665~1094 MPa, respectively [33-35, 39-40]. After prolonged aging time within this temperature range, the coarse (Fe,Mn)3AlC carbide (κ carbide) started to precipitate heterogeneously on the γ/γ grain boundaries. The coarse k
carbide also has an L′12-type structure. Depending on the chemical
composition and aging temperature, the coarse k carbides would grow
into adjacent γ grains through a γ→α(ferrite)+β-Mn reaction, a γ→γ0
(carbon- deficient austenite)+κ reaction , a γ→β-Mn+κ reaction or a γ→α+β-Mn+κ reaction [30-35]. Due to the formation of the coarse k carbides on the grain boundaries, both of strength and ductility were drastically dropped [36-59].
Although the austenitic FeAlMnC alloys could possess the remarkable combination of strength and ductility, the corrosion resistance of the alloys in aqueous environments was not adequate for applications in industry [60-64]. In order to improve the corrosion resistance, Cr has been added to the austenitic FeAlMnC alloys [63-66]. In these studies, it was found that Ecorr and Epp of the as-quenched austenitic Fe-(7.1-9.1) wt.%Al-(29.2-31.3) wt.%Mn-(2.8-6) wt.% Cr-(0.88-1.07) wt.%C alloys in 3.5% NaCl solution were ranging from -820 to -556 mV and from -240 to -27 mV, respectively [63-66]. The results were much better than the Ecorr
(-920~-789 mV) and Epp (-500~-280 mV) of the as-quenched austenitic
FeAlMnC alloys [60-64].
The effects of Cr addition on the microstructures of the FeAlMnC alloys have also been examined by several workers [67-68]. In the previous study [67], it was reported that when the austenitic Fe-9 wt.%Al -30 wt.%Mn-5 wt.%Cr-0.7 wt.%C alloy was aged at 550-750℃, the fine κ′
carbides were formed within the γ grains, and a (M7C3+D03)→
(M7C3+B2)→(M7C3+α) reaction occurred on the γ/γ grain boundaries. Besides, when the austenitic Fe-8.7 wt.%Al-28.3 wt.%Mn-5.5 wt.%Cr-1
wt.%C alloy was aged at 800~1250℃, a (γ+Cr7C3)→γ→(γ+(α+B2+D03))
In addition to extensive studies of FeAlMnC alloys with C≦1.3 wt.%, the phase transformations and mechanical properties in the FeAlMnC alloys with higher C content have also been examined [69-71]. Recently, Wang et al. performed TEM observation on the phase transformations of an Fe-30wt.%Mn-9wt.%Al-2wt.%C alloy [69]. Consequently, it was found that the as-quenched microstructure of the alloy was γ phase containing fine κ′ carbides. The fine κ′ carbides were formed within the γ matrix by spinodal decomposition during quenching. This is quite different from that observed in the FeAlMnC alloys with C≦1.3wt.%. After being aged at
550~1050℃, the fine κ′ carbides grew and a γ→γ0+κ carbide reaction
occurred on the γ/γ grain boundaries [69]. In the as-quenched condition, the UTS, YS and elongation of the Fe-(8.5-9) wt.%Al-(28-30) wt.%Mn- (1.8-2) wt.%C alloys were 1080~1105MPa, 868~883 MPa and 55.5~ 54.5%, respectively [70-71]. It is obviously seen that with equivalent elongation, the mechanical strength was much higher than that examined in the as-quenched FeAlMnC alloys with C≦1.3wt.%. Furthermore, after being aged at 450~550℃ for 9~12 h, the alloys could possess high UTS ranging from1395 to 1552 MPa and YS ranging from 1262 to 1423 MPa with a good elongation ranging from 32.5 to 25.8% [70-71].
thesis are listed as below:
(1) For extending the previous works, the purpose of present study is an attempt to examine the microstructural developments of the Fe-24.6 at.%Al-7.5 at.%Ti alloy aged at 1173K. The detailed experimental results and discussion are presented in Chapter 2.
(2) To date, the reason why higher carbon addition could lead the
formation of fine κ′ carbides within the γ matrix during quenching is unclear. Therefore, an attempt to study systematically the effect of carbon content on the as-quenched microstructure of the Fe-20 at.%Al-26 at.%Mn-(5.0-8.0) at.%C alloys was performed by using XRD and TEM. The detailed experimental results and discussion are presented in Chapter 3.
(3) According to the previous literatures, it seems to imply that the
austenitic FeAlMnC and FeAlMnCrC alloys are difficult to possess both high-strength high-ductility and appropriate corrosion resistance. Therefore, the purpose of present study is an attempt to develop new austenitic FeAlMnCrC alloys possessing high-strength high-ductility and good corrosion resistance simultaneously. The detailed experimental results and discussion are presented in Chapter 4.
References
1. O. Ikeda, I.Ohnuma, R. Kainuma, K. Ishida: Intermetallics 9 (2001) 755.
2. D.G. Morris, M. Leboeuf, S. Gunther, M. Nazmy, Phil Mag A70:1067. 3. C.G. McKamey, J.H DeVan, P.F. Tortorell, V.K. Sikka, J. Mater. Res. 6
(1991) 1779.
4. J. M. Cairney, P.R. Munroe, J. Mater. Sci. Let. 18 (1999) 449. 5. U. Prakash, R.A. Buckley, H. Jones, Mater. Sci. Tech. 9 (1993) 16. 6. Y. Nishino, C. Kumada, S. Asano, Scripta Mater. 36 (1997) 461.
7. Y. Nishino, S. Asano, T. Ogawa, Mater. Sci. Eng. A 234-236 (1997) 271.
8. L. Anthony, B. Fultz, Acta Metall. Mater. 43 (1995) 388.
9. F. Dobeš, P. Kratochvíl, K. Milička, Intermetallics 14 (2006) 1199. 10. S.M. Zhu, K. Sakamoto, M. Tamura, K. Iwasaki, Scripta Mater. 42
(2000) 905.
11. U. Prakash, G. Sauthoff, Intermetallics 9 (2001) 107.
12. F. Stein, A. Schneider, G. Frommeyer, Intermetallics 11 (2003) 71. 13. M. Palm, Intermetallics 13 (2005) 1286.
14. M.G. Mediratta, S.K. Ehlers, H.A. Lipsitt, Metall. Trans. A 18 (1987) 509.
15. O. Ikeda, I. Ohnuma, R. Kainuma, K. Ishida, Intermetallics 9 (2001) 755.
16. M. Palm, G. Sauthoff, Intermetallics 12 (2004) 1345. 17. M. Palm, J. Lacaze, Intermetallics 14 (2006) 1291.
18. G. Ghosh, in: G. Effenberg (Eds.), Ternary Alloy Systems, Springer Berlin Heidelberg, New York, 2005, pp. 426-452.
19. I. Ohnuma, C.G. Schön, R. Kainuma, G. Inden, K. Ishida, Acta Mater. 46 (1998) 2083.
20. S.M. Zhu, K. Sakamoto, M. Tamura, K. Iwasaki, Mater. Trans. JIM. 42 (2001) 484.
21. P.R. Swann, W.R. Duff, R.M. Fisher, Metall. Trans. 3 (1972) 409. 22. S.M. Allen, J.W. Cahn, Acta Metall. 24 (1976) 425.
23. C.W. Su, C.G. Chao, T.F. Liu, Mater. Trans. 48 No.11 (2007) 2993. 24. C.W. Su, C.G. Chao, T.F. Liu, Scripta Mater. 57 (2007) 917.
25. C.W. Su, S.C. Jeng, C.G. Chao, T.F. Liu, Scripta Mater. 57 (2007) 125. 26. K. Sato, K. Tagawa, Y. Inoue, Scripta Metall. 22 (1988) 899.
27. T.F. Liu, J.S. Chou, C.C. Wu, Metal. Trans. A 21 (1990) 1891. 28. K.H. Han, J.C. Yoon, W.K. Choo, Scripta Metall. 20 (1986) 33. 29. C.N. Hwang, T.F. Liu, Scripta Mater. 36 No.8 (1997) 853.
31. K. Sato, K. Tagawa, Y. Inoue, Metal. Trans. A 21 (1990) 5. 32. C.N. Hwang, C.Y. Chao, T.F. Liu, Scripta Metall. 28 (1993) 263. 33. W.K. Choo, J.H. Kim, J.C. Yoon, Acta Mater. 45 (1997) 4877.
34. I.S. Kalashnikov, O. Acselrad, A. Shalkevich, J. Mater. Process. Technol. 136 (2003) 72.
35. G.S. Krivonogov, M.F. Alekseyenko and G.G. Solovyeva, Fiz. Metal. Metalloved 39 No.4 (1975) 775.
36. S.C. Tjong, S.M. Zhu, Mater. Trans. 38 No.2 (1997) 112.
37. I.S. Kalashnikov, O. Aksel’rad, M.S. Khadyev, Metal Sci. Heat Treat. 48 (2006) 5.
38. Kalashnikov, O. Acselrad, A. Shalkevich, L.C. Pereira, J. Mater. Eng. Perform. 9 (2000) 597.
39. I.S. Kalashnikov, B.S. Ermakov, O. Aksel’rad, L.K. Pereira, Metal Sci. Heat Treat. 43 No.11-12 (2001) 493.
40. Y. Kimura, K. Handa, K. Hayashi, Y. Mishima, Intermetallics 12 (2004) 607.
41. S.K. Banerji, Met. Prog. (1987) 59.
42. H.W. Leavenworth, Jr. and J.C. Benz, J. Met. (1985) 36.
43. J. Charles, A. Berghezan, A. Lutts, P.L. Dancoisne, Met. Prog. (1981) 71.
44. R. Wang, F.H. Beck, Met. Prog. (1983) 72.
45. J.C. Grcia, N. Rosas, R.J. Rioja, Met. Prog. (1982) 47. 46. D.J. Schmatz, Trans. ASM. 52 (1960) 898.
47. M.F. Alekseyenko, G.S. Krivonogov, L.G. Kozyreva, I.M. Kachanova, L.V. Arapova, Met. Sci. Heat Treat. 14 No.3-4 (1972) 187.
48. L.I. Lysak, M.F. Alekseyenko, A.G. Drachinskaya, N.A. Storchak, G.S. Krivonogov, Metallofizika 59 No.4 (1975) 29.
49. R.E. Cairns, Jr. and J.L. Ham, U.S. patent, No. 3111405 (1963). 50. I. Briggs, G.J. Russell, A.G. Clegg, J. Mater. Sci. 20 (1985) 668. 51. W.K. Choo, K.H. Han, Metall. Trans. A 16 (1985) 5.
52. W.K. Choo, D.G. Kim, Metall. Trans. A 18 (1987) 759. 53. S.C. Tjong, N.G. Ho, Metallography 21 (1988) 199. 54. G.L. Kayak, Met. Sci. Heat Treat. 22 No.2 (1969)95. 55. S.M. Zhu, S.C. Tjong, Metall. Trans. A 29 (1998)299.
56. I.S. Kalashnikov, O. Acselrad, L.C. Pereira, T. Kalichak, M.S. Khadyyev, J. Mater. Eng. Perform. 9 (2000)334.
57. S.C. Tjong, C.S. Wu, Mater. Sci. Eng. 80 (1986) 203. 58. I.F. Tsu, T.P. Perng, Metall. Trans. A 22 (1991) 215. 59. S.M. Zhu, S.C. Tjong, Scripta Mater. 36 (1997) 317. 60. M. Ruscak, T.P. Perng, Corrosion Oct. (1995) 738.
61. W.T. Tsai, J.B. Duh, J.T. Lee, J. Mater. Sci. 22 (1987) 3517. 62. J.B. Duh, W.T. Tsai, J.T. Lee, Corrosion Nov. (1988) 810.
63. S.C. Chang, J.Y. Liu, H.K. Juang, Corrosion 51 No.5 (1995) 399. 64. C.J. Wang, Y.C. Chang, Mater. Chem. Phys. 76 (2002) 151.
65. C.S. Wang, C.Y. Tsai, C.G. Chao, T.F. Liu, Mater. Trans. 48 (2007) 2973.
66. Y.H. Tuan, C.S. Wang, C.Y. Tsai, C.G. Chao, T.F. Liu, Mater. Chem. Phys. 114 (2009) 595.
67. Y.H. Tuan, C.L. Lin, C.G. Chao, T.F. Liu, Mater. Trans. 49 No.7 (2008) 1589.
68. C.M. Liu, H.C. Cheng, C.Y. Chao, K.L. Ou, J. Alloys and Comp. 488 (2009) 52.
69. C.S. Wang, C.N. Hwang, C.G. Chao, T.F. Liu, Scripta Mater. 57 (2007) 809.
70. K.M. Chang, C.G. Chao, T.F. Liu, Scripta Mater. 63 (2010) 162.
71. C.L. Lin, C.G. Chao, H.Y. Bor, T.F. Liu, Mater. Trans. 51 No.6 (2010) 1084.
Chapter 2.
Phase separation from L2
1
to (B2+L2
1
)
Phase separation from L2
1to (B2+L2
1)
in Fe-24.6Al-7.5Ti alloy
Abstract
As-quenched microstructure of the Fe-24.6 at.% Al-7.5 at.% Ti alloy
was a mixture of (A2+L21) phases. When the as-quenched alloy was
aged at 1173K for moderate times, the L21 domains grew considerably
and B2 phase was formed at a/2<100> anti-phase boundaries (APBs) as
well as phase separation from well-grown L21 to (B2+L21*) occurred
basically contiguous to the APBs, where L21*is also a L21-type phase. With continued aging at 1173K, the phase separation would proceed toward the whole well-grown L21 domains. This microstructural evolution has not been reported in the Fe-Al-Ti alloy systems before.
2-1 Introduction
In previous studies [1-11], it is seen that the Ti addition in the Fe-Al
binary alloys would (1) strongly increase the D03→B2 and B2→A2
transition temperatures [1-10], (2) significantly expand the (A2+ D03)
phase field [5-7], and (3) cause the D03 APBs to exhibit a tendency
toward anisotropy [6]. In addition, a (B2+ L21) (L21 is the ternary
equivalent of the binary D03 structure [3].) two-phase field was reported to be existent at temperatures ranging from 1073 to 1273K in the Fe-Al-Ti ternary alloys [7-11]. It is noted that the (B2+ D03) two-phase field has not been found by previous workers in the Fe-Al binary alloys before [12-13].
However, the existence of the (B2+ L21) two-phase field in the Fe-Al-Ti
ternary alloys was determined principally by using x-ray diffraction, differential scanning calorimetry, differential thermal analysis and electron-probe microanalysis [7-11]. Recently, we have performed transmission electron microscopy (TEM) investigations on the phase transformations of a Fe-23 at.% Al-8.5 at.% Ti alloy aged at 1173K [14]. Consequently, it was found that when the alloy was aged at 1173K for
longer times, the L21 domains grew considerably and an A2→(A2+
L21)→(B2+ L21) transition occurred at a/2<100>APBs. This feature has never been reported by other workers in the Fe-Al-Ti alloy systems before.
Extending the previous work, the purpose of this study is an attempt to examine the microstructural developments of the Fe-24.6 at.% Al-7.5 at.% Ti alloy aged at 1173K. It is noted that according to the previously established isothermal sections of Fe-Al-Ti ternary alloys at 1173K [6-11], the chemical compositions of both the previous alloy and the present alloy
are just located in the (B2+ L21) region. However, the chemical
composition of the present alloy is much closer to the A2/B2/L21 apex
2-2 Experimental Procedure
The Fe-24.6 at.% Al-7.5 at.% Ti alloy was prepared in a vacuum induction furnace by using Fe(99.9%), Al(99.9%) and Ti(99.9%). After being homogenized at 1523K for 48 h, the ingot was sectioned into 2-mm-thick slices. These slices were subsequently solution heat-treated at 1373K for 1 h and then quenched into room-temperature water rapidly. The aging processes were performed at 1173K for various times in a vacuum heat-treated furnace and then quenched rapidly. TEM specimens were prepared by means of double-jet electropolisher with an electrolyte of 67% methanol and 33% nitric acid. Electron microscopy was performed on a JEOL JEM-2000FX scanning transmission electron microscope (STEM) operating at 200kV. This microscope was equipped with a Link ISIS 300 energy-dispersive X-ray spectrometer (EDS) for chemical analysis. Quantitative analyses of elemental concentrations for Fe, Al and Ti were made with the aid of a Cliff-Lorimer ratio thin section method.
2-3 Results and Discussion
Figure 2.1(a) is a selected-area diffraction pattern of the as-quenched alloy, exhibiting the superlattice reflection spots of the ordered L21 phase [14-16]. Figures 2.1(b) and (c) are (200) L21 (or, equivalently, (100) B2)
and (111) L21 dark-field (DF) electron micrographs of the as-quenched
alloy, showing the presence of the small B2 domains and fine D03
domains, respectively [12-13]. In Figures 2.1(b) and (c), it is seen that the
sizes of both B2 and L21 domains are very small, indicating that these
domains were formed during quenching [12-13]. In Figure 2.1(b), it is also seen that a high density of extremely fine disordered A2 phase (dark contrast) could be observed within the B2 domains; otherwise, there would be no contrast within these domains by using a (200) superlattice reflection [6]. Accordingly, the as-quenched microstructure of the alloy was a mixture of (A2+ L21) phases. This is similar to that observed by the present workers in the Fe-23 at.% Al-8.5 at.% Ti alloy quenched from 1373K [14].
Figure 2.2 is a (111) L21 DF electron micrograph of the alloy aged at 1173K for 3 h, clearly revealing that the L21 domains grew significantly and a/2<100> APBs were coated with the disordered A2 phase. However,
Figure 2.1(a)
Figure 2.1(c)
Figure 2.1 Electron micrographs of the as-quenched alloy: (a) a
selected-area diffraction pattern. The foil normal is [01
1
].(hkl: disordered A2, hkl: L21 plane); (b) and (c) (200) and
(111) L21 DF, respectively.
Figure 2.2 (111) L21 DF electron micrograph of the alloy aged at 1173K
after prolonged aging at 1173K, some tiny particles started to form within the A2 phase. A typical example is shown in Figure 2.3. Figures 2.3(a) and (b) are (111) and (200) L21 DF electron micrographs of the alloy aged at 1173K for 6 h, showing that the (111) DF image and the (200) DF image are morphologically identical. Therefore, it is likely to conclude that the microstructure of the alloy aged at 1173K for 6 h was also L21 phase and the a/2<100> APBs were coated with the disordered A2 phase. However,
the (111) L21 DF electron micrograph of the same area as Figure 2.3(a)
with a higher magnification revealed that the a/2<100> APBs were fully
dark in contrast, as shown in Figure 2.3(c); whereas the (200) L21 DF
electron micrograph showed that some tiny particles (indicated with arrows) could be observed at the a/2<100> APBs, as illustrated in Figure 2.3(d). Therefore, it is reasonable to deduce that the tiny bright particles present in Figure 2.3(d) should be of B2 phase, since the (111) reflection spot comes from the L21 phase only; while the (200) reflection spot can
come from both the L21 and B2 phases[12-13]. With continued aging at
1173K, the L21 domains continued to grow and a phase separation
started to occur basically contiguous to a/2<100> APBs of the L21
domains. An example is shown in Figure 2.4. Figure 2.4(a) is a (111) L21 DF electron micrograph of the alloy aged at 1173K for 12 h, showing that
Figure 2.3(a)
Figure 2.3(c)
Fig. 2.3(d)
Figure 2.3 Electron micrographs of the alloy aged at 1173 k for 6 h. (a)
and (b) (111) and (200) L21 DF, respectively. (c) and (d) (111)
and (200) L21 DF with a higher magnification of (a) and (b),
the a/2<100> APBs broadened and well-grown L21 domains decomposed into fine L21 domains (designated as L21* phase to be distinguished from the original L21 phase) separated by dark layers. Figure 2.4(b) is a (200)
L21 DF electron micrograph taken from the same area as Figure 2.4(a),
clearly revealing that in addition to the presence of a few A2 particles, the whole region is bright in contrast. This indicates that the broadened dark lines on a/2<100> APBs and dark layers around the periphery of the L21* domains should be of the B2 phase. It is apparent that the B2 phase was formed at a/2<100> APBs and phase separation from L21 to (B2+ L21*) occurred basically contiguous to the a/2<100> APBs. Figure 2.5(a) is a
(111) L21 DF electron micrograph of the alloy aged at 1173K for 24 h,
indicating that with increasing aging time, the phase separation would proceed toward the inside of the L21 domains. Figure 2.5(b), (200) L21 DF electron micrograph taken from the same area as Figure 2.5(a), clearly reveals that only one a/2<100> APB and one A2 particle (indicated with arrows in Figures 2.5(a) and (b)) could be observed. Figures 2.6(a) and (b)
are (111) and (200) L21 DF electron micrographs of the alloy aged at
1173K for 36 h, revealing that besides a little A2 phase, the well-grown L21 domains decomposed into the (B2+ L21*) phases completely.
Figure 2.4(a)
Figure 2.4(b)
Figure 2.4 Electron micrographs of the alloy aged at 1173 k for 12 h.
Figure 2.5(a)
Figure 2.5(b)
Figure 2.5 Electron micrographs of the alloy aged at 1173 k for 24 h.
Figure 2.6(a)
Figure 2.6(b)
Figure 2.6 Electron micrographs of the alloy aged at 1173 k for 36 h.
Based on the above observations, some important experimental results are discussed below. When the present alloy was aged at 1173K for moderate times, the B2 phase was formed at a/2<100> APBs and
phase separation from well-grown L21 to (B2+ L21*) occurred basically
contiguous to the APBs. With increased aging time at 1173K, the phase
separation would proceed toward the inside of the whole well-grown L21
domains. This finding is different from that observed by the present workers in the Fe-23 at.% Al-8.5 at.% Ti alloy[14], in which we have demonstrated that when the Fe-23 at.% Al-8.5 at.% Ti alloy was aged at 1173K, the mixture of the (B2+ L21) phases occurred at a/2<100> APBs and no evidence of the phase separation could be observed. In order to clarify the apparent difference, an STEM-EDS study was undertaken. The
EDS analyses were taken from the areas of the L21 domains, APBs, B2
phase and L21* domains marked as “L”, “A”, “B” and “L*” in Figures. 2.2 through 2.6, respectively. The average concentrations of the alloying elements obtained by analyzing at least ten different EDS spectra of each phase are listed in Table 2.1. For comparison, the chemical composition of the as-quenched alloy is also listed in Table 2.1. It is clearly seen in Table 2.1 that when the alloy was aged at 1173K for 3h, the Al and Ti concentrations in the L21 domains were distinctly higher than those in the
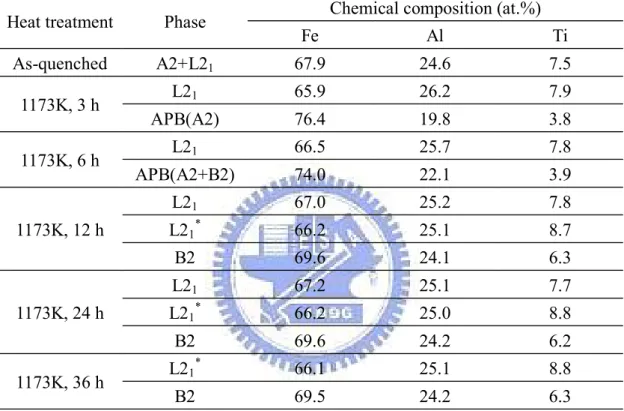
Table 2.1 Chemical compositions of the phases revealed by EDS.
Heat treatment Phase Chemical composition (at.%)
Fe Al Ti As-quenched A2+L21 67.9 24.6 7.5 1173K, 3 h L21 65.9 26.2 7.9 APB(A2) 76.4 19.8 3.8 1173K, 6 h L21 66.5 25.7 7.8 APB(A2+B2) 74.0 22.1 3.9 1173K, 12 h L21 67.0 25.2 7.8 L21* 66.2 25.1 8.7 B2 69.6 24.1 6.3 1173K, 24 h L21 67.2 25.1 7.7 L21* 66.2 25.0 8.8 B2 69.6 24.2 6.2 1173K, 36 h L21 * 66.1 25.1 8.8 B2 69.5 24.2 6.3
as-quenched alloy. This means that along with the growth of the L21 domains, the concentrations of both Al and Ti at a/2<100> APBs would be lacking. The insufficient concentrations of both Al (19.8 at.%) and Ti (3.8 at.%) would cause the disordered A2 phase to form at a/2<100> APBs, which is consistent with the previously established Fe-Al-Ti phase diagram as shown in Figure 2.7 [10]. According to the phase diagram, the chemical composition of Fe-19.8 at.% Al-3.8 at.% Ti is just located in the A2 phase region. EDS analyses indicated that when the alloy was aged at 1173K for 3-12 h, the Ti concentration in the L21 domains maintained to be about 7.8 at.% and the Al concentration gradually decreased with increasing the aging time. It is thus expected that the Al atom would proceed to diffuse toward the a/2<100> APBs during aging. In Table 2.1, it is seen that when the alloy was aged at 1173K for 6 h, the Al concentration at a/2<100> APBs increased to 22.1 at.%. The significant increase of the Al concentration would lead the tiny B2 particles to form at a/2<100> APBs, which is also consistent with the Fe-Al-Ti phase diagram in Figure 2.7 [10]. In the phase diagram, it is clearly seen that the chemical composition of Fe-22.1 at.% Al-3.9 at.% Ti is close to the A2/B2
transition boundary. With increasing the aging time, the L21 domains
concentration of the L21 domains in the alloy aged for 6 h was 25.7 at.% while that for 12 h was 25.2 at.%, which gave a decrease of only 0.5 at.%.
However, along with the enlargement of the L21 domain size, the volume
fraction of the a/2<100> APBs would be lessened considerably. This means that the slight decrease of the Al concentration in the L21 domains would cause the Al concentration at a/2<100> APBs to increase appreciably. Therefore, it is reasonable to believe that due to the appreciable increase of the Al concentration, the A2 phase existing at a/2<100> APBs would be transformed to B2 phase [10], as observed in Figure 2.4(a). TEM observations indicated that along with the formation of
the B2 phase, the phase separation from well-grown L21 to (B2+ L21*)
occurred basically contiguous to a/2<100> APBs. In the following
description, we will attempt to discuss why the well-grown L21 domains
underwent the phase separation. In the previous studies, it is well-known that the D03 phase could be found to exist in the Fe-Al binary alloys only at temperatures below 823K [12-13], and the Ti addition in the Fe-Al
(L21)→B2 transition temperature about 60K/at.% [6-11]. Obviously, the Ti concentration would be the predominant factor for the stabilization of the
L21 phase at high temperature. In our previous study of the Fe-23 at.%
Al-8.5 at.% Ti alloy aged at 1173K for 6-24 h [14], it was found that the Ti
concentration in the well-grown L21 domains was up to about 11.1 at.%,
therefore, the L21 phase exhibited more stable and no evidence of the
phase separation could be detected. However, when the present alloy was aged at 1173K for 6-24 h, the Ti concentration in the well-grown L21 domains was found to be only about 7.8 at.%, which is noticeably lower than that detected in the previous alloy. Therefore, it is plausible to
suggest that owing to the lower Ti concentration, the well-grown L21
domains seemed not very stable at 1173K. Consequently, the well-grown
L21 domains would separate to the mixture of the Ti-riched L21* and
Ti-lacked B2 phase, as observed in Figures 2.4 through 2.6.
Finally, three more features are worthwhile to note as follows: (1) In the previous study [14], it is clearly seen that the a/2<100> APBs of the
well-grown L21 domains exhibited more pronounced anisotropy than
those observed in the present alloy. The reason is possibly that the well-grown L21 domains in the previous alloy had significantly higher Ti concentration. (2) The chemical composition of the previous alloy had
higher Ti and lower Al contents [14]. When the previous alloy was aged at
1173K, the L21 domains grew rapidly and the Ti atom was the major
element for diffusing into the a/2<100> APBs. This effect caused the tiny L21 particles to precipitate preferentially at a/2<100> APBs [14]. However, when the present alloy was aged at 1173K, the Ti concentration in the
well-grown L21 domains maintained to be about 7.8 at.% and the Al atom
played the dominant role to diffuse into the a/2<100> APBs. Therefore, the tiny B2 particles were found to form at the a/2<100> APBs, rather than L21 particles. (3) According to the Fe-Al-Ti phase diagrams [6-11], the A2 phase can not appear for the Fe-24.6 at.% Al-7.5 at.% Ti alloy. However, a little A2 phase was always observed in the present alloy aged at 1173K for 12-36 h. The reason for the difference is plausibly that the phase diagrams were determined by the Fe-Al-Ti alloys heat-treated at 1173K for a time period longer than 336 h, whereas the present alloy was aged for 36 h only. Actually, in the present study, it was found that when the as-quenched alloy was aged at 1173K for 3-36 h, the amount of the A2 phase was indeed decreased with increasing the aging time.
2-4 Conclusions
In the as-quenched condition, the microstructure of the Fe-24.6 at.%
Al-7.5 at.% Ti alloy was the mixture of (A2+ L21) phases. When the
as-quenched alloy was aged at 1173K for 6 h, the L21 domains grew
considerably and the B2 phase was formed at a/2<100> APBs as well as
the phase separation from well-grown L21 to (B2+ L21*) occurred
basically contiguous to the a/2<100> APBs. After prolonged aging at 1173K, the phase separation would proceed toward the inside of the
whole well-grown L21 domains. Consequently, the microstructure of the
alloy aged at 1173K for 36 h was essentially the mixture of (B2+ L21*)
References
1. Y. Nishino, S. Asano, T. Ogawa, Mater. Sci. Eng. A 234–236 (1997) 271-274.
2. F. Stein, A. Schneider, G. Frommeyer, Intermetallics 11 (2003) 71-82. 3. M. Palm, Intermetallics 13 (2005) 1286-1295.
4. L. Anthony, B. Fultz, Acta Metall. Mater. 43 (1995) 3885-3891.
5. O. Ikeda, I. Ohnuma, R. Kainuma, K. Ishida, Intermetallics 9 (2001) 755-761.
6. M.G. Mendiratta, S.K. Ehlers, H.A. Lipsitt, Metall. Trans. A 18 (1987) 509-518.
7. I. Ohnuma, C.G. Schon, R. Kainuma, G. Inden, K. Ishida, Acta Mater.
46 (1998) 2083-2094.
8. S.M. Zhu, K. Sakamoto, M. Tamura, K. Iwasaki, Mater. Trans. JIM 42 (2001) 484-490.
9. M. Palm, G. Sauthoff, Intermetallics 12 (2004) 13451359. 10. M. Palm, J. Lacaze, Intermetallics 14 (2006) 1291-1303.
11. G. Ghosh, in: G. Effenberg (Ed.), Ternary Alloy Systems, Springer, Berlin, 2005, pp. 426-452.
12. P.R. Swann, W.R. Duff, R.M. Fisher, Metall. Trans. 3 (1972) 409-419. 13. S.M. Allen, J.W. Cahn, Acta Metall. 24 (1976) 425-436.
14. C.W. Su, C.G. Chao and T.F. Liu: Scr. Mater. 57 (2007) 917-920. 15. S.Y. Yang and T.F. Liu: Scr. Mater. 54 (2006) 931-935.
Chapter 3.
Effect of Carbon on Spinodal
Decomposition in Fe-20Al-26Mn-C
Effect of Carbon on Spinodal Decomposition in
Fe-20Al -26Mn-C Alloys
Abstract
The supersaturated austenite (γ) phase decomposed into fine C-rich ordered k′ carbides and C-depleted γ0 phase during quenching in alloys with 5.5≤C≤8.0 at.%. The misfit between k′ carbides and γ0 phase decreased with increasing carbon content. The strain energy increased dramatically as carbon content approached slightly below 5.5 at.%. undercooling may be insufficient to overcome the strain energy effects, thus leading to the absence of spinodal decomposition and k′ carbides in the present and prior austenitic FeAlMnC alloys with 3.1≤C≤5.2 at.% under the as-quenched condition. Additionally, both the amount of ordered k′ carbides and the carbon concentration in the k′ carbides increased with increasing carbon content of the alloy. These results revealed that a higher degree of carbon supersaturation in the initial γ phase might promote a tendency toward C-rich k′ particle formation during quenching.
3-1 Introduction
The microstructural developments in fully austenitic FeAlMnC alloys prepared by conventional casting processes have been extensively studied by many researchers [1-11]. In these studies, when an alloy with a chemical composition in the range of Fe-(7.8–11.8) wt.%Al-(28– 34.3) wt.%Mn-(0.74–1.3) wt.%C (Fe-(14.2–20.9) at.%Al-(25–30.1) at.% Mn-(3.1–5.2) at.%C) was solution heat-treated in the single austenite (γ) phase (disordered face-centered cubic (fcc)) region and then quenched rapidly, the microstructure of the alloy was single-phase γ [1-11]. When the as-quenched alloy was aged at 500–550 °C for moderate periods of
time, fine (Fe,Mn)3AlCX carbides (k′ carbides) began to precipitate
coherently within the γ matrix [1-11]. The (Fe,Mn)3AlCX carbides has an
ordered fcc crystal structure which belongs to the L′12 type [3-8].
Recently, we performed transmission electron microscopy observations on the phase transformations of an Fe -9 wt.%Al-30 wt.%Mn -2 wt.%C (Fe-16 at.%Al-26 at.%Mn-8at.%C) alloy [12]. Consequently, we found that the microstructure of the alloy in the as-quenched condition was γ phase, which contained fine k′ carbides formed within the γ matrix by spinodal decomposition during quenching. This is quite different from that observed in the austenitic FeAlMnC alloys with 3.1≤C≤5.2 at.%, in
which fine k′ carbides could only be observed in aged alloys [3-11]. This finding suggests that the carbon content may play an important role in the formation of fine k′ carbides within the γ matrix during quenching. However, to date, the reason why adding a greater amount of carbon could lead to this result is unclear. Therefore, the main purpose of this work is to study systematically the effect of carbon content on the as-quenched microstructure of Fe-20 at.%Al-26 at.%Mn-C alloys with 5.0≤C≤8.0 at.%.
3-2 Experimental procedure
Seven alloys, Fe-20at.%Al-26at.%Mn-C (alloys A (5 C), B (5.5 C), C (6 C), D (6.5 C), E (7 C), F (7.5 C), and G (8 C)), were selected for investigation in the present study. The alloys were prepared in a vacuum induction furnace using pure Fe, Mn, Al, and carbon powder. After homogenization at 1250 °C for 12 h under a controlled protective argon atmosphere, the ingots were hot-rolled and then cold-rolled to a final thickness of 2.0 mm. The sheets were subsequently solution heat-treated at 1200 °C for 2 h and then rapidly quenched in room-temperature water. X-ray diffraction (XRD) experiments were carried out by using a Bruker
D8 model with Cu-Kα radiation operating at 40 kV and 20 mA. Electron
microscopy specimens were prepared by means of a double-jet electropolisher with an electrolyte solution of 10 vol.% perchloric acid, 30 vol.% acetic acid, and 60 vol.% ethanol. Electron microscopy was performed on a JEOL-2100 transmission electron microscope operating at 200 kV. The mean size of the fine k′ particles was determined by a LECO 2000 image analyzer.
3-3 Results and discussion
Figure 3.1 shows the XRD profiles of the seven alloys in the as-quenched condition. The profile of alloy A (5 C) reveals only the
fundamental (200)γ reflection. However, sideband peaks around the
(200)γ reflection could be observed in alloys B (5.5 C) through G (8 C).
The peak appearing on the low-angle side was the (200)k′ reflection of
C-rich k′ carbides, whereas that appearing on the high-angle side was the
(200)γ0 reflection of the C-depleted γ0 phase[9]. The presence of
sidebands demonstrates that the ordered C-rich k′ carbides and
C-depleted γ0 phase were formed through spinodal decomposition during
quenching in alloys with 5.5≤C≤8.0 at.% [5-7,9]. Moreover, the intensity of the (200)k′ peak increased with increasing carbon content, and the (200)γ,
(200)k′, and (200)γ0 peaks all shifted to smaller Bragg angles. This
indicates that the amount of k′ particles, as well as all the lattice
parameters of γ, k′ carbides, and γ0 phases, increased with increasing
carbon content. It is also shown in Figure 3.1 that with increasing carbon content, the sidebands moved closer to the main (200)γ peak, indicating
that differences in the parameters between k′ carbides and γ0 phase
decreased. The experimental data above measured from the XRD profiles are listed in Table 3.1. The misfit (δk′-γ0) was calculated using the equation:
Figure 3.1 X-ray diffraction profiles around the (200)γ Bragg reflection for
δk′-γ0 = 2 0 0 k γ k γ
a
a
|
|
a
a
′ ′−
+
(1)For comparison, the misfit δk′-γ was also calculated. Both are listed in Table 3.1. The modulation wavelength was determined using the Daniel-Lipson equation [6-9]:
Δ
θ
(
h
+
k
+
l
)
θ
tan
ha
=
λ
2γ 2 2 (2)where λ = the average modulation wavelength; θ = the Bragg angle for the γ peak; Δθ = the angular spacing between the sideband and the main (200)γ Bragg peak; and h, k, l = the Miller indices of the Bragg peak (h = 2, and k, l = 0). From Table 3.1, it is clear that increasing the carbon content causes the misfit to decrease and the wavelength to increase.
Figures 3.2a through c show selected-area diffraction patterns (SADPs) of alloys A (5 C), D (6.5 C), and G (8 C), respectively. In addition to the fundamental (200)γ diffraction spot, neither the diffraction spot of ordered k′ carbides nor the satellites could be detected in alloy A (5 C). However, both the ordered k′ carbides diffraction spot and satellites could clearly be observed in alloys D (6.5 C) and G (8 C). Evidently, spinodal decomposition and formation of ordered k′ carbides occurred during quenching. In Figures 3.2b and c, it is also seen that in alloy G (8 C), which has a higher carbon content, the (100) spot is relatively brighter
Figure 3.2 Transmission electron micrographs of the present alloys in the
as-quenched condition. (a)-(c) SADPs of alloys A (5 C), D(6.5
C), and G (8 C), respectively. (hkl: k′ carbides), (d)-(e) (100)k′
and the spacing between satellites and the main spot is comparatively
smaller. The misfit (δk′-γ0) and wavelength (λ), obtained from
measurements of the spacing between the satellites and the main spot along the [100] direction in the SADPs, were 2.24% and 15.7 nm for alloy D (6.5 C), as well as 1.59% and 22.3 nm for alloy G (8 C), respectively. Figures 3.2d and e are two dark-field (DF) electron micrographs taken with the (100)k′ superlattice reflection in the [001] zone. They reveal that the amount of ordered k′ carbides in alloy G (8 C) was significantly greater than that in alloy D (6.5 C). In these figures, it is also seen that fine k′ carbides were formed along the <100> direction, consistent with the appearance of the satellites along the <100> reciprocal lattice directions in Figures 3.2b and c. These results obtained by TEM were in good agreement with those investigated by XRD. Image analyses of Figures 3.2d and e indicated that the mean sizes of fine k′ carbides formed in alloys D (6.5 C) and G (8 C) were about 6 and 11 nm, respectively. A detailed TEM examination revealed that although the values of misfit (δk′-γ0) in alloys D (6.5 C) and G (8 C) reached 2.24 and 1.59%, respectively, no misfit dislocations could be observed on the
interface between the k′ carbides and the γ0 phase. The reason is
of misfit (δk′-γ0), the expected distances between two misfit dislocations in alloys D (6.5 C) and G (8 C) were calculated to be about 16.6 and 23.6 nm, respectively, which is much larger than the size of the k′ carbides.
Based on the preceding results, some discussion is appropriate. The microstructure of the present alloy A (5 C) in the as-quenched condition was single-phase γ, which is similar to that observed in as-quenched austenitic FeAlMnC alloys with 3.1≤C≤5.2 at.% [1-11]. However, spinodal decomposition and formation of ordered k′ carbides occurred during quenching in the present alloys with 5.5≤C≤8.0 at.%. Regarding spinodal decomposition, two important factors should be considered: (1) interfacial energy effects, and (2) coherency strain energy effects [13]. The k′ carbides is a fcc-based phase of L′12 ordered crystal structure with a C atom at the body center site, an Al atom at the corner positions, and three (Fe, Mn) atoms positioned randomly at the face center sites in its fcc-based unit cell [8]. On the other hand, γ0 is a disordered fcc phase with C atoms positioned randomly at the octahedral interstitial sites. As the γ0 phase and ordered k′ carbides have the same fcc-based crystal structure and similar lattice parameters, their interface would be fully coherent. Therefore, only chemical contributions should be considered to the interfacial energy [13]. The carbon concentration in the equilibrium
(Fe,Mn)3AlCX carbides of austenitic FeAlMnC alloys aged at 500–550 °C for longer times has been studied by several workers. Consequently, three different values of X have been obtained (0.4, 0.6, and 0.66) [6,9,11]. Furthermore, to the authors’ knowledge, no information concerning the interfacial energy between the γ0 phase and ordered k′ carbides has been provided in previous studies. Additionally, in the early stage of spinodal decomposition, the composition fluctuation profile exhibited a sinusoidal wave [6,14]. Therefore, a conclusive description of the interfacial energy
between the γ0 phase and ordered k′ carbides cannot be given in the
present study.
Since the composition ratio of (Fe, Mn) and Al in all of the present
alloys approximates that of (Fe,Mn)3AlCX carbides, it is plausible to
suggest that the composition fluctuation was primarily due to the carbon atom. As is evident from the experimental results above, all the lattice parameters of the phases increased with increasing carbon content of the alloy. This suggests that the carbon concentration in these phases increased simultaneously. However, the carbon contribution to the increase in the lattice parameter of the ordered k′ carbides is distinctively
less than in the disordered γ0 phase [15]. Therefore, although all the
the increment in the disordered γ0 phase was larger than that in the ordered k′ carbides. Consequently, the misfit between the ordered k′
carbides and disordered γ0 phase would be reduced with increasing
carbon content, which is consistent with the results obtained by XRD and TEM. To emphasize the characteristics, the variations in the lattice parameters and misfits as a function of carbon content are plotted in Figure 3.3. For a fully coherent interface, the coherency strain energy would be roughly proportional to δ2 [13]. In Table 3.1, it is clearly seen that the δ2k′-γ0 in alloy G (8 C) is only 2.424, whereas that in alloy B (5.5 C) is 8.638. This indicates that the strain energy in alloy B (5.5 C) is about 3.56
times that of alloy G (8 C). The average change in δ2k′-γ0 between two
adjacent alloys (Δδ2k′-γ0/0.5 at.%) was calculated from Table 3.1. In terms of our calculations, it was found that the values between alloys B (5.5 C)-C (6 C), alloys C (6 C)-D (6.5 C), alloys D (6.5 C)-E (7 C), alloys E (7 C)-F (7.5 C), and alloys F (7.5 C)-G (8 C) were about 4.261, 3.406, 2.260, 1.406, and 1.096, respectively, which corresponds to a ratio of 3.89: 3.11: 2.06: 1.28: 1. This means that the average increment of strain energy per decrement of at.% C between 6 and 5.5 at.% C is 3.89 times greater than that between 8 and 7.5 at.% C. The variation in δ2k′-γ0 with carbon content is also plotted in Figure 3.3. The dotted line shows the expected values
Figure 3.3 Variations in the lattice parameters of k′(■), γ ( ), and◆ γ0 (●)
phases, as well as δk′-γ0 (□) and δ2k′-γ0 (○), as a function of the